2538 Swale Run · Colorado Springs, CO
Flood risk 1/10 · Minimal
- FEMA flood zone
- X (unshaded)
- Chance of flooding over 30 yrs
- 0.0%
- Est. flood insurance / yr
- $507 – $1,088
Fire risk 6/10 · Moderate
- Est. fire insurance / yr
- $939 – $1,743
Heat risk 2/10 · Minimal
- Hot days now (above 90°F)
- 6 days/yr
- Hot days in 30 yrs
- 16 days/yr
Wind risk 2/10 · Minimal
- Chance of severe wind over 30 yrs
- —
Air-quality risk 1/10 · Minimal
- Unhealthy air days now
- 0 days/yr
- Unhealthy air days in 30 yrs
- 0 days/yr
Risk factors via First Street. Map © Google.
Why this score? — see what drove the B- grade
The composite is a weighted blend of 9 inputs, each scored 0–100. Each bar is that input's sub-score; the figure is the points it added to the 100-point composite (weight × sub-score).
- Cash flow +30.0/30.0
- 1% rule +10.0/10.0
- DSCR +10.0/10.0
- ARV discount +7.5/15.0
- Livability +3.9/5.0
- Rent growth +3.1/5.0
- Schools +2.1/10.0
- Condition / age +2.0/5.0
- Appreciation +0.0/10.0
$73,000
🖨 Deal sheet (PDF) 📄 Offer letter ✓ Due diligence
Listing remarks
This 3-bedroom, 1-bath mobile home offers plenty of space and a great opportunity for buyers looking to add their personal touch. The home features a functional layout with comfortable living areas and generously sized bedrooms. With a little cosmetic updating, this property has excellent potential as a primary residence, rental, or investment opportunity. The spacious interior provides a solid foundation to renovate and create a warm and inviting home. Sold as-is, making it a great option for investors, renovators, or buyers seeking an affordable property with upside potential.
Key facts
- Built 1979
- Listed 23 days
Neighborhood map
What this means for you Summary
Snapshot
- This is a 3-bed/1.0-bath other listed at $73k. Condition is rated fair.
Deal economics
- At list price, monthly cash flow is $790 ($9k/yr) — positive.
- The deal already cash-flows at list — no discount required.
- Meets the 1% rule at list price ($2k rent vs $73k).
- Recommended offer: $72k (1.5% below list) — sets the bar for market timing.
- Cap rate 19.3% vs local median 3.3% in Colorado Springs — top-decile yield for the area; either an underpriced asset or a hidden risk that comps aren't pricing in. Stress-test before assuming the spread holds.
Location & tenants
- Location reads 78/100 on livability (#23 in CO, #2,639 nationally) — a middle-class / working-renter tenant base. Strengths: amenities A+, housing A+, health & safety A+; Watch: cost of living C-, crime F.
- Harrison School District No. 2 In The County Of El Paso An (urban): math 16% / reading 35% proficiency, ranked #67 of 86 in CO (top 78%) — low school quality limits family demand, transient renter base, plan for 1-2y turnover; 62% free/reduced lunch — lower-income household profile, screen leases tightly.
- Market conditions: Rents rising (+2.4%/yr); 183 active listings in the ZIP; 18 comparable units currently listed for rent nearby; rentals at typical pace (median 15d on market — plan ~3-4 weeks tenant-placement turnaround); 3,906 units permitted in El Paso County in 2024 (872 in 5+ unit buildings).
Forward outlook
- Local home prices are declining (-3.0%/yr); year-one equity from $505 of loan paydown is wiped out by about $2k of value loss. Plan a longer hold.
- El Paso County population projected at +28% by 2050 — long-run rental-demand tailwind backs the buy-and-hold thesis.
- At projected returns (-3.0% appreciation + 2.4% rent growth), your $20k cash investment doubles in ~3 years — after that, you're playing with house money.
Negotiation context
- It's been on market 23 days — a 2% lower offer ($72k) is reasonable based on typical stale-listing flexibility.
Risks & watch-outs
- Climate carrying-cost: major wildfire risk — expect insurance premiums to compound above CPI over the hold.
Questions for the listing agent
- Have any recent inspections been done? Can we get a copy of the seller's disclosures and any deferred-maintenance estimates?
- Built in 1979 — when were the roof, HVAC, electrical panel, plumbing, and water heater last replaced?
- Is there a deadline driving the sale (1031 exchange, divorce, estate, relocation)? That informs how much negotiation room exists.
- Schools are B-rated — typically a magnet for longer-tenancy family renters. What's the average tenant stay here, and is there a school-zone premium baked into asking?
- Crime grade is F in this area — have there been break-ins, vandalism, or insurance claims at this property in the last 3 years? What carrier currently insures it and at what premium?
- What's the average days-on-market for RENTAL listings here right now (not sales)? A rising rental-DOM trend means longer vacancies and softer asking-rent achievability than the comps imply.
- What's the recent tenant-quality profile in this submarket — average credit score on applications, eviction rate, late-payment / NSF rate, and stable-employment percentage? A property-management company in the area should have these aggregated.
- How much new for-sale + rental construction is in the pipeline within 1–3 miles? Heavy new supply typically softens prices + rents 12–24 months out; constrained supply supports both.
Investment metrics
- 1% rule
- 2.24% ✓
- Cap rate
- 19.28%
- Cash-on-cash
- 46.38%
- DSCR
- 3.06
- GRM
- 3.7
CMA / ARV
No comps found within radius.
Projected returns pro-forma
-3.0% appreciation · 2.36% rent growth · sell at horizon
- IRR
- 42.9%
- Equity multiple
- 2.83×
- Total profit
- $37,464
- Equity at exit
- $10,885
- IRR
- 48.7%
- Equity multiple
- 5.56×
- Total profit
- $93,267
- Equity at exit
- $6,312
Cash invested: $20,440 (down + closing). Projections, not guarantees.
Landlord ↔ Tenant lean methodology
- Overall (STATE)
- 38 Tenant-Leaning
- State Colorado
- 38 Tenant-Leaning · D+4
- County
- — inherits STATE
- City
- — inherits STATE
ZIP-level market 80916
- Home prices YoY
- -27.6%
- Rents YoY
- 2.4%
- Active inventory
- 183
- Price-to-rent
- 3.7×
Monthly cashflow live
- Estimated rent
- $1,639 high interval (Pro) →
- Mortgage (P&I)
- −$383
- Tax est. 1.5%
- −$91 /mo · $1,095/yr
- Insurance
- −$30
- HOA
- −$0
- Vacancy / Maint / Mgmt
- −$344
- Net cashflow
- $790
Break-even live
Sensitivity live
| Price | -10% $840 | -5% $815 | +0% $790 | +5% $765 | +10% $740 |
|---|---|---|---|---|---|
| Rent | -10% $661 | -5% $725 | +0% $790 | +5% $855 | +10% $919 |
| Rate | -1.0pp $827 | -0.5pp $809 | base $790 | +0.5pp $771 | +1.0pp $752 |
UW: 25.0% down · 7.5% · 30yr · 1.5% tax · 5.0% vac · 8.0% maint · 8.0% mgmt
Financing live
Cash to close
- Down payment
- $18,250
- Closing costs
- $2,190
- Reserves months
- —
- Total cash needed
- —
Loan-product check · same deal, 3 products live
Conventional
25% down · 7.5% · 30yr
- Down + closing
- —
- Monthly P&I
- —
- Monthly cashflow
- —
- DSCR
- —
- Eligible?
- —
Personal DTI + credit; lowest rate.
DSCR
20% down · 8.5% · 30yr
- Down + closing
- —
- Monthly P&I
- —
- Monthly cashflow
- —
- DSCR
- —
- Eligible?
- —
No personal income docs; deal must DSCR.
Hard money
10% down · 12.0% · 12mo
- Down + closing
- —
- Monthly P&I
- —
- Monthly cashflow
- —
- DSCR
- —
- Eligible?
- —
Short-term bridge; refi at stabilization.
Rent comps 18 comps
| Address | Beds | Baths | Sqft | Rent | $/sqft | DOM | Units | Dist |
|---|---|---|---|---|---|---|---|---|
| 4537 Lamplighter Cir Colorado Springs, CO | 2.0 | 1.5 | 1028 | $1,195 | $1.16 | 3d | 1 | 0.69mi |
| 2521 Astrozon Cir Unit 2523 Colorado Springs, CO | 2.0 | 1.0 | 800 | $1,395 | $1.74 | 3d | 1 | 0.70mi |
| 2521 Astrozon Cir Unit 2525 Colorado Springs, CO | 2.0 | 1.0 | 800 | $1,395 | $1.74 | 15d | 1 | 0.70mi |
| 4960 Fountain Ford Vw Colorado Springs, CO | 1.0–3.0 | 1.0–2.0 | 973 | $2,311 | $2.38 | 3d | 28 | 0.88mi |
| 1737 Ramjet PT Colorado Springs, CO | 2.0 | 1.0–2.0 | 642 | $1,784 | $2.78 | 3d | 42 | 0.93mi |
| 4703 Goodwin Grv Colorado Springs, CO | 2.0 | 1.0–2.0 | 605 | $1,525 | $2.52 | 3d | 8 | 1.09mi |
| 4221 Baytown Dr Unit 4221 Colorado Springs, CO | 2.0 | 2.0 | 1067 | $1,650 | $1.55 | 22d | 1 | 1.18mi |
| 3178 Starlight Cir Colorado Springs, CO | 2.0 | 1.5 | 928 | $1,550 | $1.67 | 24d | 1 | 1.20mi |
| 4325 Fountain Springs Grv Colorado Springs, CO | 1.0–3.0 | 1.0–2.0 | 920 | $1,658 | $1.80 | 3d | 5 | 1.24mi |
| 3066 Starlight Cir Colorado Springs, CO | 2.0 | 1.5 | 928 | $1,300 | $1.40 | 3d | 1 | 1.27mi |
| 3310 Cochran Dr Unit D Colorado Springs, CO | 2.0 | 1.0 | 850 | $1,249 | $1.47 | 24d | 1 | 1.28mi |
| 3080 Starlight Cir Colorado Springs, CO | 2.0 | 2.0 | 928 | $1,650 | $1.78 | 24d | 1 | 1.28mi |
| 1960 S Chelton Rd Colorado Springs, CO | 3.0 | 1.0–2.0 | 810 | $1,385 | $1.71 | 24d | 1 | 1.29mi |
| 4710 Spacewalk Way Colorado Springs, CO | 2.0 | 2.0 | 1068 | $2,049 | $1.92 | 3d | 1 | 1.30mi |
| 3445 Cochran Dr Unit B Colorado Springs, CO | 2.0 | 1.0 | 884 | $1,400 | $1.58 | 24d | 1 | 1.30mi |
| 3475 Cochran Dr Colorado Springs, CO | 2.0 | 1.0 | 884 | $1,250 | $1.41 | 22d | 1 | 1.31mi |
| 4046 Mallette Hts Colorado Springs, CO | 1.0–2.0 | 1.0–2.0 | 737 | $1,659 | $2.25 | 3d | 6 | 1.32mi |
| 3480 Cochran Dr Colorado Springs, CO | 2.0 | 1.0 | 884 | $995 | $1.13 | 22d | 1 | 1.33mi |
Listing history 16 events
-
2026-06-18days on market $73,000 Active 23 DOM
-
2026-06-17days on market $73,000 Active 22 DOM
-
2026-06-16days on market $73,000 Active 21 DOM
-
2026-06-15days on market $73,000 Active 20 DOM
-
2026-06-14days on market $73,000 Active 18 DOM
-
2026-06-13days on market $73,000 Active 17 DOM
-
2026-06-10days on market $73,000 Active 15 DOM
-
2026-06-09days on market $73,000 Active 14 DOM
-
2026-06-08days on market $73,000 Active 13 DOM
-
2026-06-07days on market $73,000 Active 12 DOM
-
2026-06-05days on market $73,000 Active 9 DOM
-
2026-06-03days on market $73,000 Active 8 DOM
-
2026-06-03days on market $73,000 Active 7 DOM
-
2026-06-01days on market $73,000 Active 6 DOM
-
2026-05-31days on market $73,000 Active 5 DOM
-
2026-05-26$73,000 Active
ⓘ Source: listings_history table (triggers on properties + properties_extension) + one-shot
backfill from property_details.listing_events for pre-trigger history.
Climate risk First Street
- Flood 1/10 Low FEMA zone X (unshaded) · 0% chance over 30 yrs
- Wildfire 6/10 Major
- Heat 2/10 Low 6 d/yr ≥90°F today · 16 d/yr by 30 yrs out
- Wind 2/10 Low
- Air quality 1/10 Low 0 unhealthy d/yr today · 0 by 30 yrs out
Nearby sold comps map
Loading sold comps map…
Walkable amenities ~0.75 mi
Loading nearby amenities…
Taxation est. · year 1
- Rental income
- $19,663
- − Mortgage interest
- −$4,089
- − Property taxes
- −$1,095
- − Insurance
- −$365
- − Repairs & maintenance
- −$1,573
- − Management
- −$1,573
- − Depreciation
- −$2,124
- Taxable income
- $8,845
- Est. tax owed @ 24.0%
- −$2,123
- After-tax cash flow
- $7,358/yr
For passive investors: Depreciation is non-cash, so a rental often shows a tax loss while cash-flowing — sheltering income. Rental losses are passive: they offset passive income freely, and up to $25,000/yr can offset ordinary (W-2) income if you actively participate and your MAGI is under $100k (phasing out to $0 by $150k); unused losses carry forward. On sale, claimed depreciation is recaptured at up to 25%, and gains may owe capital-gains tax (a 1031 exchange can defer both). Figures are a year-1 estimate at your 24.0% rate — not tax advice; consult a CPA.
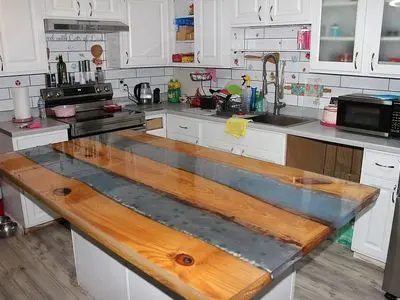
Condition & rehab AI · 1 photo
This mobile home requires cosmetic updates, including painting and replacing countertops, to improve its resale and rental value.
Repairs flagged
- Major Exposed wooden beams — Structural damage
- Major Concrete countertops — Aesthetic and durability issues
Value-add opportunities
- Resale Paint interior walls — Enhances curb appeal and interior aesthetics
- Both Replace countertops with a more durable material — Improves functionality and resale value
- Both Install a backsplash — Enhances kitchen aesthetics and resale value
Renovation cost estimate screening
| Repair item | Severity | Est. cost |
|---|---|---|
| Exposed wooden beams · Structural damage | Major | $15,000–50,000 |
| Concrete countertops · Aesthetic and durability issues | Major | $15,000–50,000 |
| Total estimated repair cost · 2 items | $30,000–100,000 |
Value-add ROI direction
- Resale Paint interior walls — Enhances curb appeal and interior aesthetics ↑
- Both Replace countertops with a more durable material — Improves functionality and resale value ↑
- Both Install a backsplash — Enhances kitchen aesthetics and resale value ↑
ⓘ Cost ranges are severity-bucket heuristics (US national rule-of-thumb). Get contractor quotes + a written scope before underwriting a rehab budget.
Schools (NCES district)
- District
- Harrison School District No. 2 In The County Of El Paso An
- NCES district ID
- 0804530
- Math proficiency
- 16% ▼ -13.00%
- Reading proficiency
- 35% ▼ -7.00%
- Median HH income
- $40,242
- Composite
- 21.47/100
- National rank
- #8333
- State rank
- #67 of 86 in CO
Livability — Colorado Springs
- Score
- 78/100
- State rank
- #23
- US rank
- #2639
Category grades
Schools grade is shown separately in the Schools card above.
Census & demographics
- Census place
- Colorado Springs, CO
- County
- El Paso County · 689,348 people
- City population
- 555,783
- Metro
- Colorado Springs, CO
- Population (ZIP)
- 41,104
- Household income
- $67,127
- Rent vs Own
- Severe rent burden
- 2041.0
Population outlook (El Paso County) Hauer SSP2
- Today (2025)
- 768,926 people
- By 2030
- 815,739 · +6.1%
- By 2040
- 903,489 · +17.5%
- By 2050
- 981,204 · +27.6%
- By 2075
- 1,155,542 · +50.3%
- By 2100
- 1,202,070 · +56.3%
Race, ethnicity, and origin ACS 2023
- Neighborhood character
- Diverse neighborhood (Simpson 0.70)
- Race & ethnicity
- Hispanic / Latino 38% White 37% Two or more races 18% Black 15% Asian 3% Native American 2%
- Hispanic origin (detail)
- Mexican 28% Puerto Rican 2%
- Common ancestry
- Lithuanian 1% Romanian 1% Slovak 1%
- Foreign-born
- 13% · Canada, South Korea
- Languages at home
- 73% English-only · Spanish 22% French/Haitian/Cajun 1% Tagalog/Filipino 1%
Political lean MEDSL · El Paso
- 2024 margin
- Lean R (+9.8) · D 43.8% · R 53.5% · Other 2.7%
- 2008→2024 swing
- +9.0pp toward D · 2008: -18.8pp · 2024: -9.8pp
- All cycles
- 2024: R+9.8 2020: R+10.8 2016: R+22.6 2012: R+21.4 2008: R+18.8
Not yet ingested
- Civics
- —
Market trends
- HPI YoY
- ▼ -114.77%
- Current HPI
- 301.5415
- Rent YoY
- ▲ 2.36%
- Metro
- Colorado Springs, CO
- State GDP YoY
- ▲ 1.95%
- F500 in state
- 14
Industry mix (Fortune 500 HQ in CO)
| Industry | F500 HQs | Revenue |
|---|---|---|
| Technology Distribution | 1 | $31B |
|
||
| Food / Agriculture | 1 | $18B |
|
||
| Packaging | 1 | $14B |
|
||
| Healthcare | 1 | $13B |
|
||
| Energy | 1 | $10B |
|
||
| Technology | 1 | $4B |
|
||
Price history
1 event — show timeline
- 2026-05-26 Listed $73,000 FSBO.com
Cash-flow waterfall
monthlySold comps — $/sqft
last 12 mo · ≤1 miLoading sold comps…