9605 Balm Riverview Rd · Riverview, FL
Flood risk 6/10 · Moderate
- FEMA flood zone
- X (unshaded)
- Chance of flooding over 30 yrs
- 0.7%
- Est. flood insurance / yr
- $507 – $1,088
Fire risk 2/10 · Minimal
- Est. fire insurance / yr
- $947 – $1,759
Heat risk 9/10 · Severe
- Hot days now (above 109°F)
- 6 days/yr
- Hot days in 30 yrs
- 20 days/yr
Wind risk 9/10 · Severe
- Chance of severe wind over 30 yrs
- 99.0%
Air-quality risk 4/10 · Minor
- Unhealthy air days now
- 4 days/yr
- Unhealthy air days in 30 yrs
- 5 days/yr
Risk factors via First Street. Map © Google.
Why this score? — see what drove the D grade
The composite is a weighted blend of 9 inputs, each scored 0–100. Each bar is that input's sub-score; the figure is the points it added to the 100-point composite (weight × sub-score).
- Cash flow +13.4/30.0
- ARV discount +7.5/15.0
- Schools +4.2/10.0
- DSCR +4.0/10.0
- Livability +4.0/5.0
- Rent growth +3.0/5.0
- 1% rule +2.6/10.0
- Condition / age +2.5/5.0
- Appreciation +0.0/10.0
$325,000
🖨 Deal sheet 📄 Offer letter ✓ Due diligence
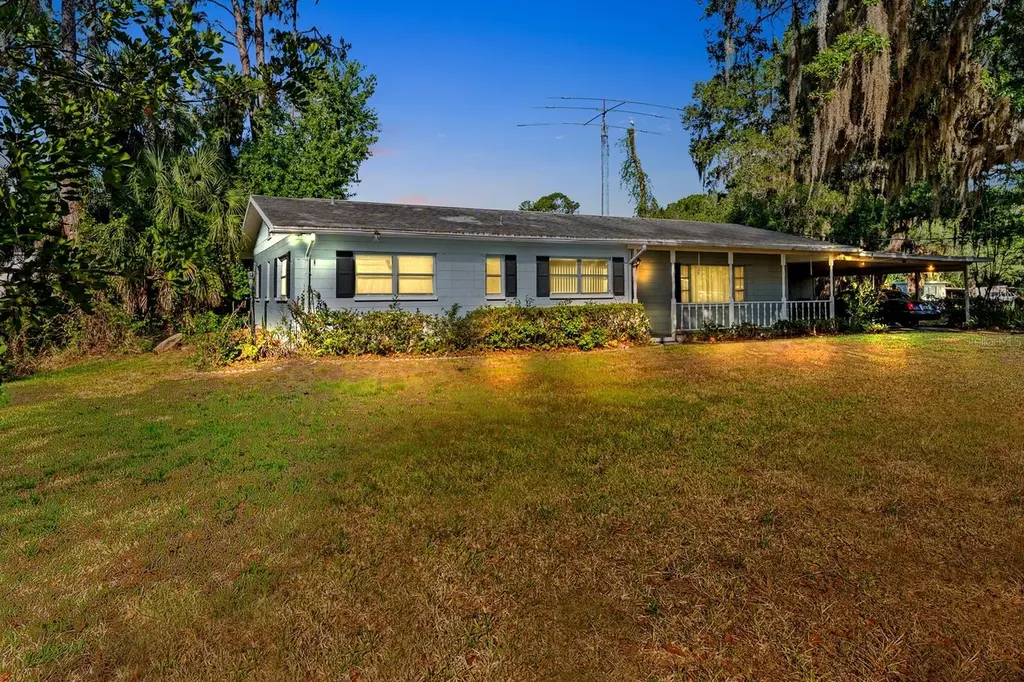
Listing remarks
Under contract-accepting backup offers. One or more photo(s) has been virtually staged. Bring your vision and make this classic Florida ranch your own. Situated on over half an acre, this 3-bedroom, 2-bath home with a dedicated office offers space, privacy, and endless potential. Built in 1958 and lovingly maintained by its original owner, this home is filled with character and ready for its next chapter. Major updates—including the roof, well pump, septic system, and plumbing—have already been taken care of, giving you peace of mind and the freedom to focus on personalizing the interior to your style. Step outside and enjoy the expansive backyard, perfect for entertaining, gard
Key facts
- Over half an acre
- Dedicated office
- Major updates
Tags
Property features AI
Finance
- Other: Homestead exempt; Zoning: RSC-4
- HOA & community: No association; Pets allowed
Exterior
- Parking: Carport with 2 spaces
- Utilities: Well water; Septic tank; Public utilities available
- Home design: Single Family Residence; One story; Northeast facing; Residential property
- Construction: Block construction; Shingle roof; Slab foundation; Built on 1/2 to less than 1 acre lot; Lot dimensions approximately 150 x 150
- Exterior features: Private mailbox; Storage; Asphalt road access
Interior
- Kitchen: Range; Refrigerator; Eat-in kitchen
- Bedrooms: 3 bedrooms
- Flooring: Carpet; Linoleum
- Bathrooms: 2 full bathrooms
- Heating & cooling: Central heating; Central air conditioning
- Interior features: Eat-in kitchen; Private mailbox; Storage
- Laundry & utility: Laundry room; Washer; Dryer
Neighborhood map
What this means for you Summary
Snapshot
- This is a 3-bed/2.0-bath single-family listed at $325k.
Deal economics
- At list price, monthly cash flow is $3 ($41/yr) — positive.
- The deal already cash-flows at list — no discount required.
- To meet the 1% rule (rent ≥ 1% of price), the offer needs to be $247k (24.1% below list).
- Recommended offer: $247k (24.1% below list) — sets the bar for 1% rule.
Location & tenants
- Location reads 79/100 on livability (#134 in FL, #2,000 nationally) — a middle-class / working-renter tenant base. Strengths: housing A+, health & safety A+, employment B+; Watch: amenities F.
- Hillsborough (suburban): math 47% / reading 50% proficiency, ranked #41 of 73 in FL (top 56%) — families likely to look elsewhere, expect single-tenant / working-renter base with shorter leases.
- Zoned schools: Riverview Elementary School (math 39% / reading 45%, grade F, #1,403 of 2,144 statewide, top 67%, 563 students, 66% FRL); Riverview High School (math 37% / reading 50%, grade F, #248 of 667 statewide, top 38%, 2,599 students, 46% FRL) — zoned schools at 56% FRL track the district average.
- Market conditions: Rents rising (+2.0%/yr); 228 active listings in the ZIP; 23 comparable units currently listed for rent nearby; rentals at typical pace (median 18d on market — plan ~3-4 weeks tenant-placement turnaround); solid renter incomes; 9,053 units permitted in Hillsborough County in 2024 (4,555 in 5+ unit buildings).
Forward outlook
- Local home prices are declining (-3.0%/yr); year-one equity from $2k of loan paydown is wiped out by about $10k of value loss. Plan a longer hold.
- Hillsborough County population projected at +37% by 2050 — long-run rental-demand tailwind backs the buy-and-hold thesis.
Negotiation context
- It's been on market 18 days — a 2% lower offer ($320k) is reasonable based on typical stale-listing flexibility.
- Current owner paid $250k; 30% above their basis — modest negotiation headroom, anchor on the comps not their cost.
Risks & watch-outs
- Watch-outs: built in 1958 — expect roof / HVAC / electrical / plumbing capex.
- Climate carrying-cost: major flood risk; severe wind risk, 99% chance of damaging wind over 30y; extreme-heat days projected 6→20/yr by 2055 (HVAC capex compounding) — expect insurance premiums to compound above CPI over the hold.
Questions for the listing agent
- Built in 1958 — when were the roof, HVAC, electrical panel, plumbing, and water heater last replaced?
- Is there a deadline driving the sale (1031 exchange, divorce, estate, relocation)? That informs how much negotiation room exists.
- Schools are B-rated — typically a magnet for longer-tenancy family renters. What's the average tenant stay here, and is there a school-zone premium baked into asking?
- The area grade is low — what's the realistic commute time and amenity access for the typical tenant pool here? Any planned neighborhood developments (good or bad) we should know about?
- What's the average days-on-market for RENTAL listings here right now (not sales)? A rising rental-DOM trend means longer vacancies and softer asking-rent achievability than the comps imply.
- What's the recent tenant-quality profile in this submarket — average credit score on applications, eviction rate, late-payment / NSF rate, and stable-employment percentage? A property-management company in the area should have these aggregated.
- How much new for-sale + rental construction is in the pipeline within 1–3 miles? Heavy new supply typically softens prices + rents 12–24 months out; constrained supply supports both.
Investment metrics
- 1% rule
- 0.76% ✗
- Cap rate
- 6.31%
- Cash-on-cash
- 0.05%
- DSCR
- 1.00
- GRM
- 11.0
CMA / ARV
No comps found within radius.
Projected returns pro-forma
-3.0% appreciation · 2.0% rent growth · sell at horizon
- IRR
- -17.3%
- Equity multiple
- 0.40×
- Total profit
- $-55,051
- Equity at exit
- $48,459
- IRR
- -11.1%
- Equity multiple
- 0.36×
- Total profit
- $-58,141
- Equity at exit
- $28,100
Cash invested: $91,000 (down + closing). Projections, not guarantees.
Landlord ↔ Tenant lean methodology
- Overall (STATE)
- 87 Strongly Landlord-Friendly
- State Florida
- 87 Strongly Landlord-Friendly · R+3
- County
- — inherits STATE
- City
- — inherits STATE
ZIP-level market 33569
- Home prices YoY
- -16.7%
- Rents YoY
- 2.0%
- Active inventory
- 228
- Price-to-rent
- 11.0×
Monthly cashflow live
- Estimated rent
- $2,468 high interval (Pro) →
- Mortgage (P&I)
- −$1,704
- Tax from tax record
- −$107 /mo · $1,282/yr
- Insurance
- −$135
- HOA
- −$0
- Vacancy / Maint / Mgmt
- −$518
- Net cashflow
- $3
Break-even live
UW: 25.0% down · 7.5% · 30yr · 1.5% tax · 5.0% vac · 8.0% maint · 8.0% mgmt
Financing live
Cash to close
- Down payment
- $81,250
- Closing costs
- $9,750
- Reserves months
- —
- Total cash needed
- —
Loan-product check · same deal, 3 products live
Conventional
25% down · 7.5% · 30yr
- Down + closing
- —
- Monthly P&I
- —
- Monthly cashflow
- —
- DSCR
- —
- Eligible?
- —
Personal DTI + credit; lowest rate.
DSCR
20% down · 8.5% · 30yr
- Down + closing
- —
- Monthly P&I
- —
- Monthly cashflow
- —
- DSCR
- —
- Eligible?
- —
No personal income docs; deal must DSCR.
Hard money
10% down · 12.0% · 12mo
- Down + closing
- —
- Monthly P&I
- —
- Monthly cashflow
- —
- DSCR
- —
- Eligible?
- —
Short-term bridge; refi at stabilization.
Rent comps 23 comps
| Address | Beds | Baths | Sqft | Rent | $/sqft | DOM | Units | Dist |
|---|---|---|---|---|---|---|---|---|
| 10965 Quickwater Ct Riverview, FL | 3.0 | 2.5 | 1679 | $2,480 | $1.48 | 24d | 1 | 0.13mi |
| 10621 Shady Falls Ct Riverview, FL | 3.0 | 2.5 | 1640 | $2,750 | $1.68 | 24d | 1 | 0.34mi |
| 11313 Andy Dr Riverview, FL | 3.0 | 2.0 | 1811 | $2,750 | $1.52 | 24d | 1 | 0.44mi |
| 10210 Falcon Gate Loop Riverview, FL | 1.0–2.0 | 1.0–2.0 | 902 | $2,090 | $2.32 | 1d | 41 | 0.64mi |
| 10114 Allenwood Dr Riverview, FL | 3.0 | 2.5 | 1383 | $2,190 | $1.58 | 14d | 1 | 0.64mi |
| 11316 Maybrook Ave Riverview, FL | 3.0 | 2.0 | 1454 | $2,395 | $1.65 | 23d | 1 | 0.68mi |
| 10243 Allenwood Dr Riverview, FL | 3.0 | 2.0 | 1454 | $2,195 | $1.51 | 5d | 1 | 0.79mi |
| 8240 Stoner Rd Riverview, FL | 3.0 | 2.0 | 1680 | $2,091 | $1.24 | 5d | 1 | 0.87mi |
| 10115 Newel Valley Loop Riverview, FL | 3.0 | 2.5 | 1716 | $2,275 | $1.33 | 17d | 1 | 1.07mi |
| 10611 Summer Azure Dr Riverview, FL | 4.0 | 2.5 | 1805 | $2,390 | $1.32 | 14d | 1 | 1.10mi |
| 10615 Sweet Sapling St Riverview, FL | 3.0 | 2.0 | 1461 | $2,224 | $1.52 | 24d | 1 | 1.11mi |
| 10621 Sweet Sapling St Riverview, FL | 3.0 | 2.0 | 1461 | $2,224 | $1.52 | 24d | 1 | 1.13mi |
| 10631 Sweet Sapling St Riverview, FL | 3.0 | 2.0 | 1461 | $2,224 | $1.52 | 24d | 1 | 1.16mi |
| 10410 Fairy Moss Ln Riverview, FL | 4.0 | 2.0 | 1817 | $2,299 | $1.27 | 17d | 1 | 1.25mi |
| 6913 Mathers Ln Riverview, FL | 3.0 | 1.0 | 1020 | $1,495 | $1.47 | 21d | 1 | 1.33mi |
| 6913 Mathers Ln Unit B Riverview, FL | 3.0 | 1.0 | 1020 | $1,445 | $1.42 | 10d | 1 | 1.33mi |
| 10854 Lake Saint Charles Blvd Riverview, FL | 3.0 | 2.5 | 1544 | $1,950 | $1.26 | 21d | 1 | 1.37mi |
| 10831 Johanna Ave Riverview, FL | 4.0 | 3.0 | 1708 | $2,200 | $1.29 | 14d | 1 | 1.39mi |
| 9711 Magnolia View Ct Riverview, FL | 1.0–3.0 | 1.0–2.0 | 1069 | $2,682 | $2.51 | 2d | 31 | 1.40mi |
| 10840 Johanna Ave Riverview, FL | 3.0 | 2.5 | 1477 | $1,950 | $1.32 | 24d | 1 | 1.42mi |
| 6904 Mathers Ln Unit A Riverview, FL | 2.0 | 1.5 | 975 | $1,665 | $1.71 | 12d | 1 | 1.42mi |
| 6831 Dartmouth Hill St Riverview, FL | 2.0 | 2.5 | 1254 | $1,845 | $1.47 | 24d | 1 | 1.46mi |
| 6923 Summer Harbor Ln Riverview, FL | 3.0 | 2.0 | 1314 | $1,960 | $1.49 | 5d | 1 | 1.46mi |
Listing history 2 events
-
2026-05-12status Pending 1130-char remark
-
2026-04-24$325,000 Active 1130-char remark
ⓘ Source: listings_history table (triggers on properties + properties_extension) + one-shot
backfill from property_details.listing_events for pre-trigger history.
Tax reassessment forecast FL · Resets to sale price
- Current annual tax
- $1,282 · $107/mo
- Projected year-2 tax
- $2,698 · $225/mo
- Expected delta
- +$1,416/yr (+$118/mo · 110.5%)
ⓘ Screening estimate from a state-policy table — verify with the county assessor before closing.
Climate risk First Street
- Flood 6/10 Major FEMA zone X (unshaded) · 70% chance over 30 yrs
- Wildfire 2/10 Low
- Heat 9/10 Extreme 6 d/yr ≥109°F today · 20 d/yr by 30 yrs out
- Wind 9/10 Extreme 99% chance of damaging wind over 30 yrs
- Air quality 4/10 Moderate 4 unhealthy d/yr today · 5 by 30 yrs out
Nearby sold comps map
Loading sold comps map…
Walkable amenities ~0.75 mi
Loading nearby amenities…
Taxation est. · year 1
- Rental income
- $29,620
- − Mortgage interest
- −$18,205
- − Property taxes
- −$1,282
- − Insurance
- −$1,625
- − Repairs & maintenance
- −$2,370
- − Management
- −$2,370
- − Depreciation
- −$9,455
- Taxable loss
- −$5,685
- Est. tax savings @ 24.0%
- +$1,364
- After-tax cash flow
- $1,406/yr
For passive investors: Depreciation is non-cash, so a rental often shows a tax loss while cash-flowing — sheltering income. Rental losses are passive: they offset passive income freely, and up to $25,000/yr can offset ordinary (W-2) income if you actively participate and your MAGI is under $100k (phasing out to $0 by $150k); unused losses carry forward. On sale, claimed depreciation is recaptured at up to 25%, and gains may owe capital-gains tax (a 1031 exchange can defer both). Figures are a year-1 estimate at your 24.0% rate — not tax advice; consult a CPA.
Schools (NCES district)
- District
- Hillsborough
- NCES district ID
- 1200870
- Math proficiency
- 47% ▼ -8.00%
- Reading proficiency
- 50% ▼ -4.00%
- Median HH income
- $50,622
- Composite
- 41.6/100
- National rank
- #3435
- State rank
- #41 of 73 in FL
Livability — Riverview
- Score
- 79/100
- State rank
- #134
- US rank
- #2000
Category grades
Schools grade is shown separately in the Schools card above.
Census & demographics
- Census place
- Riverview, FL
- County
- Hillsborough County · 1,540,968 people
- City population
- 137,988
- Metro
- Tampa-St. Petersburg-Clearwater, FL
- Population (ZIP)
- 27,867
- Household income
- $105,275
- Rent vs Own
- Severe rent burden
- 562.0
Population outlook (Hillsborough County) Hauer SSP2
- Today (2025)
- 1,607,022 people
- By 2030
- 1,733,968 · +7.9%
- By 2040
- 1,979,565 · +23.2%
- By 2050
- 2,203,427 · +37.1%
- By 2075
- 2,667,893 · +66.0%
- By 2100
- 2,891,558 · +79.9%
Race, ethnicity, and origin ACS 2023
- Neighborhood character
- Diverse neighborhood (Simpson 0.60)
- Race & ethnicity
- White 58% Hispanic / Latino 21% Black 12% Two or more races 11% Asian 5%
- Hispanic origin (detail)
- Mexican 3% Puerto Rican 5% Cuban 5% Dominican 3%
- Common ancestry
- Romanian 2% Iranian 1% Lithuanian 1%
- Foreign-born
- 15% · Canada, Jamaica
- Languages at home
- 78% English-only · Spanish 14% Other Indo-European 3% Other Asian/Pacific 1%
Political lean MEDSL · Hillsborough
- 2024 margin
- Toss-up / Even · D 47.8% · R 50.9% · Other 1.3%
- 2008→2024 swing
- -10.2pp toward R · 2008: 7.1pp · 2024: -3.1pp
- All cycles
- 2024: R+3.1 2020: D+6.9 2016: D+6.8 2012: D+6.7 2008: D+7.1
Not yet ingested
- Civics
- —
Market trends
- HPI YoY
- ▼ -59.47%
- Current HPI
- 296.9169
- Rent YoY
- ▲ 2.00%
- Metro
- Tampa-St. Petersburg-Clearwater, FL
- State GDP YoY
- ▲ 3.28%
- F500 in state
- 36
Industry mix (Fortune 500 HQ in FL)
| Industry | F500 HQs | Revenue |
|---|---|---|
| Industrial Technology | 2 | $29B |
|
||
| Insurance | 2 | $17B |
|
||
| Retail | 1 | $60B |
|
||
| Technology Distribution | 1 | $58B |
|
||
| Homebuilding | 1 | $35B |
|
||
| Technology Manufacturing | 1 | $35B |
|
||
Price history
-23.1% since first listed3 events — show timeline
- 2026-06-16 Sold (MLS) $250,000 Stellar MLS as Distributed by MLS Grid
- 2026-05-12 Pending — Stellar MLS as Distributed by MLS Grid
- 2026-04-24 Listed $325,000 Stellar MLS as Distributed by MLS Grid
Property tax history
+2.8%/yrLatest (2025): $1,282 · +10.9% YoY. Source: county tax records.
Cash-flow waterfall
monthlySold comps — $/sqft
last 12 mo · ≤1 miLoading sold comps…