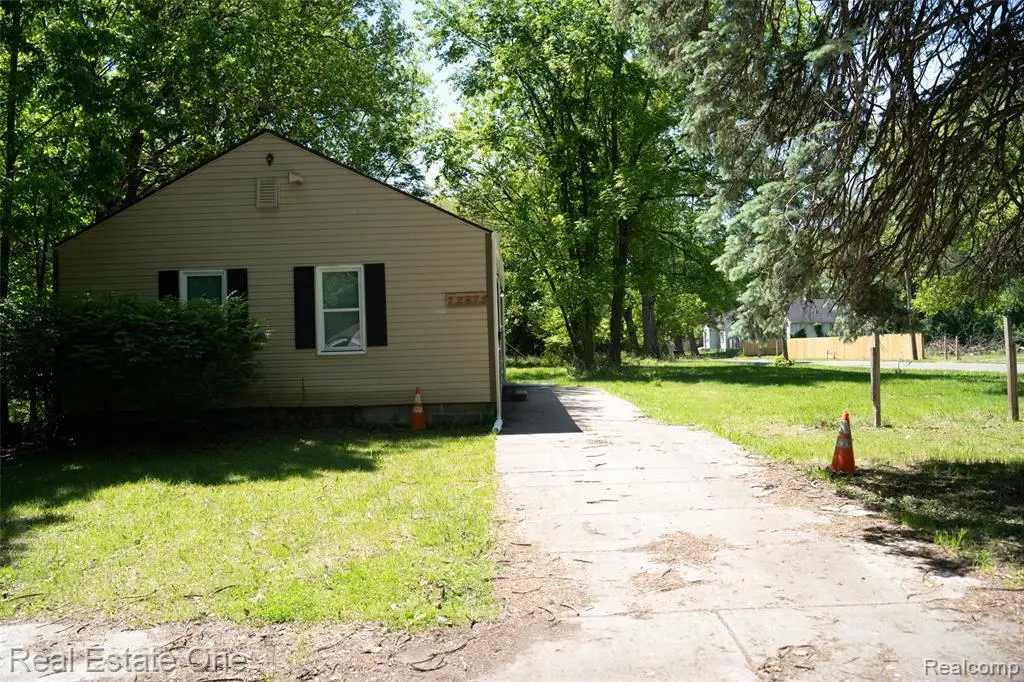
22675 Santa Maria St · Detroit, MI
Flood risk 1/10 · Minimal
- FEMA flood zone
- X (unshaded)
- Chance of flooding over 30 yrs
- 0.0%
- Est. flood insurance / yr
- $507 – $1,088
Fire risk 1/10 · Minimal
- Est. fire insurance / yr
- $784 – $1,456
Heat risk 2/10 · Minimal
- Hot days now (above 98°F)
- 7 days/yr
- Hot days in 30 yrs
- 15 days/yr
Wind risk 2/10 · Minimal
- Chance of severe wind over 30 yrs
- —
Air-quality risk 3/10 · Minor
- Unhealthy air days now
- 2 days/yr
- Unhealthy air days in 30 yrs
- 3 days/yr
Risk factors via First Street. Map © Google.
Why this score? — see what drove the C+ grade
The composite is a weighted blend of 9 inputs, each scored 0–100. Each bar is that input's sub-score; the figure is the points it added to the 100-point composite (weight × sub-score).
- Cash flow +30.0/30.0
- DSCR +10.0/10.0
- 1% rule +9.4/10.0
- Rent growth +4.5/5.0
- Livability +3.7/5.0
- Condition / age +2.5/5.0
- Schools +1.3/10.0
- ARV discount +0.0/15.0
- Appreciation +0.0/10.0
$75,000
🖨 Deal sheet 📄 Offer letter ✓ Due diligence
Listing remarks MLS
WOW! This fully renovated 2-bedroom ranch has been transformed from top to bottom and is guaranteed to impress! Featuring a stunning open-concept feel, this home showcases a brand-new kitchen with modern finishes, an updated bathroom, new flooring throughout, fresh paint, stylish lighting, and countless upgrades inside and out. Every inch of this home has been thoughtfully updated, offering the perfect blend of comfort, style, and low-maintenance living. Whether you're a first-time homebuyer, downsizing, or looking for a turnkey investment, this move-in-ready gem checks all the boxes. Just unpack your bags and start enjoying your new home from day one!
Key facts
- Open-concept
- Fully renovated
- Fresh paint
Tags
Property features AI
Exterior
- Parking: No garage
- Utilities: Public water; Public sewer
- Home design: Single-family residence; One level; Ground-level entry with steps
- Construction: Aluminum siding
- Exterior features: Paved road access; Lot approximately 0.13 acres (40 x 148)
Interior
- Bathrooms: 1 full bathroom
- Heating & cooling: Forced air heating; Natural gas heating; No central cooling
- Interior features: Crawl space basement; Total of 4 rooms
Neighborhood map
What this means for you Summary
Snapshot
- This is a 2-bed/1.0-bath single-family listed at $75k.
Deal economics
- At list price, monthly cash flow is $348 ($4k/yr) — positive.
- The deal already cash-flows at list — no discount required.
- Meets the 1% rule at list price ($1k rent vs $75k).
- Recommended offer: $74k (1.5% below list) — sets the bar for market timing.
Location & tenants
- Location reads 73/100 on livability (#218 in MI) — a middle-class / working-renter tenant base. Strengths: amenities A+, commute A+, cost of living A+; Watch: schools F, crime F, employment F.
- Detroit Public Schools Community District (urban): math 10% / reading 24% proficiency, ranked #499 of 540 in MI (top 92%) — low school quality limits family demand, transient renter base, plan for 1-2y turnover; 90% free/reduced lunch — lower-income household profile, screen leases tightly.
- Market conditions: Rents rising fast (+8.0%/yr); 305 active listings in the ZIP; 40 comparable units currently listed for rent nearby; rentals at typical pace (median 24d on market — plan ~3-4 weeks tenant-placement turnaround); 45% of comp listings sitting > 30 days — soft ceiling on asking rent; lower-income renter base — watch delinquency; 2,639 units permitted in Wayne County in 2024 (1,216 in 5+ unit buildings).
Forward outlook
- Local home prices are declining (-3.0%/yr); year-one equity from $519 of loan paydown is wiped out by about $2k of value loss. Plan a longer hold.
- Wayne County population projected at -17% by 2050 — secular population decline; favor cash flow + early exit over multi-decade hold.
- At projected returns (-3.0% appreciation + 8.0% rent growth), your $21k cash investment doubles in ~5 years — after that, you're playing with house money.
Negotiation context
- It's been on market 16 days — a 2% lower offer ($74k) is reasonable based on typical stale-listing flexibility.
- 4 sale attempts since 27y ago; this cycle's ask has dropped $5k (6%) from the opening price — seller is motivated, your offer sets the floor, not the list.
- Current owner paid $36k; list at $75k implies a 110% gain — meaningful room to come down on a strong offer.
Risks & watch-outs
- Watch-outs: built in 1948 — expect roof / HVAC / electrical / plumbing capex.
Questions for the listing agent
- Built in 1948 — when were the roof, HVAC, electrical panel, plumbing, and water heater last replaced?
- Is there a deadline driving the sale (1031 exchange, divorce, estate, relocation)? That informs how much negotiation room exists.
- Schools are F-rated, which usually means shorter tenancies and higher turnover. Who's the typical renter profile here, and what's been the actual vacancy rate?
- Crime grade is F in this area — have there been break-ins, vandalism, or insurance claims at this property in the last 3 years? What carrier currently insures it and at what premium?
- What's the average days-on-market for RENTAL listings here right now (not sales)? A rising rental-DOM trend means longer vacancies and softer asking-rent achievability than the comps imply.
- What's the recent tenant-quality profile in this submarket — average credit score on applications, eviction rate, late-payment / NSF rate, and stable-employment percentage? A property-management company in the area should have these aggregated.
- How much new for-sale + rental construction is in the pipeline within 1–3 miles? Heavy new supply typically softens prices + rents 12–24 months out; constrained supply supports both.
Investment metrics
- 1% rule
- 1.44% ✓
- Cap rate
- 11.87%
- Cash-on-cash
- 19.90%
- DSCR
- 1.89
- GRM
- 5.8
CMA / ARV
- ARV (on-the-fly)
- $59,024
- Comps found
- 12
Show comp detail 12 sales within ~0.75 mi
| Address | Dist | Beds/Ba | Sqft | Sold | Price | $/sf | Match |
|---|---|---|---|---|---|---|---|
| 17770 Redfern St | 0.28mi | 3/1.0 (+1) | 800 (-8%) | 6mo | $45,000 | $56 | 64 |
| 16555 Bramell St | 0.45mi | 3/1.0 (+1) | 918 (+6%) | 3mo | $60,000 | $65 | 62 |
| 16525 Lamphere St | 0.52mi | 3/1.0 (+1) | 884 (+2%) | 12mo | $85,714 | $97 | 58 |
| 16746 Bramell St | 0.34mi | 2/1.0 | 755 (-13%) | 7mo | $30,000 | $40 | 57 |
| 17727 Woodbine St | 0.71mi | 3/1.5 (+1) | 850 (-2%) | 0mo | $58,000 | $68 | 56 |
| 16715 Rockdale St | 0.53mi | 3/1.5 (+1) | 882 (+2%) | 13mo | $87,000 | $99 | 55 |
| 17679 Woodbine St | 0.70mi | 3/1.0 (+1) | 850 (-2%) | 6mo | $90,000 | $106 | 54 |
| 18293 Codding St | 0.52mi | 3/1.0 (+1) | 962 (+11%) | 1mo | $30,000 | $31 | 52 |
| 16804 Dolphin St | 0.45mi | 3/2.0 (+1) | 943 (+9%) | 10mo | $75,000 | $80 | 48 |
| 15880 W Parkway St | 0.69mi | 3/1.0 (+1) | 900 (+4%) | 12mo | $38,500 | $43 | 47 |
| 17670 Woodbine St | 0.67mi | 3/1.5 (+1) | 850 (-2%) | 14mo | $85,000 | $100 | 46 |
| 23450 Margareta St | 0.64mi | 3/1.0 (+1) | 957 (+10%) | 4mo | $45,000 | $47 | 45 |
Match score weights: distance 35% · size 25% · config 20% · recency 20%. Top-matched comps best support the ARV.
Projected returns pro-forma
-3.0% appreciation · 8.0% rent growth · sell at horizon
- IRR
- 17.5%
- Equity multiple
- 1.75×
- Total profit
- $15,739
- Equity at exit
- $11,183
- IRR
- 29.3%
- Equity multiple
- 4.25×
- Total profit
- $68,247
- Equity at exit
- $6,485
Cash invested: $21,000 (down + closing). Projections, not guarantees.
Landlord ↔ Tenant lean methodology
- Overall (STATE)
- 62 Landlord-Friendly
- State Michigan
- 62 Landlord-Friendly · EVEN
- County
- — inherits STATE
- City
- — inherits STATE
ZIP-level market 48219
- Home prices YoY
- -10.3%
- Rents YoY
- 8.0%
- Active inventory
- 305
- Price-to-rent
- 5.8×
Monthly cashflow live
- Estimated rent
- $1,079 high interval (Pro) →
- Mortgage (P&I)
- −$393
- Tax from tax record
- −$79 /mo · $951/yr
- Insurance
- −$31
- HOA
- −$0
- Vacancy / Maint / Mgmt
- −$227
- Net cashflow
- $348
Break-even live
UW: 25.0% down · 7.5% · 30yr · 1.5% tax · 5.0% vac · 8.0% maint · 8.0% mgmt
Financing live
Cash to close
- Down payment
- $18,750
- Closing costs
- $2,250
- Reserves months
- —
- Total cash needed
- —
Loan-product check · same deal, 3 products live
Conventional
25% down · 7.5% · 30yr
- Down + closing
- —
- Monthly P&I
- —
- Monthly cashflow
- —
- DSCR
- —
- Eligible?
- —
Personal DTI + credit; lowest rate.
DSCR
20% down · 8.5% · 30yr
- Down + closing
- —
- Monthly P&I
- —
- Monthly cashflow
- —
- DSCR
- —
- Eligible?
- —
No personal income docs; deal must DSCR.
Hard money
10% down · 12.0% · 12mo
- Down + closing
- —
- Monthly P&I
- —
- Monthly cashflow
- —
- DSCR
- —
- Eligible?
- —
Short-term bridge; refi at stabilization.
Rent comps 40 comps
| Address | Beds | Baths | Sqft | Rent | $/sqft | DOM | Units | Dist |
|---|---|---|---|---|---|---|---|---|
| 16885 Lahser Rd Unit 1A Detroit, MI | 1.0 | 1.0 | 650 | $750 | $1.15 | 4d | 1 | 0.47mi |
| 16885 Lahser Rd Apt 3A Detroit, MI | 1.0 | 1.0 | 700 | $750 | $1.07 | 43d | 1 | 0.47mi |
| 18045 Lahser Rd Detroit, MI | 1.0 | 1.0 | 670 | $960 | $1.43 | 4d | 2 | 0.47mi |
| 17644 Lahser Rd Unit 7 Detroit, MI | 1.0 | 1.0 | 600 | $995 | $1.66 | 24d | 1 | 0.48mi |
| 16854 Lahser Rd Detroit, MI | 1.0 | 1.0 | 680 | $885 | $1.30 | 12d | 1 | 0.51mi |
| 16700 Lahser Rd Apt 18 Detroit, MI | 2.0 | 1.0 | 750 | $900 | $1.20 | 43d | 1 | 0.60mi |
| 18350 Lahser Rd Detroit, MI | 1.0 | 1.0 | 600 | $950 | $1.58 | 43d | 1 | 0.61mi |
| 16800 Telegraph Rd Detroit, MI | 2.0 | 1.0 | 775 | $875 | $1.13 | 43d | 1 | 0.62mi |
| 18400 Lahser Rd Detroit, MI | 1.0 | 1.0 | 620 | $950 | $1.53 | 24d | 1 | 0.64mi |
| 21440 Bennett St Detroit, MI | 3.0 | 1.0 | 1037 | $1,394 | $1.34 | 16d | 1 | 0.65mi |
| 18450 Lahser Rd Apt 1 Detroit, MI | 1.0 | 1.0 | 650 | $820 | $1.26 | 4d | 1 | 0.66mi |
| 21451 Glenco St Detroit, MI | 3.0 | 1.0 | 1026 | $1,400 | $1.36 | 16d | 1 | 0.67mi |
| 17270 Bentler St Detroit, MI | 2.0 | 1.0 | 650 | $850 | $1.31 | 43d | 1 | 0.68mi |
| 17274 Bentler St #46 Detroit, MI | 2.0 | 1.0 | 700 | $850 | $1.21 | 16d | 1 | 0.68mi |
| 17274 Bentler St Detroit, MI | 2.0 | 1.0 | 700 | $838 | $1.20 | 24d | 2 | 0.70mi |
| 17274 Bentler St Detroit, MI | 2.0 | 1.0 | 700 | $850 | $1.21 | 43d | 2 | 0.70mi |
| 24235 W McNichols Rd Detroit, MI | 1.0 | 1.0 | 700 | $800 | $1.14 | 43d | 4 | 0.70mi |
| 18025 Bentler St Detroit, MI | 3.0 | 1.0 | 728 | $1,250 | $1.72 | 24d | 1 | 0.70mi |
| 24244 Dale St Unit 211 Detroit, MI | 1.0 | 1.0 | 550 | $800 | $1.45 | 24d | 1 | 0.70mi |
| 15847 Chatham St Detroit, MI | 3.0 | 1.0 | 909 | $1,325 | $1.46 | 4d | 1 | 0.74mi |
| 16800 Wormer St Detroit, MI | 3.0 | 1.0 | 912 | $1,250 | $1.37 | 17d | 1 | 0.76mi |
| 21434 Karl St Detroit, MI | 2.0 | 1.0 | 1000 | $1,350 | $1.35 | 43d | 1 | 0.76mi |
| 21455 Pickford St Detroit, MI | 2.0 | 1.0 | 1000 | $1,275 | $1.27 | 43d | 1 | 0.77mi |
| 16131 Dale St Detroit, MI | 3.0 | 1.0 | 1100 | $1,500 | $1.36 | 17d | 1 | 0.80mi |
| 18302 Wormer St Detroit, MI | 3.0 | 1.0 | 1046 | $1,475 | $1.41 | 43d | 1 | 0.82mi |
| 16581 Wormer St Detroit, MI | 2.0 | 1.0 | 720 | $1,100 | $1.53 | 43d | 1 | 0.83mi |
| 16207 Woodbine St Detroit, MI | 3.0 | 1.0 | 1000 | $1,294 | $1.29 | 4d | 1 | 0.85mi |
| 22570 Seven Mile W Detroit, MI | 2.0 | 1.0 | 890 | $875 | $0.98 | 43d | 1 | 0.85mi |
| 16717 Trinity St Detroit, MI | 3.0 | 1.5 | 1101 | $1,250 | $1.14 | 43d | 1 | 0.94mi |
| 17324 Salem St Detroit, MI | 2.0 | 1.0 | 989 | $1,200 | $1.21 | 24d | 1 | 0.97mi |
| 24651 W McNichols Rd Detroit, MI | 1.0 | 1.0 | 700 | $800 | $1.14 | 43d | 4 | 0.97mi |
| 18437 Trinity St Detroit, MI | 3.0 | 1.0 | 875 | $1,364 | $1.56 | 14d | 1 | 0.99mi |
| 24224 W 7 Mile Rd Detroit, MI | 1.0–2.0 | 1.0 | 600 | $875 | $1.46 | 43d | 3 | 1.06mi |
| 19255 Shiawassee Dr Apt 105 Detroit, MI | 1.0 | 1.0 | 680 | $950 | $1.40 | 4d | 1 | 1.06mi |
| 19301 Shiawassee Dr Detroit, MI | 1.0–2.0 | 1.0 | 740 | $1,150 | $1.55 | 43d | 2 | 1.10mi |
| 19250 Telegraph Rd Unit O7 Detroit, MI | 2.0 | 1.0 | 820 | $975 | $1.19 | 24d | 1 | 1.11mi |
| 19254 Telegraph Rd Unit M5 Detroit, MI | 1.0 | 1.0 | 700 | $820 | $1.17 | 14d | 1 | 1.11mi |
| 19248 Telegraph Rd Unit P7 Detroit, MI | 2.0 | 1.0 | 820 | $975 | $1.19 | 24d | 1 | 1.11mi |
| 19260 Telegraph Rd Unit J2 Detroit, MI | 1.0 | 1.0 | 700 | $820 | $1.17 | 43d | 1 | 1.11mi |
| 19276 Telegraph Rd Detroit, MI | 2.0 | 1.0 | 820 | $975 | $1.19 | 43d | 1 | 1.14mi |
Listing history 13 events
-
2026-06-18days on market $75,000 Active 16 DOM
-
2026-06-17pricedays on market $75,000 Active 15 DOM
-
2026-06-16days on market $80,000 Active 14 DOM
-
2026-06-15days on market $80,000 Active 13 DOM
-
2026-06-13days on market $80,000 Active 11 DOM
-
2026-06-13days on market $80,000 Active 10 DOM
-
2026-06-10remarks 699-char remark
-
2026-06-09days on market $80,000 Active 7 DOM
-
2026-06-08days on market $80,000 Active 6 DOM
-
2026-06-07days on market $80,000 Active 5 DOM
-
2026-06-04days on market $80,000 Active 2 DOM
-
2026-06-02remarks 660-char remark
Show marketing remark (660 chars)
WOW! This fully renovated 2-bedroom ranch has been transformed from top to bottom and is guaranteed to impress! Featuring a stunning open-concept feel, this home showcases a brand-new kitchen with modern finishes, an updated bathroom, new flooring throughout, fresh paint, stylish lighting, and countless upgrades inside and out. Every inch of this home has been thoughtfully updated, offering the perfect blend of comfort, style, and low-maintenance living. Whether you're a first-time homebuyer, downsizing, or looking for a turnkey investment, this move-in-ready gem checks all the boxes. Just unpack your bags and start enjoying your new home from day one!
-
2026-06-02$80,000 Active 1 DOM
Show marketing remark (660 chars)
WOW! This fully renovated 2-bedroom ranch has been transformed from top to bottom and is guaranteed to impress! Featuring a stunning open-concept feel, this home showcases a brand-new kitchen with modern finishes, an updated bathroom, new flooring throughout, fresh paint, stylish lighting, and countless upgrades inside and out. Every inch of this home has been thoughtfully updated, offering the perfect blend of comfort, style, and low-maintenance living. Whether you're a first-time homebuyer, downsizing, or looking for a turnkey investment, this move-in-ready gem checks all the boxes. Just unpack your bags and start enjoying your new home from day one!
ⓘ Source: listings_history table (triggers on properties + properties_extension) + one-shot
backfill from property_details.listing_events for pre-trigger history.
Tax reassessment forecast MI · Partial reset (capped growth)
- Current annual tax
- $951 · $79/mo
- Projected year-2 tax
- $1,053 · $88/mo
- Expected delta
- +$102/yr (+$8/mo · 10.7%)
ⓘ Screening estimate from a state-policy table — verify with the county assessor before closing.
Climate risk First Street
- Flood 1/10 Low FEMA zone X (unshaded) · 0% chance over 30 yrs
- Wildfire 1/10 Low
- Heat 2/10 Low 7 d/yr ≥98°F today · 15 d/yr by 30 yrs out
- Wind 2/10 Low
- Air quality 3/10 Moderate 2 unhealthy d/yr today · 3 by 30 yrs out
Nearby sold comps map
Loading sold comps map…
Walkable amenities ~0.75 mi
Loading nearby amenities…
Taxation est. · year 1
- Rental income
- $12,944
- − Mortgage interest
- −$4,201
- − Property taxes
- −$951
- − Insurance
- −$375
- − Repairs & maintenance
- −$1,036
- − Management
- −$1,036
- − Depreciation
- −$2,182
- Taxable income
- $3,164
- Est. tax owed @ 24.0%
- −$759
- After-tax cash flow
- $3,421/yr
For passive investors: Depreciation is non-cash, so a rental often shows a tax loss while cash-flowing — sheltering income. Rental losses are passive: they offset passive income freely, and up to $25,000/yr can offset ordinary (W-2) income if you actively participate and your MAGI is under $100k (phasing out to $0 by $150k); unused losses carry forward. On sale, claimed depreciation is recaptured at up to 25%, and gains may owe capital-gains tax (a 1031 exchange can defer both). Figures are a year-1 estimate at your 24.0% rate — not tax advice; consult a CPA.
Schools (NCES district)
- District
- Detroit Public Schools Community District
- NCES district ID
- 2601103
- Math proficiency
- 10% ▼ -2.00%
- Reading proficiency
- 24% ▲ 6.00%
- Median HH income
- $25,815
- Composite
- 13.06/100
- National rank
- #9564
- State rank
- #499 of 540 in MI
Livability — Detroit
- Score
- 73/100
- State rank
- #218
- US rank
- #5427
Category grades
Schools grade is shown separately in the Schools card above.
Census & demographics
- Census place
- Detroit, MI
- County
- Wayne County · 1,562,939 people
- City population
- 572,865
- Metro
- Detroit-Warren-Dearborn, MI
- Population (ZIP)
- 47,208
- Household income
- $43,655
- Rent vs Own
- Severe rent burden
- 3584.0
Population outlook (Wayne County) Hauer SSP2
- Today (2025)
- 1,675,273 people
- By 2030
- 1,620,300 · -3.3%
- By 2040
- 1,502,341 · -10.3%
- By 2050
- 1,384,039 · -17.4%
- By 2075
- 1,124,592 · -32.9%
- By 2100
- 881,193 · -47.4%
Race, ethnicity, and origin ACS 2023
- Neighborhood character
- Predominantly Black (88%)
- Race & ethnicity
- Black 88% White 5% Two or more races 4% Hispanic / Latino 1%
- Common ancestry
- Romanian 1% Lithuanian 1%
- Foreign-born
- 2% · Canada
- Languages at home
- 96% English-only · Spanish 1% French/Haitian/Cajun 1%
Political lean MEDSL · Wayne
- 2024 margin
- Strong D (+29.0) · D 62.7% · R 33.7% · Other 3.6%
- 2008→2024 swing
- -20.5pp toward R · 2008: 49.5pp · 2024: 29.0pp
- All cycles
- 2024: D+29.0 2020: D+38.1 2016: D+37.3 2012: D+46.9 2008: D+49.5
Not yet ingested
- Civics
- —
Market trends
- HPI YoY
- ▼ -65.06%
- Current HPI
- 563.3263
- Rent YoY
- ▲ 8.04%
- Metro
- Detroit-Warren-Dearborn, MI
- State GDP YoY
- ▲ 1.37%
- F500 in state
- 28
Industry mix (Fortune 500 HQ in MI)
| Industry | F500 HQs | Revenue |
|---|---|---|
| Automotive Parts | 3 | $48B |
|
||
| Automotive | 2 | $372B |
|
||
| Chemicals | 1 | $45B |
|
||
| Automotive Retail | 1 | $29B |
|
||
| Healthcare / Medical Devices | 1 | $23B |
|
||
| Automotive Technology | 1 | $20B |
|
||
Price history
+60.3% since first listed7 events — show timeline
- 2026-06-02 Listed $80,000 REALCOMP
- 2026-06-02 Listed $80,000 MiRealSource-MiMLS
- 1999-11-05 Sold (Public Records) $35,700 Public Records
- 1999-07-30 Sold (MLS) $35,000 REALCOMP
- 1999-05-08 Listing Removed — REALCOMP
- 1999-05-07 Listed $45,900 REALCOMP
- 1999-04-07 Listed $49,900 REALCOMP
Property tax history
+10.6%/yrLatest (2025): $951 · -53.7% YoY. Source: county tax records.
Cash-flow waterfall
monthlySold comps — $/sqft
last 12 mo · ≤1 miLoading sold comps…