10035 Mills Station Rd #100 · Rancho Cordova, CA
Flood risk 1/10 · Minimal
- FEMA flood zone
- X (unshaded)
- Chance of flooding over 30 yrs
- 0.0%
- Est. flood insurance / yr
- $507 – $1,088
Fire risk 4/10 · Minor
- Est. fire insurance / yr
- $659 – $1,223
Heat risk 7/10 · Major
- Hot days now (above 102°F)
- 6 days/yr
- Hot days in 30 yrs
- 13 days/yr
Wind risk 1/10 · Minimal
- Chance of severe wind over 30 yrs
- —
Air-quality risk 10/10 · Severe
- Unhealthy air days now
- 33 days/yr
- Unhealthy air days in 30 yrs
- 35 days/yr
Risk factors via First Street. Map © Google.
Why this score? — see what drove the B+ grade
The composite is a weighted blend of 9 inputs, each scored 0–100. Each bar is that input's sub-score; the figure is the points it added to the 100-point composite (weight × sub-score).
- Cash flow +30.0/30.0
- ARV discount +14.4/15.0
- 1% rule +10.0/10.0
- DSCR +10.0/10.0
- Condition / age +4.0/5.0
- Schools +3.5/10.0
- Livability +3.4/5.0
- Rent growth +3.1/5.0
- Appreciation +0.0/10.0
$54,800
🖨 Deal sheet (PDF) 📄 Offer letter ✓ Due diligence
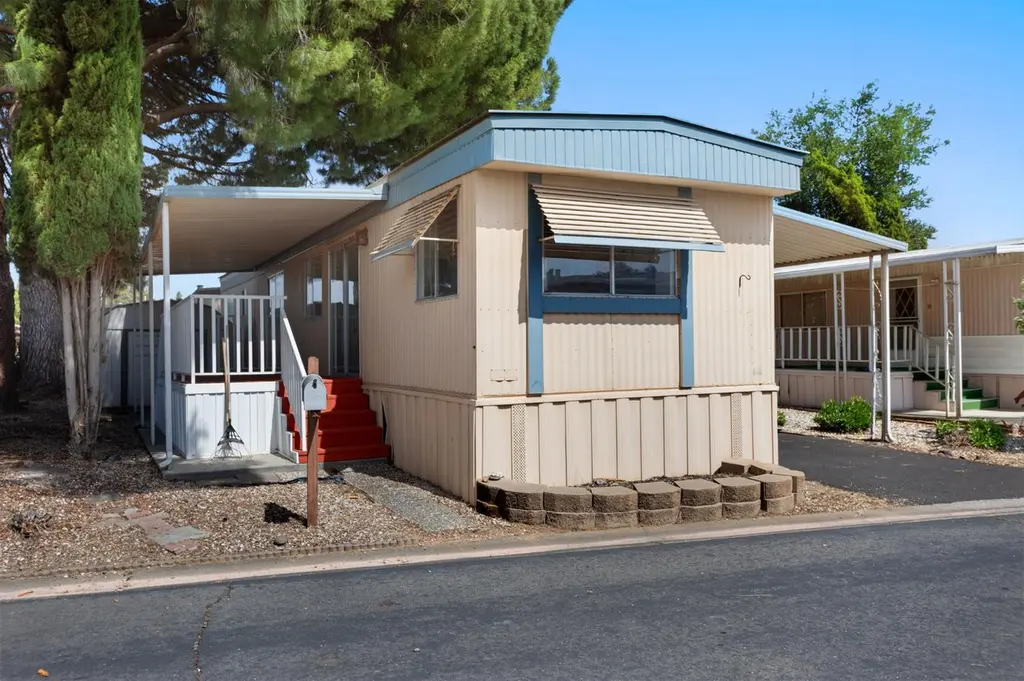
Listing remarks
Welcome to Cordovan Estates! This affordable 2 bedroom 1 bathroom home has been lovingly cared for. Fresh paint with updated flooring and bathroom makes this ready to be your next home. The well cared for Cordovan Mobile Estate grounds has a clubhouse, pool and spa along with other amenities. Great access to highway 50 and 20 minutes to Downtown Sacramento. All ages welcome.
Key facts
- Clubhouse
- Spa
- Access to highway 50
Tags
Property features AI
Finance
- Other: Located in Sacramento County, CA 95827; Address: 10035 Mills Station Rd #100
- Financial info: Land lease: No (listed land lease amount available)
- HOA & community: No homeowners association; Not a senior community
Exterior
- Parking: Covered parking
- Utilities: Natural gas connected; Electric service: Other; Public sewer; Water from water district
- Home design: Manufactured in-park home; Single wide; Built in 1975; Manufacturer: Skyline; Model/Make: Buddy
- Construction: Metal skirting
- Exterior features: Other roof; No notable lot features
Interior
- Kitchen: Free standing gas range; Microwave
- Bedrooms: 2 bedrooms
- Flooring: Carpet; Laminate
- Bathrooms: 1 full bathroom with shower stall(s)
- Heating & cooling: Gas heating; Evaporative cooler; Other heating/cooling
- Interior features: Great room living area; Breakfast area
- Laundry & utility: Inside laundry area
Neighborhood map
What this means for you Summary
Snapshot
- This is a 2-bed/1.0-bath manufactured listed at $55k. Condition is rated good.
Deal economics
- At list price, monthly cash flow is $889 ($11k/yr) — positive.
- The deal already cash-flows at list — no discount required.
- Meets the 1% rule at list price ($2k rent vs $55k).
- Recommended offer: $53k (3.0% below list) — sets the bar for market timing.
- Cap rate 25.8% vs local median 3.0% in Rancho Cordova — top-decile yield for the area; either an underpriced asset or a hidden risk that comps aren't pricing in. Stress-test before assuming the spread holds.
Location & tenants
- Location reads 68/100 on livability (#268 in CA) — a middle-class / working-renter tenant base. Strengths: housing A+, employment B; Watch: schools C-, commute C-, crime D.
- Sacramento City Unified (urban): math 32% / reading 43% proficiency, ranked #804 of 1,400 in CA (top 57%) — families likely to look elsewhere, expect single-tenant / working-renter base with shorter leases; 63% free/reduced lunch — lower-income household profile, screen leases tightly.
- Market conditions: Rents rising (+2.4%/yr); 112 active listings in the ZIP; 20 comparable units currently listed for rent nearby; rentals at typical pace (median 16d on market — plan ~3-4 weeks tenant-placement turnaround); solid renter incomes; 6,825 units permitted in Sacramento County in 2024 (1,752 in 5+ unit buildings).
Forward outlook
- Local home prices are declining (-3.0%/yr); year-one equity from $379 of loan paydown is wiped out by about $2k of value loss. Plan a longer hold.
- Sacramento County population projected at +17% by 2050 — long-run rental-demand tailwind backs the buy-and-hold thesis.
- At projected returns (-3.0% appreciation + 2.4% rent growth), your $15k cash investment doubles in ~2 years — after that, you're playing with house money.
Negotiation context
- It's been on market 34 days — a 3% lower offer ($53k) is reasonable based on typical stale-listing flexibility.
Risks & watch-outs
- Climate carrying-cost: extreme-heat days projected 6→13/yr by 2055 (HVAC capex compounding) — expect insurance premiums to compound above CPI over the hold.
Questions for the listing agent
- It's been on market 34 days. Have you received any prior offers? Is the seller open to a 3% concession, seller financing, or rate buy-down credit?
- Built in 1975 — when were the roof, HVAC, electrical panel, plumbing, and water heater last replaced?
- Is there a deadline driving the sale (1031 exchange, divorce, estate, relocation)? That informs how much negotiation room exists.
- Crime grade is D in this area — have there been break-ins, vandalism, or insurance claims at this property in the last 3 years? What carrier currently insures it and at what premium?
- What's the average days-on-market for RENTAL listings here right now (not sales)? A rising rental-DOM trend means longer vacancies and softer asking-rent achievability than the comps imply.
- What's the recent tenant-quality profile in this submarket — average credit score on applications, eviction rate, late-payment / NSF rate, and stable-employment percentage? A property-management company in the area should have these aggregated.
- How much new for-sale + rental construction is in the pipeline within 1–3 miles? Heavy new supply typically softens prices + rents 12–24 months out; constrained supply supports both.
Investment metrics
- 1% rule
- 2.93% ✓
- Cap rate
- 25.75%
- Cash-on-cash
- 69.50%
- DSCR
- 4.09
- GRM
- 2.8
CMA / ARV
- ARV (on-the-fly)
- $64,800
- Comps found
- 10
Show comp detail 10 sales within ~0.75 mi
| Address | Dist | Beds/Ba | Sqft | Sold | Price | $/sf | Match |
|---|---|---|---|---|---|---|---|
| 10035 Mills Station Rd #71 | 0.00mi | 2/1.0 | 720 (0%) | 4mo | $34,500 | $48 | 97 |
| 10035 Mills Station Rd #60 | 0.11mi | 2/1.0 | 720 (0%) | 7mo | $78,000 | $108 | 89 |
| 10035 Mills Station Rd #39 | 0.11mi | 2/1.0 | 720 (0%) | 9mo | $60,000 | $83 | 88 |
| 10035 Mills Station Rd #122 | 0.02mi | 2/1.0 | 720 (0%) | 15mo | $46,500 | $65 | 87 |
| 10035 Mills Station Rd #157 | 0.11mi | 2/1.0 | 720 (0%) | 10mo | $65,000 | $90 | 86 |
| 2904 Poole Dr | 0.29mi | 2/1.0 | 697 (-3%) | 3mo | $55,000 | $79 | 78 |
| 10035 Mills Station Rd #11 | 0.11mi | 2/1.0 | 684 (-5%) | 10mo | $92,500 | $135 | 78 |
| 2926 Poole Dr #25 | 0.28mi | 2/2.0 | 756 (+5%) | 5mo | $64,000 | $85 | 71 |
| 2902 Routier Rd #7 | 0.26mi | 2/1.5 | 784 (+9%) | 7mo | $90,000 | $115 | 65 |
| 2901 Twilley Dr #40 | 0.30mi | 2/1.5 | 672 (-7%) | 9mo | $79,500 | $118 | 65 |
Match score weights: distance 35% · size 25% · config 20% · recency 20%. Top-matched comps best support the ARV.
Projected returns pro-forma
-3.0% appreciation · 2.41% rent growth · sell at horizon
- IRR
- 68.3%
- Equity multiple
- 4.05×
- Total profit
- $46,794
- Equity at exit
- $8,171
- IRR
- 72.3%
- Equity multiple
- 8.16×
- Total profit
- $109,883
- Equity at exit
- $4,738
Cash invested: $15,344 (down + closing). Projections, not guarantees.
Landlord ↔ Tenant lean methodology
- Overall (STATE)
- 18 Strongly Tenant-Friendly
- State California
- 18 Strongly Tenant-Friendly · D+13
- County
- — inherits STATE
- City
- — inherits STATE
ZIP-level market 95827
- Rents YoY
- 2.4%
- Active inventory
- 112
- Price-to-rent
- 2.8×
Monthly cashflow live
- Estimated rent
- $1,604 high interval (Pro) →
- Mortgage (P&I)
- −$287
- Tax est. 1.5%
- −$68 /mo · $822/yr
- Insurance
- −$23
- HOA
- −$0
- Vacancy / Maint / Mgmt
- −$337
- Net cashflow
- $889
Break-even live
Sensitivity live
| Price | -10% $926 | -5% $908 | +0% $889 | +5% $870 | +10% $851 |
|---|---|---|---|---|---|
| Rent | -10% $762 | -5% $825 | +0% $889 | +5% $952 | +10% $1,015 |
| Rate | -1.0pp $916 | -0.5pp $903 | base $889 | +0.5pp $874 | +1.0pp $860 |
UW: 25.0% down · 7.5% · 30yr · 1.5% tax · 5.0% vac · 8.0% maint · 8.0% mgmt
Financing live
Cash to close
- Down payment
- $13,700
- Closing costs
- $1,644
- Reserves months
- —
- Total cash needed
- —
Loan-product check · same deal, 3 products live
Conventional
25% down · 7.5% · 30yr
- Down + closing
- —
- Monthly P&I
- —
- Monthly cashflow
- —
- DSCR
- —
- Eligible?
- —
Personal DTI + credit; lowest rate.
DSCR
20% down · 8.5% · 30yr
- Down + closing
- —
- Monthly P&I
- —
- Monthly cashflow
- —
- DSCR
- —
- Eligible?
- —
No personal income docs; deal must DSCR.
Hard money
10% down · 12.0% · 12mo
- Down + closing
- —
- Monthly P&I
- —
- Monthly cashflow
- —
- DSCR
- —
- Eligible?
- —
Short-term bridge; refi at stabilization.
Rent comps 20 comps
| Address | Beds | Baths | Sqft | Rent | $/sqft | DOM | Units | Dist |
|---|---|---|---|---|---|---|---|---|
| 2929 Routier Rd Sacramento, CA | 1.0–2.0 | 1.0–2.0 | 790 | $1,995 | $2.53 | 3d | 15 | 0.21mi |
| 2729 El Parque Cir Unit 3 Rancho Cordova, CA | 1.0 | 1.0 | 600 | $1,350 | $2.25 | 24d | 1 | 0.41mi |
| 2080 W La Loma Dr Rancho Cordova, CA | 1.0–2.0 | 1.0 | 650 | $1,645 | $2.53 | 18d | 3 | 0.44mi |
| 2080 W La Loma Dr Rancho Cordova, CA | 1.0 | 1.0 | 587 | $1,395 | $2.37 | 44d | 2 | 0.44mi |
| 2590 Capitales Dr Rancho Cordova, CA | 1.0 | 1.0 | 559 | $1,495 | $2.67 | 16d | 1 | 0.56mi |
| 2590 Capitales Dr Rancho Cordova, CA | 1.0 | 1.0 | 559 | $1,495 | $2.67 | 13d | 1 | 0.56mi |
| 2590 Capitales Dr Rancho Cordova, CA | 1.0 | 1.0 | 559 | $1,495 | $2.67 | 21d | 2 | 0.56mi |
| 10108 Malaga Way Rancho Cordova, CA | 2.0 | 1.0 | 765 | $1,776 | $2.32 | 8d | 1 | 0.59mi |
| 10401 Rockingham Dr Rancho Cordova, CA | 1.0–2.0 | 1.0 | 714 | $1,450 | $2.03 | 8d | 6 | 0.61mi |
| 10335 White Rock Rd Rancho Cordova, CA | 1.0–2.0 | 1.0 | 625 | $1,450 | $2.32 | 11d | 2 | 0.72mi |
| 10421 El Mercado Dr Rancho Cordova, CA | 1.0–2.0 | 1.0 | 702 | $1,651 | $2.35 | 2d | 1 | 0.74mi |
| 10460 El Mercado Dr Rancho Cordova, CA | 1.0 | 1.0 | 626 | $1,295 | $2.07 | 2d | 1 | 0.85mi |
| 3545 Mather Field Rd Rancho Cordova, CA | 2.0 | 1.0 | 604 | $1,775 | $2.94 | 2d | 5 | 0.90mi |
| 3060 Laurelhurst Dr Rancho Cordova, CA | 1.0 | 1.0 | 650 | $1,395 | $2.15 | 44d | 1 | 0.91mi |
| 2416 Moraine Cir Rancho Cordova, CA | 1.0 | 1.0 | 710 | $1,188 | $1.67 | 17d | 2 | 1.18mi |
| 10515 Mills Tower Dr Rancho Cordova, CA | 1.0–2.0 | 1.0 | 665 | $1,495 | $2.25 | 11d | 1 | 1.26mi |
| 2830 Mills Park Dr Rancho Cordova, CA | 1.0–2.0 | 1.0 | 712 | $1,525 | $2.14 | 24d | 5 | 1.36mi |
| 9838 Lincoln Village Dr Sacramento, CA | 1.0–2.0 | 1.0–2.0 | 732 | $1,601 | $2.19 | 4d | 8 | 1.40mi |
| 10501 Croetto Way Rancho Cordova, CA | 1.0 | 1.0 | 650 | $1,250 | $1.92 | 44d | 1 | 1.41mi |
| 9830 Lincoln Village Dr Sacramento, CA | 1.0 | 1.0 | 500 | $1,298 | $2.60 | 15d | 1 | 1.44mi |
Listing history 15 events
-
2026-06-21days on market $54,800 Active 34 DOM
-
2026-06-18days on market $54,800 Active 31 DOM
-
2026-06-17days on market $54,800 Active 30 DOM
-
2026-06-16days on market $54,800 Active 29 DOM
-
2026-06-15days on market $54,800 Active 28 DOM
-
2026-06-13days on market $54,800 Active 26 DOM
-
2026-06-13days on market $54,800 Active 25 DOM
-
2026-06-09days on market $54,800 Active 22 DOM
-
2026-06-08days on market $54,800 Active 21 DOM
-
2026-06-07days on market $54,800 Active 20 DOM
-
2026-06-05days on market $54,800 Active 17 DOM
-
2026-06-03days on market $54,800 Active 16 DOM
-
2026-06-02days on market $54,800 Active 15 DOM
-
2026-06-01days on market $54,800 Active 14 DOM
-
2026-05-31days on market $54,800 Active 13 DOM
ⓘ Source: listings_history table (triggers on properties + properties_extension) + one-shot
backfill from property_details.listing_events for pre-trigger history.
Climate risk First Street
- Flood 1/10 Low FEMA zone X (unshaded) · 0% chance over 30 yrs
- Wildfire 4/10 Moderate
- Heat 7/10 Severe 6 d/yr ≥102°F today · 13 d/yr by 30 yrs out
- Wind 1/10 Low
- Air quality 10/10 Extreme 33 unhealthy d/yr today · 35 by 30 yrs out
Nearby sold comps map
Loading sold comps map…
Walkable amenities ~0.75 mi
Loading nearby amenities…
Taxation est. · year 1
- Rental income
- $19,251
- − Mortgage interest
- −$3,070
- − Property taxes
- −$822
- − Insurance
- −$274
- − Repairs & maintenance
- −$1,540
- − Management
- −$1,540
- − Depreciation
- −$1,594
- Taxable income
- $10,411
- Est. tax owed @ 24.0%
- −$2,499
- After-tax cash flow
- $8,165/yr
For passive investors: Depreciation is non-cash, so a rental often shows a tax loss while cash-flowing — sheltering income. Rental losses are passive: they offset passive income freely, and up to $25,000/yr can offset ordinary (W-2) income if you actively participate and your MAGI is under $100k (phasing out to $0 by $150k); unused losses carry forward. On sale, claimed depreciation is recaptured at up to 25%, and gains may owe capital-gains tax (a 1031 exchange can defer both). Figures are a year-1 estimate at your 24.0% rate — not tax advice; consult a CPA.
Condition & rehab AI · 20 photos
This well-maintained mobile home is ready for immediate move-in with minor cosmetic updates to enhance its curb appeal and add value.
Value-add opportunities
- Both landscaping — enhances curb appeal and adds value
- Both exterior paint — improves curb appeal and adds value
- Both awning replacement — enhances curb appeal and adds value
Renovation cost estimate screening
Value-add ROI direction
- Both landscaping — enhances curb appeal and adds value ↑
- Both exterior paint — improves curb appeal and adds value ↑
- Both awning replacement — enhances curb appeal and adds value ↑
ⓘ Cost ranges are severity-bucket heuristics (US national rule-of-thumb). Get contractor quotes + a written scope before underwriting a rehab budget.
Schools (NCES district)
- District
- Sacramento City Unified
- NCES district ID
- 0633840
- Math proficiency
- 32% ▬ 0.00%
- Reading proficiency
- 43% ▲ 3.00%
- Median HH income
- $49,280
- Composite
- 34.86/100
- National rank
- #10000
- State rank
- #804 of 1400 in CA
Livability — Rancho Cordova
- Score
- 68/100
- State rank
- #268
- US rank
- #9126
Category grades
Schools grade is shown separately in the Schools card above.
Census & demographics
- Census place
- Rancho Cordova, CA
- County
- Sacramento County · 1,539,646 people
- City population
- 98,329
- Metro
- Sacramento-Roseville-Folsom, CA
- Population (ZIP)
- 21,742
- Household income
- $85,841
- Rent vs Own
- Severe rent burden
- 949.0
Population outlook (Sacramento County) Hauer SSP2
- Today (2025)
- 1,660,763 people
- By 2030
- 1,732,990 · +4.3%
- By 2040
- 1,855,755 · +11.7%
- By 2050
- 1,941,335 · +16.9%
- By 2075
- 2,046,162 · +23.2%
- By 2100
- 1,961,444 · +18.1%
Race, ethnicity, and origin ACS 2023
- Neighborhood character
- Diverse neighborhood (Simpson 0.69)
- Race & ethnicity
- White 47% Hispanic / Latino 24% Black 13% Two or more races 12% Asian 10% Native American 1%
- Hispanic origin (detail)
- Mexican 19%
- Common ancestry
- Subsaharan African 5% Italian 2% Scotch-Irish 2%
- Foreign-born
- 22% · Canada, Vietnam, South Korea
- Languages at home
- 67% English-only · Spanish 14% Russian/Polish/Slavic 10% Other Indo-European 3%
Political lean MEDSL · Sacramento
- 2024 margin
- D (+19.7) · D 58.1% · R 38.4% · Other 3.5%
- 2008→2024 swing
- +0.7pp no change · 2008: 19.0pp · 2024: 19.7pp
- All cycles
- 2024: D+19.7 2020: D+25.3 2016: D+23.7 2012: D+16.3 2008: D+19.0
Not yet ingested
- Civics
- —
Market trends
- HPI YoY
- ▼ -223.22%
- Current HPI
- 349.4168
- Rent YoY
- ▲ 2.41%
- Metro
- Sacramento-Roseville-Folsom, CA
- State GDP YoY
- ▲ 3.21%
- F500 in state
- 116
Industry mix (Fortune 500 HQ in CA)
| Industry | F500 HQs | Revenue |
|---|---|---|
| Technology | 27 | $1,492B |
|
||
| Financial Services | 3 | $174B |
|
||
| Retail | 3 | $44B |
|
||
| Insurance | 3 | $26B |
|
||
| Media / Entertainment | 2 | $115B |
|
||
| Pharmaceuticals / Biotech | 2 | $62B |
|
||
Cash-flow waterfall
monthlySold comps — $/sqft
last 12 mo · ≤1 miLoading sold comps…