 9-Plex
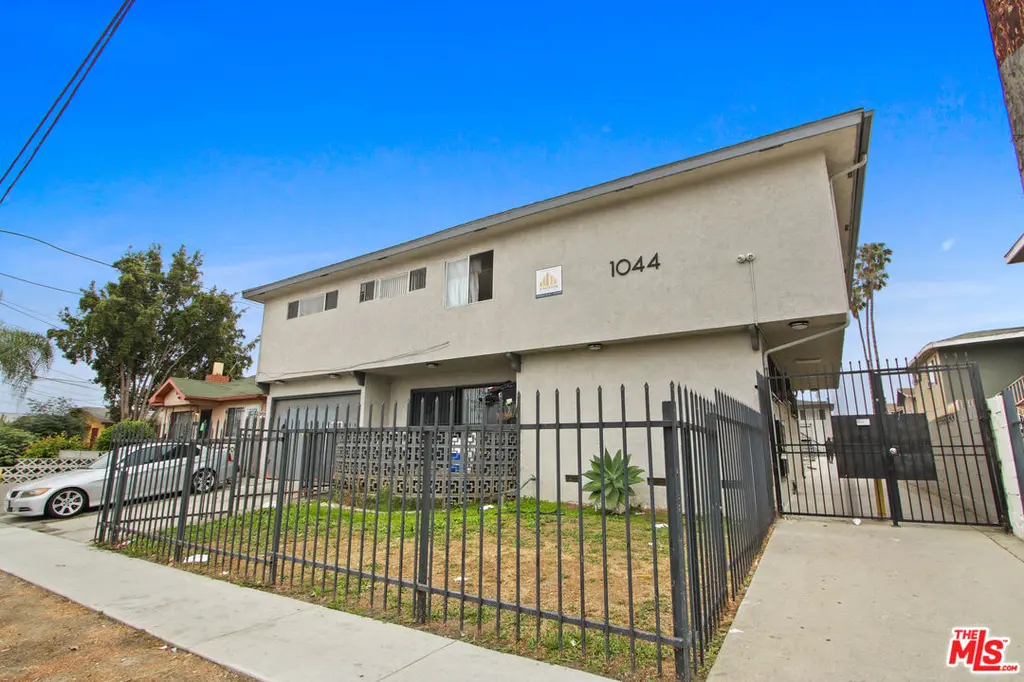
1044 W 110th St · Westmont, CA
Flood risk 1/10 · Minimal
- FEMA flood zone
- X (unshaded)
- Chance of flooding over 30 yrs
- 0.0%
- Est. flood insurance / yr
- $507 – $1,088
Fire risk 1/10 · Minimal
- Est. fire insurance / yr
- $659 – $1,223
Heat risk 5/10 · Moderate
- Hot days now (above 87°F)
- 7 days/yr
- Hot days in 30 yrs
- 20 days/yr
Wind risk 1/10 · Minimal
- Chance of severe wind over 30 yrs
- —
Air-quality risk 5/10 · Moderate
- Unhealthy air days now
- 7 days/yr
- Unhealthy air days in 30 yrs
- 7 days/yr
Risk factors via First Street. Map © Google.
Why this score? — see what drove the C- grade
The composite is a weighted blend of 9 inputs, each scored 0–100. Each bar is that input's sub-score; the figure is the points it added to the 100-point composite (weight × sub-score).
- Cash flow +15.4/30.0
- ARV discount +15.0/15.0
- DSCR +4.7/10.0
- 1% rule +4.2/10.0
- Schools +3.6/10.0
- Livability +3.0/5.0
- Condition / age +2.5/5.0
- Rent growth +1.9/5.0
- Appreciation +0.0/10.0
$2,845,000
🖨 Deal sheet (PDF) 📄 Offer letter ✓ Due diligence
Multi-family units
County records classify this as Multi-Family (5+ Unit). Listing-text estimate: 9 units. confirmed
5+ unit building — per-unit beds/baths from public records are typically unavailable; the breakdown below (if shown) is an estimate from the listing text.
Listing remarks MLS
We are pleased to offer this sixteen unit investment opportunity, located in the County of Los Angeles. The unit mix consists of six 1+1, nine 2+1 and one 2+1.5 units. The investment consists of approximately 13,320 of rentable square feet and is situated on an approximately 18,010 square foot parcel. Recent property upgrades include new exterior paint, new exterior lighting, new exterior building and unit numbers, and eleven of the units have recently been renovated. The building amenities include a large parking area with fourteen total spaces, and the property is separately metered for both gas & electricity. The oversized lot offers an investor the opportunity to add eight additional ADUs (per county planner; buyer to verify), further enhancing the property's value.
Key facts
- Renovated units
- New exterior paint
- Large parking area
Tags
Neighborhood map
What this means for you Summary
Snapshot
- This is a 9 × 3-bed/?-bath units multifamily listed at $2.85M.
Deal economics
- At list price, monthly cash flow is $1k ($13k/yr) — positive. Per door: $121/mo.
- The deal already cash-flows at list — no discount required.
- To meet the 1% rule (rent ≥ 1% of price), the offer needs to be $2.63M (7.5% below list).
- Recommended offer: $2.59M (9.0% below list) — sets the bar for market timing.
- Cap rate 6.8% vs local median 3.6% in Westmont — top-decile yield for the area; either an underpriced asset or a hidden risk that comps aren't pricing in. Stress-test before assuming the spread holds.
Location & tenants
- Location reads 59/100 on livability (#625 in CA) — a working-class tenant base; expect higher turnover. Strengths: commute A+, housing B; Watch: crime F, amenities F, employment D-.
- Los Angeles Unified (urban): math 29% / reading 54% proficiency, ranked #223 of 517 in CA (top 43%) — families likely to look elsewhere, expect single-tenant / working-renter base with shorter leases; 67% free/reduced lunch — lower-income household profile, screen leases tightly.
- Zoned schools: Woodcrest Elementary (595 students, 99% FRL); Valley Academy of Arts And Sciences (math 22% / reading 52%, grade F, #578 of 1,170 statewide, top 51%, 868 students, 64% FRL).
- Market conditions: Rents soft (-2.5%/yr); 168 active listings in the ZIP; 19,697 units permitted in Los Angeles County in 2024 (9,426 in 5+ unit buildings).
- At $26,304/mo this rent would consume 592% of the median local household income ($53k/yr) (locally 7490% of renters already pay >50% of income on rent) — very limited rent-growth headroom before tenants either downsize or default.
Forward outlook
- Local home prices are declining (-3.0%/yr); year-one equity from $20k of loan paydown is wiped out by about $85k of value loss. Plan a longer hold.
- Los Angeles County population projected at +9% by 2050 — modest demand growth; plan on rents tracking national, not racing it.
Negotiation context
- It's been on market 111 days — a 9% lower offer ($2.59M) is reasonable based on typical stale-listing flexibility.
- 7 sale attempts since 7y ago with the ask held roughly flat each time — persistent listings suggest the price (not the market) is what's stuck; bring a comps-based counter.
Risks & watch-outs
- Climate carrying-cost: extreme-heat days projected 7→20/yr by 2055 (HVAC capex compounding) — expect insurance premiums to compound above CPI over the hold.
Questions for the listing agent
- It's been on market 111 days. Have you received any prior offers? Is the seller open to a 9% concession, seller financing, or rate buy-down credit?
- Can we see the unit-by-unit rent roll, current vacancy, and any below-market leases? What's the average tenancy length?
- What capital expenditures (roof, boiler, parking lot, exteriors) have been made in the last 5 years, and what's planned in the next 2?
- Built in 1960 — when were the roof, HVAC, electrical panel, plumbing, and water heater last replaced?
- Why hasn't it sold? Are there any deal-killer items the seller is aware of (foundation, flood, title, zoning, code violations)?
- Is there a deadline driving the sale (1031 exchange, divorce, estate, relocation)? That informs how much negotiation room exists.
- Schools are A-rated — typically a magnet for longer-tenancy family renters. What's the average tenant stay here, and is there a school-zone premium baked into asking?
- Crime grade is F in this area — have there been break-ins, vandalism, or insurance claims at this property in the last 3 years? What carrier currently insures it and at what premium?
- What's the average days-on-market for RENTAL listings here right now (not sales)? A rising rental-DOM trend means longer vacancies and softer asking-rent achievability than the comps imply.
- What's the recent tenant-quality profile in this submarket — average credit score on applications, eviction rate, late-payment / NSF rate, and stable-employment percentage? A property-management company in the area should have these aggregated.
- How much new apartment / multifamily construction is in the pipeline within 1–3 miles? Heavy new supply (>2% of stock underway) typically softens rents 12–24 months out; light construction supports rent growth.
Investment metrics
- 1% rule
- 0.92% ✗
- Cap rate
- 6.75%
- Cash-on-cash
- 1.64%
- DSCR
- 1.07
- GRM
- 9.0
CMA / ARV
- ARV (median comp)
- $3,583,182
- List price
- $2,845,000
- Delta
- -20.60%
- Verdict
- UNDERPRICED
- Comps
- 2 within 1.0 mi
Projected returns pro-forma
-3.0% appreciation · 0.0% rent growth · sell at horizon
- IRR
- -17.1%
- Equity multiple
- 0.41×
- Total profit
- $-468,393
- Equity at exit
- $424,199
- IRR
- -15.9%
- Equity multiple
- 0.23×
- Total profit
- $-614,867
- Equity at exit
- $245,984
Cash invested: $796,600 (down + closing). Projections, not guarantees.
Landlord ↔ Tenant lean methodology
- Overall (STATE)
- 18 Strongly Tenant-Friendly
- State California
- 18 Strongly Tenant-Friendly · D+13
- County
- — inherits STATE
- City
- — inherits STATE
ZIP-level market 90044
- Rents YoY
- -2.5%
- Active inventory
- 168
- Price-to-rent
- 81.1×
Monthly cashflow live
- Estimated rent
- $26,304 high interval (Pro) →
- Mortgage (P&I)
- −$14,919
- Tax from tax record
- −$3,587 /mo · $43,048/yr
- Insurance
- −$1,185
- HOA
- −$0
- Vacancy / Maint / Mgmt
- −$5,524
- Net cashflow
- $1,088
Break-even live
Sensitivity live
| Price | -10% $2,698 | -5% $1,893 | +0% $1,088 | +5% $283 | +10% $-523 |
|---|---|---|---|---|---|
| Rent | -10% $-990 | -5% $49 | +0% $1,088 | +5% $2,127 | +10% $3,166 |
| Rate | -1.0pp $2,521 | -0.5pp $1,812 | base $1,088 | +0.5pp $351 | +1.0pp $-399 |
9-unit breakdown (identical units grouped — click to expand)
| Units | Beds | Baths | Est. rent |
|---|---|---|---|
| 9× units | 3 | — | $26,307 |
| #1 | 3 | — | $2,923 |
| #2 | 3 | — | $2,923 |
| #3 | 3 | — | $2,923 |
| #4 | 3 | — | $2,923 |
| #5 | 3 | — | $2,923 |
| #6 | 3 | — | $2,923 |
| #7 | 3 | — | $2,923 |
| #8 | 3 | — | $2,923 |
| #9 | 3 | — | $2,923 |
| Total (9 units) | $26,304 | ||
UW: 25.0% down · 7.5% · 30yr · 1.5% tax · 5.0% vac · 8.0% maint · 8.0% mgmt
Financing live
Cash to close
- Down payment
- $711,250
- Closing costs
- $85,350
- Reserves months
- —
- Total cash needed
- —
Loan-product check · same deal, 3 products live
Conventional
25% down · 7.5% · 30yr
- Down + closing
- —
- Monthly P&I
- —
- Monthly cashflow
- —
- DSCR
- —
- Eligible?
- —
Personal DTI + credit; lowest rate.
DSCR
20% down · 8.5% · 30yr
- Down + closing
- —
- Monthly P&I
- —
- Monthly cashflow
- —
- DSCR
- —
- Eligible?
- —
No personal income docs; deal must DSCR.
Hard money
10% down · 12.0% · 12mo
- Down + closing
- —
- Monthly P&I
- —
- Monthly cashflow
- —
- DSCR
- —
- Eligible?
- —
Short-term bridge; refi at stabilization.
Listing history 27 events
-
2026-06-21days on market $2,845,000 Active 111 DOM
-
2026-06-18days on market $2,845,000 Active 108 DOM
-
2026-06-17days on market $2,845,000 Active 107 DOM
-
2026-06-16days on market $2,845,000 Active 106 DOM
-
2026-06-15days on market $2,845,000 Active 105 DOM
-
2026-06-13days on market $2,845,000 Active 103 DOM
-
2026-06-09days on market $2,845,000 Active 99 DOM
-
2026-06-08days on market $2,845,000 Active 98 DOM
-
2026-06-07days on market $2,845,000 Active 97 DOM
-
2026-06-04days on market $2,845,000 Active 94 DOM
-
2026-06-03days on market $2,845,000 Active 93 DOM
-
2026-06-02days on market $2,845,000 Active 92 DOM
-
2026-06-01days on market $2,845,000 Active 91 DOM
-
2026-05-31days on market $2,845,000 Active 90 DOM
-
2026-03-02$2,845,000 Active 786-char remark
Show marketing remark (786 chars)
We are pleased to offer this sixteen unit investment opportunity, located in the County of Los Angeles. The unit mix consists of six 1+1, nine 2+1 and one 2+1.5 units. The investment consists of approximately 13,320 of rentable square feet and is situated on an approximately 18,010 square foot parcel. Recent property upgrades include new exterior paint, new exterior lighting, new exterior building and unit numbers, and eleven of the units have recently been renovated. The building amenities include a large parking area with fourteen total spaces, and the property is separately metered for both gas & electricity. The oversized lot offers an investor the opportunity to add eight additional ADUs (per county planner; buyer to verify), further enhancing the property's value.
-
2025-09-30Active
-
2025-06-18Active
-
2024-03-24historical $1,750
-
2024-02-06Active
-
2024-02-02$1,750
-
2023-10-25Active
-
2019-12-12soldstatus $2,510,000 Sold
-
2019-12-12soldstatus $2,510,000
-
2019-09-24status Pending
-
2019-09-18historical Backup Offers Accepted
-
2019-09-03$2,600,000 Active
-
1990-11-06soldstatus $300,000
ⓘ Source: listings_history table (triggers on properties + properties_extension) + one-shot
backfill from property_details.listing_events for pre-trigger history.
Tax reassessment forecast CA · Resets to sale price
- Current annual tax
- $43,048 · $3,587/mo
- Projected year-2 tax
- $43,048 · $3,587/mo
- Expected delta
- $0/yr ($0/mo · 0.0%)
ⓘ Screening estimate from a state-policy table — verify with the county assessor before closing.
Climate risk First Street
- Flood 1/10 Low FEMA zone X (unshaded) · 0% chance over 30 yrs
- Wildfire 1/10 Low
- Heat 5/10 Major 7 d/yr ≥87°F today · 20 d/yr by 30 yrs out
- Wind 1/10 Low
- Air quality 5/10 Major 7 unhealthy d/yr today · 7 by 30 yrs out
Nearby sold comps map
Loading sold comps map…
Walkable amenities ~0.75 mi
Loading nearby amenities…
Taxation est. · year 1
- Rental income
- $315,648
- − Mortgage interest
- −$159,364
- − Property taxes
- −$43,048
- − Insurance
- −$14,225
- − Repairs & maintenance
- −$25,252
- − Management
- −$25,252
- − Depreciation
- −$82,764
- Taxable loss
- −$34,257
- Est. tax savings @ 24.0%
- +$8,222
- After-tax cash flow
- $21,276/yr
For passive investors: Depreciation is non-cash, so a rental often shows a tax loss while cash-flowing — sheltering income. Rental losses are passive: they offset passive income freely, and up to $25,000/yr can offset ordinary (W-2) income if you actively participate and your MAGI is under $100k (phasing out to $0 by $150k); unused losses carry forward. On sale, claimed depreciation is recaptured at up to 25%, and gains may owe capital-gains tax (a 1031 exchange can defer both). Figures are a year-1 estimate at your 24.0% rate — not tax advice; consult a CPA.
Schools (NCES district)
- District
- Los Angeles Unified
- NCES district ID
- 0622710
- Math proficiency
- 29% ▼ -4.00%
- Reading proficiency
- 54% ▲ 10.00%
- Median HH income
- $50,403
- Composite
- 35.67/100
- National rank
- #4875
- State rank
- #223 of 517 in CA
Livability — Westmont
- Score
- 59/100
- State rank
- #625
- US rank
- #19861
Category grades
Schools grade is shown separately in the Schools card above.
Census & demographics
- Census place
- Westmont, CA
- County
- Los Angeles County · 9,444,647 people
- City population
- 95,859
- Metro
- Los Angeles-Long Beach-Anaheim, CA
- Population (ZIP)
- 94,830
- Household income
- $53,302
- Rent vs Own
- Severe rent burden
- 7490.0
Population outlook (Los Angeles County) Hauer SSP2
- Today (2025)
- 10,940,515 people
- By 2030
- 11,256,481 · +2.9%
- By 2040
- 11,729,929 · +7.2%
- By 2050
- 11,948,407 · +9.2%
- By 2075
- 11,818,114 · +8.0%
- By 2100
- 10,842,928 · -0.9%
Race, ethnicity, and origin ACS 2023
- Neighborhood character
- Predominantly Hispanic (67%)
- Race & ethnicity
- Hispanic / Latino 67% Black 29% Two or more races 23% White 1% Native American 1%
- Hispanic origin (detail)
- Mexican 39%
- Foreign-born
- 34% · Canada
- Languages at home
- 37% English-only · Spanish 62%
Political lean MEDSL · Los Angeles
- 2024 margin
- Solid D (+32.9) · D 64.8% · R 31.9% · Other 3.3%
- 2008→2024 swing
- -7.4pp toward R · 2008: 40.4pp · 2024: 32.9pp
- All cycles
- 2024: D+32.9 2020: D+44.2 2016: D+48.0 2012: D+40.0 2008: D+40.4
Not yet ingested
- Civics
- —
Market trends
- HPI YoY
- ▼ -691.99%
- Current HPI
- 467.9845
- Rent YoY
- ▼ -2.50%
- Metro
- Los Angeles-Long Beach-Anaheim, CA
- State GDP YoY
- ▲ 3.21%
- F500 in state
- 116
Industry mix (Fortune 500 HQ in CA)
| Industry | F500 HQs | Revenue |
|---|---|---|
| Technology | 27 | $1,492B |
|
||
| Financial Services | 3 | $174B |
|
||
| Retail | 3 | $44B |
|
||
| Insurance | 3 | $26B |
|
||
| Media / Entertainment | 2 | $115B |
|
||
| Pharmaceuticals / Biotech | 2 | $62B |
|
||
Price history
+848.3% since first listed13 events — show timeline
- 2026-03-02 Listed $2,845,000 TheMLS
- 2025-09-30 Listed — TheMLS
- 2025-06-18 Listed — TheMLS
- 2024-03-24 Rental Removed $1,750 APPFOLIO
- 2024-02-06 Listed — TheMLS
- 2024-02-02 Listed for Rent $1,750 APPFOLIO
- 2023-10-25 Listed — TheMLS
- 2019-12-12 Sold (Public Records) $2,510,000 Public Records
- 2019-12-12 Sold (MLS) $2,510,000 TheMLS
- 2019-09-24 Pending — TheMLS
- 2019-09-18 Contingent — TheMLS
- 2019-09-03 Listed $2,600,000 TheMLS
- 1990-11-06 Sold (Public Records) $300,000 Public Records
Property tax history
+6.5%/yrLatest (2025): $43,048 · +5.9% YoY. Source: county tax records.
Cash-flow waterfall
monthlySold comps — $/sqft
last 12 mo · ≤1 miLoading sold comps…