3436 Camanche Pkwy · Camanche North Shore, CA
Flood risk 1/10 · Minimal
- FEMA flood zone
- X (unshaded)
- Chance of flooding over 30 yrs
- 0.0%
- Est. flood insurance / yr
- $507 – $1,088
Fire risk 8/10 · Major
- Est. fire insurance / yr
- $659 – $1,223
Heat risk 8/10 · Major
- Hot days now (above 104°F)
- 7 days/yr
- Hot days in 30 yrs
- 15 days/yr
Wind risk 1/10 · Minimal
- Chance of severe wind over 30 yrs
- —
Air-quality risk 10/10 · Severe
- Unhealthy air days now
- 25 days/yr
- Unhealthy air days in 30 yrs
- 28 days/yr
Risk factors via First Street. Map © Google.
Why this score? — see what drove the C grade
The composite is a weighted blend of 9 inputs, each scored 0–100. Each bar is that input's sub-score; the figure is the points it added to the 100-point composite (weight × sub-score).
- Cash flow +20.8/30.0
- ARV discount +15.0/15.0
- DSCR +6.6/10.0
- 1% rule +5.0/10.0
- Schools +2.7/10.0
- Livability +2.6/5.0
- Rent growth +2.5/5.0
- Condition / age +2.5/5.0
- Appreciation +0.0/10.0
$216,000
🖨 Deal sheet 📄 Offer letter ✓ Due diligence
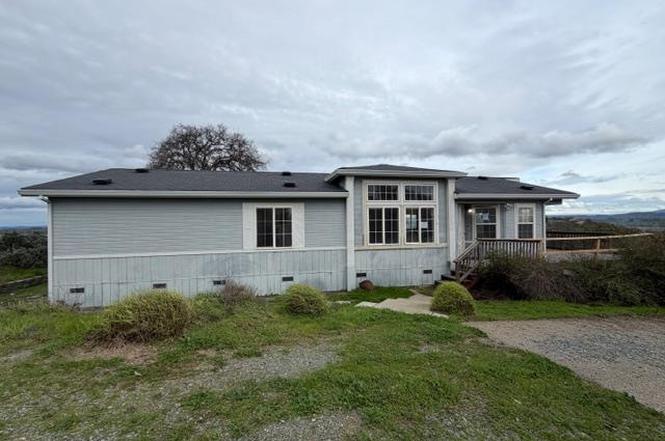
Listing remarks
Welcome to this charming 3-bedroom, 2-bath home nestled in the desirable Lake Camanche area! This inviting property offers a spacious and comfortable layout featuring a separate living room and dining roomperfect for everyday living or entertaining guests. Large windows bring in plenty of natural light, creating a warm and welcoming atmosphere throughout. The kitchen with island provides ample storage and functionality, while the nicely sized bedrooms offer comfort and versatility for family, guests, or a home office. Outside, you'll appreciate the detached garage, ideal for parking, RV storage, or workshop space. Enjoy peaceful surroundings, nearby lake access, and the relaxed lifestyle th
Key facts
- 0.27 acre lot
- 2 garage spots
- Built 2001
Neighborhood map
What this means for you Summary
Snapshot
- This is a 3-bed/2.0-bath single-family listed at $216k.
Deal economics
- At list price, monthly cash flow is $297 ($4k/yr) — positive.
- The deal already cash-flows at list — no discount required.
- Meets the 1% rule at list price ($2k rent vs $216k).
- Recommended offer: $203k (6.0% below list) — sets the bar for market timing.
Location & tenants
- Location reads 51/100 on livability (#1,095 in CA) — a working-class tenant base; expect higher turnover. Strengths: housing A-, crime B+; Watch: schools F, amenities F, commute F.
- Amador County Unified (town): math 23% / reading 37% proficiency, ranked #330 of 517 in CA (top 64%) — families likely to look elsewhere, expect single-tenant / working-renter base with shorter leases.
- Market conditions: 119 active listings in the ZIP; 66 units permitted in Amador County in 2024 (0 in 5+ unit buildings).
Forward outlook
- Local home prices are declining (-3.0%/yr); year-one equity from $1k of loan paydown is wiped out by about $6k of value loss. Plan a longer hold.
- Amador County population projected at -15% by 2050 — secular population decline; favor cash flow + early exit over multi-decade hold.
Negotiation context
- It's been on market 86 days — a 6% lower offer ($203k) is reasonable based on typical stale-listing flexibility.
- Current owner paid $22k; list at $216k implies a 882% gain — meaningful room to come down on a strong offer.
Risks & watch-outs
- Climate carrying-cost: severe wildfire risk; extreme-heat days projected 7→15/yr by 2055 (HVAC capex compounding) — expect insurance premiums to compound above CPI over the hold.
Questions for the listing agent
- It's been on market 86 days. Have you received any prior offers? Is the seller open to a 6% concession, seller financing, or rate buy-down credit?
- What does the HOA fee cover, when was the last increase, and are there any pending special assessments or reserve-fund shortfalls?
- Why hasn't it sold? Are there any deal-killer items the seller is aware of (foundation, flood, title, zoning, code violations)?
- Is there a deadline driving the sale (1031 exchange, divorce, estate, relocation)? That informs how much negotiation room exists.
- Schools are F-rated, which usually means shorter tenancies and higher turnover. Who's the typical renter profile here, and what's been the actual vacancy rate?
- What's the average days-on-market for RENTAL listings here right now (not sales)? A rising rental-DOM trend means longer vacancies and softer asking-rent achievability than the comps imply.
- What's the recent tenant-quality profile in this submarket — average credit score on applications, eviction rate, late-payment / NSF rate, and stable-employment percentage? A property-management company in the area should have these aggregated.
- How much new for-sale + rental construction is in the pipeline within 1–3 miles? Heavy new supply typically softens prices + rents 12–24 months out; constrained supply supports both.
Investment metrics
- 1% rule
- 1.00% ✓
- Cap rate
- 7.94%
- Cash-on-cash
- 5.90%
- DSCR
- 1.26
- GRM
- 8.3
CMA / ARV
- ARV (on-the-fly)
- $406,500
- Comps found
- 3
Show comp detail 3 sales within ~0.75 mi
| Address | Dist | Beds/Ba | Sqft | Sold | Price | $/sf | Match |
|---|---|---|---|---|---|---|---|
| 3655 Lakeview Dr | 0.21mi | 4/2.0 (+1) | 1,532 (+2%) | 14mo | $415,000 | $271 | 70 |
| 3735 Lakeview Dr | 0.29mi | 3/2.0 | 1,330 (-11%) | 1mo | $375,000 | $282 | 67 |
| 4165 Lakeview Dr | 0.73mi | 4/3.0 (+1) | 1,630 (+9%) | 15mo | $440,000 | $270 | 30 |
Match score weights: distance 35% · size 25% · config 20% · recency 20%. Top-matched comps best support the ARV.
Projected returns pro-forma
-3.0% appreciation · 3.0% rent growth · sell at horizon
- IRR
- -7.2%
- Equity multiple
- 0.73×
- Total profit
- $-16,090
- Equity at exit
- $32,206
- IRR
- 2.4%
- Equity multiple
- 1.17×
- Total profit
- $10,298
- Equity at exit
- $18,676
Cash invested: $60,480 (down + closing). Projections, not guarantees.
Landlord ↔ Tenant lean methodology
- Overall (STATE)
- 18 Strongly Tenant-Friendly
- State California
- 18 Strongly Tenant-Friendly · D+13
- County
- — inherits STATE
- City
- — inherits STATE
ZIP-level market 95640
- Active inventory
- 119
- Price-to-rent
- 8.3×
Monthly cashflow live
- Estimated rent
- $2,167 medium interval (Pro) →
- Mortgage (P&I)
- −$1,133
- Tax from tax record
- −$184 /mo · $2,213/yr
- Insurance
- −$90
- HOA
- −$8
- Vacancy / Maint / Mgmt
- −$455
- Net cashflow
- $297
Break-even live
UW: 25.0% down · 7.5% · 30yr · 1.5% tax · 5.0% vac · 8.0% maint · 8.0% mgmt
Financing live
Cash to close
- Down payment
- $54,000
- Closing costs
- $6,480
- Reserves months
- —
- Total cash needed
- —
Loan-product check · same deal, 3 products live
Conventional
25% down · 7.5% · 30yr
- Down + closing
- —
- Monthly P&I
- —
- Monthly cashflow
- —
- DSCR
- —
- Eligible?
- —
Personal DTI + credit; lowest rate.
DSCR
20% down · 8.5% · 30yr
- Down + closing
- —
- Monthly P&I
- —
- Monthly cashflow
- —
- DSCR
- —
- Eligible?
- —
No personal income docs; deal must DSCR.
Hard money
10% down · 12.0% · 12mo
- Down + closing
- —
- Monthly P&I
- —
- Monthly cashflow
- —
- DSCR
- —
- Eligible?
- —
Short-term bridge; refi at stabilization.
HOA detail
- Monthly dues
- $8 · $96/yr
Listing history 1 events
-
2000-11-09soldstatus $22,000
ⓘ Source: listings_history table (triggers on properties + properties_extension) + one-shot
backfill from property_details.listing_events for pre-trigger history.
Tax reassessment forecast CA · Resets to sale price
- Current annual tax
- $2,213 · $184/mo
- Projected year-2 tax
- $2,213 · $184/mo
- Expected delta
- $0/yr ($0/mo · 0.0%)
ⓘ Screening estimate from a state-policy table — verify with the county assessor before closing.
Climate risk First Street
- Flood 1/10 Low FEMA zone X (unshaded) · 0% chance over 30 yrs
- Wildfire 8/10 Severe
- Heat 8/10 Severe 7 d/yr ≥104°F today · 15 d/yr by 30 yrs out
- Wind 1/10 Low
- Air quality 10/10 Extreme 25 unhealthy d/yr today · 28 by 30 yrs out
Nearby sold comps map
Loading sold comps map…
Walkable amenities ~0.75 mi
Loading nearby amenities…
Taxation est. · year 1
- Rental income
- $26,009
- − Mortgage interest
- −$12,099
- − Property taxes
- −$2,213
- − Insurance
- −$1,080
- − Repairs & maintenance
- −$2,081
- − Management
- −$2,081
- − HOA
- −$96
- − Depreciation
- −$6,284
- Taxable income
- $76
- Est. tax owed @ 24.0%
- −$18
- After-tax cash flow
- $3,548/yr
For passive investors: Depreciation is non-cash, so a rental often shows a tax loss while cash-flowing — sheltering income. Rental losses are passive: they offset passive income freely, and up to $25,000/yr can offset ordinary (W-2) income if you actively participate and your MAGI is under $100k (phasing out to $0 by $150k); unused losses carry forward. On sale, claimed depreciation is recaptured at up to 25%, and gains may owe capital-gains tax (a 1031 exchange can defer both). Figures are a year-1 estimate at your 24.0% rate — not tax advice; consult a CPA.
Schools (NCES district)
- District
- Amador County Unified
- NCES district ID
- 0602450
- Math proficiency
- 23% ▼ -9.00%
- Reading proficiency
- 37% ▼ -10.00%
- Median HH income
- $55,428
- Composite
- 26.67/100
- National rank
- #7163
- State rank
- #330 of 517 in CA
Livability — Camanche North Shore
- Score
- 51/100
- State rank
- #1095
- US rank
- #25438
Category grades
Schools grade is shown separately in the Schools card above.
Census & demographics
- Census place
- Camanche North Shore, CA
- Population (ZIP)
- 12,811
Population outlook (Amador County) Hauer SSP2
- Today (2025)
- 35,295 people
- By 2030
- 34,147 · -3.3%
- By 2040
- 31,618 · -10.4%
- By 2050
- 29,913 · -15.2%
- By 2075
- 27,308 · -22.6%
- By 2100
- 23,465 · -33.5%
Race, ethnicity, and origin ACS 2023
- Neighborhood character
- Majority White (64%)
- Race & ethnicity
- White 64% Hispanic / Latino 21% Two or more races 17% Black 4% Native American 2%
- Hispanic origin (detail)
- Mexican 14%
- Common ancestry
- Italian 3% Slovak 3% Romanian 2%
- Foreign-born
- 7% · Canada
- Languages at home
- 85% English-only · Spanish 11% Arabic 2%
Political lean MEDSL · Amador
- 2024 margin
- Strong R (+27.8) · D 34.7% · R 62.6% · Other 2.7%
- 2008→2024 swing
- -13.2pp toward R · 2008: -14.6pp · 2024: -27.8pp
- All cycles
- 2024: R+27.8 2020: R+24.4 2016: R+25.2 2012: R+19.0 2008: R+14.6
Not yet ingested
- Civics
- —
Market trends
- HPI YoY
- ▼ -144.63%
- Current HPI
- 169.9705
- Rent YoY
- —
- Metro
- —
- State GDP YoY
- ▲ 3.21%
- F500 in state
- 116
Industry mix (Fortune 500 HQ in CA)
| Industry | F500 HQs | Revenue |
|---|---|---|
| Technology | 27 | $1,492B |
|
||
| Financial Services | 3 | $174B |
|
||
| Retail | 3 | $44B |
|
||
| Insurance | 3 | $26B |
|
||
| Media / Entertainment | 2 | $115B |
|
||
| Pharmaceuticals / Biotech | 2 | $62B |
|
||
Price history
1 event — show timeline
- 2000-11-09 Sold (Public Records) $22,000 Public Records
Property tax history
+3.5%/yrLatest (2025): $2,213 · +1.9% YoY. Source: county tax records.
Cash-flow waterfall
monthlySold comps — $/sqft
last 12 mo · ≤1 miLoading sold comps…