306 N Walnut St · Genoa, NE
Flood risk 1/10 · Minimal
- FEMA flood zone
- X (unshaded)
- Chance of flooding over 30 yrs
- 0.0%
- Est. flood insurance / yr
- $507 – $1,088
Fire risk 3/10 · Minor
- Est. fire insurance / yr
- $1,161 – $2,155
Heat risk 3/10 · Minor
- Hot days now (above 103°F)
- 7 days/yr
- Hot days in 30 yrs
- 16 days/yr
Wind risk 2/10 · Minimal
- Chance of severe wind over 30 yrs
- —
Air-quality risk 2/10 · Minimal
- Unhealthy air days now
- 1 days/yr
- Unhealthy air days in 30 yrs
- 1 days/yr
Risk factors via First Street. Map © Google.
Why this score? — see what drove the B+ grade
The composite is a weighted blend of 9 inputs, each scored 0–100. Each bar is that input's sub-score; the figure is the points it added to the 100-point composite (weight × sub-score).
- Cash flow +30.0/30.0
- 1% rule +10.0/10.0
- DSCR +10.0/10.0
- ARV discount +7.5/15.0
- Appreciation +6.5/10.0
- Schools +3.9/10.0
- Livability +3.5/5.0
- Rent growth +2.5/5.0
- Condition / age +2.5/5.0
$30,000
🖨 Deal sheet 📄 Offer letter ✓ Due diligence
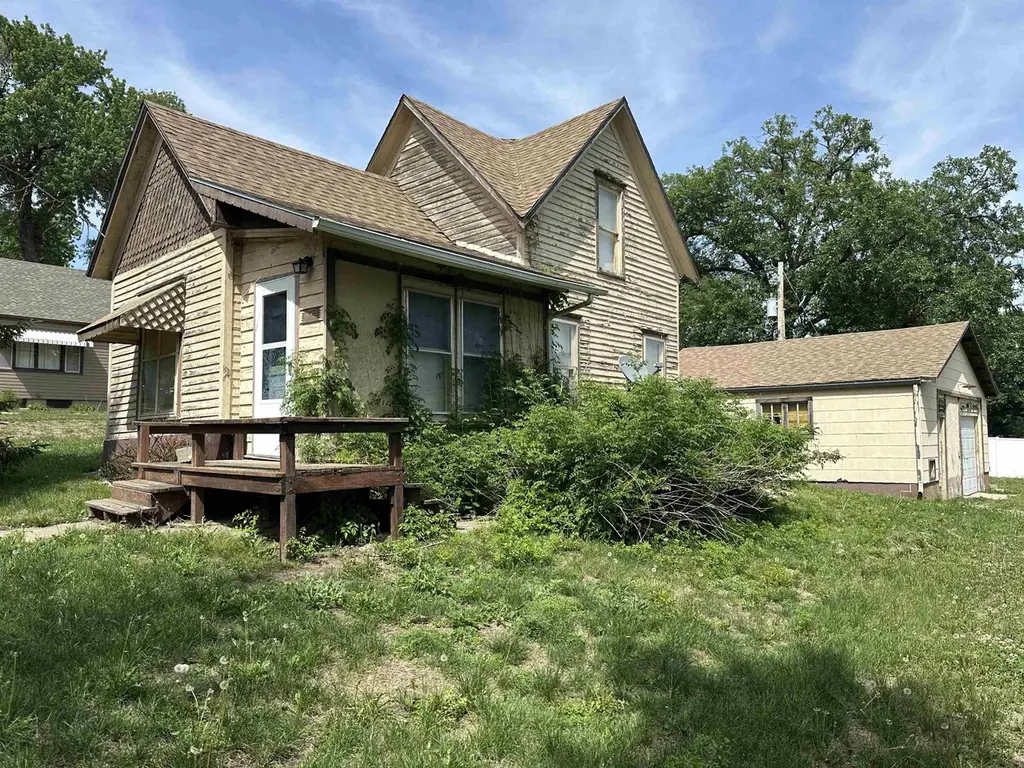
Listing remarks
* * AUCTION to be held June 23rd 2026 with closing to be on July 10th 2026. Open house on June 12th from 5:00pm to 6:30pm. Starting bid will be $30,000 * * Great investment, flip or rental opportunity with this house. 2 bedroom, 1 bath oversized 1 car garage with a shop area. This house offers 1192 square feet and the garage is 624 sq ft. Built on a large lot. 79x132. This home has great potential. "As-Is" Sale.
Key facts
- 0.24 acre lot
- Garage
- Built 1905
Property features AI
Exterior
- Parking: Detached 1-car garage
- Home design: Single-family residence; One story
- Exterior features: Lot approximately 79 x 132
Interior
- Bedrooms: One bedroom on the main level
- Interior features: Basement present
Neighborhood map
What this means for you Summary
Snapshot
- This is a 2-bed/1.0-bath single-family listed at $30k.
Deal economics
- At list price, monthly cash flow is $612 ($7k/yr) — positive.
- The deal already cash-flows at list — no discount required.
- Meets the 1% rule at list price ($1k rent vs $30k).
- Recommended offer: $30k (1.5% below list) — sets the bar for market timing.
Location & tenants
- Location reads 70/100 on livability (#216 in NE) — a middle-class / working-renter tenant base. Strengths: cost of living A+, housing A+, health & safety A+; Watch: amenities F, commute F, employment F.
- Twin River Public Schools (rural): math 45% / reading 48% proficiency, ranked #79 of 111 in NE (top 71%) — families likely to look elsewhere, expect single-tenant / working-renter base with shorter leases.
- Market conditions: 11 active listings in the ZIP; 4 units permitted in Nance County in 2024 (0 in 5+ unit buildings).
Forward outlook
- In year one you build about $1k of equity ($207 loan paydown + $909 appreciation (3.0% local appreciation)).
- Nance County population projected at -12% by 2050 — secular population decline; favor cash flow + early exit over multi-decade hold.
- At projected returns (3.0% appreciation + 3.0% rent growth), your $8k cash investment doubles in ~1 year — after that, you're playing with house money.
Negotiation context
- It's been on market 22 days — a 2% lower offer ($30k) is reasonable based on typical stale-listing flexibility.
Risks & watch-outs
- Watch-outs: built in 1905 — expect roof / HVAC / electrical / plumbing capex.
Questions for the listing agent
- Built in 1905 — when were the roof, HVAC, electrical panel, plumbing, and water heater last replaced?
- Is there a deadline driving the sale (1031 exchange, divorce, estate, relocation)? That informs how much negotiation room exists.
- Schools are B-rated — typically a magnet for longer-tenancy family renters. What's the average tenant stay here, and is there a school-zone premium baked into asking?
- What's the average days-on-market for RENTAL listings here right now (not sales)? A rising rental-DOM trend means longer vacancies and softer asking-rent achievability than the comps imply.
- What's the recent tenant-quality profile in this submarket — average credit score on applications, eviction rate, late-payment / NSF rate, and stable-employment percentage? A property-management company in the area should have these aggregated.
- How much new for-sale + rental construction is in the pipeline within 1–3 miles? Heavy new supply typically softens prices + rents 12–24 months out; constrained supply supports both.
Investment metrics
- 1% rule
- 3.49% ✓
- Cap rate
- 30.77%
- Cash-on-cash
- 87.40%
- DSCR
- 4.89
- GRM
- 2.4
CMA / ARV
- ARV (on-the-fly)
- $84,632
- Comps found
- 1
Show comp detail 1 sale within ~0.75 mi
| Address | Dist | Beds/Ba | Sqft | Sold | Price | $/sf | Match |
|---|---|---|---|---|---|---|---|
| 413 Walnut St | 0.44mi | 2/2.0 | 1,024 (-14%) | 18mo | $72,500 | $71 | 37 |
Match score weights: distance 35% · size 25% · config 20% · recency 20%. Top-matched comps best support the ARV.
Projected returns pro-forma
3.03% appreciation · 3.0% rent growth · sell at horizon
- IRR
- 91.8%
- Equity multiple
- 6.08×
- Total profit
- $42,650
- Equity at exit
- $13,541
- IRR
- 91.3%
- Equity multiple
- 12.57×
- Total profit
- $97,191
- Equity at exit
- $20,909
Cash invested: $8,400 (down + closing). Projections, not guarantees.
Landlord ↔ Tenant lean methodology
- Overall (STATE)
- 83 Strongly Landlord-Friendly
- State Nebraska
- 83 Strongly Landlord-Friendly · R+13
- County
- — inherits STATE
- City
- — inherits STATE
ZIP-level market 68640
- Home prices YoY
- 1.6%
- Active inventory
- 11
- Price-to-rent
- 2.4×
Monthly cashflow live
- Estimated rent
- $1,046 medium interval (Pro) →
- Mortgage (P&I)
- −$157
- Tax from tax record
- −$45 /mo · $538/yr
- Insurance
- −$12
- HOA
- −$0
- Vacancy / Maint / Mgmt
- −$220
- Net cashflow
- $612
Break-even live
UW: 25.0% down · 7.5% · 30yr · 1.5% tax · 5.0% vac · 8.0% maint · 8.0% mgmt
Financing live
Cash to close
- Down payment
- $7,500
- Closing costs
- $900
- Reserves months
- —
- Total cash needed
- —
Loan-product check · same deal, 3 products live
Conventional
25% down · 7.5% · 30yr
- Down + closing
- —
- Monthly P&I
- —
- Monthly cashflow
- —
- DSCR
- —
- Eligible?
- —
Personal DTI + credit; lowest rate.
DSCR
20% down · 8.5% · 30yr
- Down + closing
- —
- Monthly P&I
- —
- Monthly cashflow
- —
- DSCR
- —
- Eligible?
- —
No personal income docs; deal must DSCR.
Hard money
10% down · 12.0% · 12mo
- Down + closing
- —
- Monthly P&I
- —
- Monthly cashflow
- —
- DSCR
- —
- Eligible?
- —
Short-term bridge; refi at stabilization.
Listing history 15 events
-
2026-06-18days on market $30,000 Active 22 DOM
-
2026-06-17days on market $30,000 Active 21 DOM
-
2026-06-16days on market $30,000 Active 20 DOM
-
2026-06-15days on market $30,000 Active 19 DOM
-
2026-06-13days on market $30,000 Active 17 DOM
-
2026-06-12days on market $30,000 Active 16 DOM
-
2026-06-09days on market $30,000 Active 13 DOM
-
2026-06-08days on market $30,000 Active 12 DOM
-
2026-06-07days on market $30,000 Active 11 DOM
-
2026-06-07days on market $30,000 Active 10 DOM
-
2026-06-04days on market $30,000 Active 7 DOM
-
2026-06-02days on market $30,000 Active 6 DOM
-
2026-06-01days on market $30,000 Active 5 DOM
-
2026-05-31days on market $30,000 Active 4 DOM
-
2026-05-27$30,000 Active
ⓘ Source: listings_history table (triggers on properties + properties_extension) + one-shot
backfill from property_details.listing_events for pre-trigger history.
Tax reassessment forecast NE · Resets to sale price
- Current annual tax
- $538 · $45/mo
- Projected year-2 tax
- $538 · $45/mo
- Expected delta
- $0/yr ($0/mo · 0.0%)
ⓘ Screening estimate from a state-policy table — verify with the county assessor before closing.
Climate risk First Street
- Flood 1/10 Low FEMA zone X (unshaded) · 0% chance over 30 yrs
- Wildfire 3/10 Moderate
- Heat 3/10 Moderate 7 d/yr ≥103°F today · 16 d/yr by 30 yrs out
- Wind 2/10 Low
- Air quality 2/10 Low 1 unhealthy d/yr today · 1 by 30 yrs out
Nearby sold comps map
Loading sold comps map…
Walkable amenities ~0.75 mi
Loading nearby amenities…
Taxation est. · year 1
- Rental income
- $12,554
- − Mortgage interest
- −$1,680
- − Property taxes
- −$538
- − Insurance
- −$150
- − Repairs & maintenance
- −$1,004
- − Management
- −$1,004
- − Depreciation
- −$873
- Taxable income
- $7,304
- Est. tax owed @ 24.0%
- −$1,753
- After-tax cash flow
- $5,589/yr
For passive investors: Depreciation is non-cash, so a rental often shows a tax loss while cash-flowing — sheltering income. Rental losses are passive: they offset passive income freely, and up to $25,000/yr can offset ordinary (W-2) income if you actively participate and your MAGI is under $100k (phasing out to $0 by $150k); unused losses carry forward. On sale, claimed depreciation is recaptured at up to 25%, and gains may owe capital-gains tax (a 1031 exchange can defer both). Figures are a year-1 estimate at your 24.0% rate — not tax advice; consult a CPA.
Schools (NCES district)
- District
- Twin River Public Schools
- NCES district ID
- 3100129
- Math proficiency
- 45% ▼ -19.00%
- Reading proficiency
- 48% ▼ -5.00%
- Median HH income
- $45,425
- Composite
- 39.44/100
- National rank
- #3961
- State rank
- #79 of 111 in NE
Livability — Genoa
- Score
- 70/100
- State rank
- #216
- US rank
- #7720
Category grades
Schools grade is shown separately in the Schools card above.
Census & demographics
- Census place
- Genoa, NE
- Population (ZIP)
- 1,045
Population outlook (Nance County) Hauer SSP2
- Today (2025)
- 3,425 people
- By 2030
- 3,330 · -2.8%
- By 2040
- 3,165 · -7.6%
- By 2050
- 3,004 · -12.3%
- By 2075
- 2,787 · -18.6%
- By 2100
- 2,559 · -25.3%
Race, ethnicity, and origin ACS 2023
- Neighborhood character
- Predominantly White (94%)
- Race & ethnicity
- White 94% Two or more races 3% Hispanic / Latino 2%
- Common ancestry
- Romanian 20% Portuguese 1% Lithuanian 1%
- Foreign-born
- 0%
- Languages at home
- 98% English-only · Spanish 2%
Political lean MEDSL · Nance
- 2024 margin
- Solid R (+60.4) · D 19.2% · R 79.6% · Other 1.2%
- 2008→2024 swing
- -27.2pp toward R · 2008: -33.2pp · 2024: -60.4pp
- All cycles
- 2024: R+60.4 2020: R+58.8 2016: R+61.1 2012: R+38.7 2008: R+33.2
Not yet ingested
- Civics
- —
Market trends
- HPI YoY
- ▲ 3.03%
- Current HPI
- 192.7896
- Rent YoY
- —
- Metro
- —
- State GDP YoY
- ▲ 0.68%
- F500 in state
- 2
Industry mix (Fortune 500 HQ in NE)
| Industry | F500 HQs | Revenue |
|---|---|---|
| Conglomerate | 1 | $371B |
|
||
Price history
1 event — show timeline
- 2026-05-27 Listed $30,000 CBOR
Property tax history
+0.1%/yrLatest (2025): $538 · +0.7% YoY. Source: county tax records.
Cash-flow waterfall
monthlySold comps — $/sqft
last 12 mo · ≤1 miLoading sold comps…