 Duplex
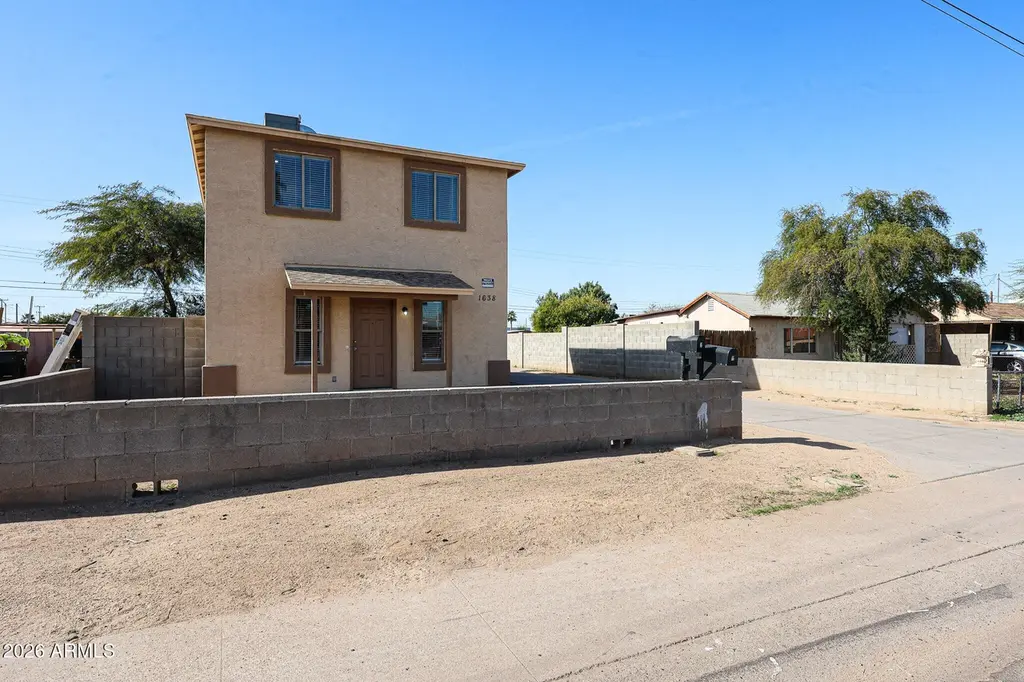
1638 S 5th St · Phoenix, AZ
Flood risk 1/10 · Minimal
- FEMA flood zone
- X (shaded)
- Chance of flooding over 30 yrs
- 0.0%
- Est. flood insurance / yr
- $507 – $1,088
Fire risk 1/10 · Minimal
- Est. fire insurance / yr
- $610 – $1,132
Heat risk 9/10 · Severe
- Hot days now (above 112°F)
- 7 days/yr
- Hot days in 30 yrs
- 19 days/yr
Wind risk 1/10 · Minimal
- Chance of severe wind over 30 yrs
- —
Air-quality risk 2/10 · Minimal
- Unhealthy air days now
- 2 days/yr
- Unhealthy air days in 30 yrs
- 2 days/yr
Risk factors via First Street. Map © Google.
Why this score? — see what drove the D grade
The composite is a weighted blend of 9 inputs, each scored 0–100. Each bar is that input's sub-score; the figure is the points it added to the 100-point composite (weight × sub-score).
- Cash flow +15.2/30.0
- ARV discount +7.5/15.0
- Appreciation +4.7/10.0
- DSCR +4.6/10.0
- Livability +3.8/5.0
- 1% rule +2.9/10.0
- Condition / age +2.5/5.0
- Rent growth +1.9/5.0
- Schools +1.1/10.0
$529,000
🖨 Deal sheet 📄 Offer letter ✓ Due diligence
Multi-family units
County records classify this as Multi-Family (2-4 Unit). Listing-text estimate: 2 units. confirmed
Listing remarks
Great duplex investment opportunity near Downtown Phoenix! Two-unit property with easy access to I-17, I-10, and Sky Harbor Airport. Perfect for investors or owner-occupants. Convenient location close to restaurants, schools, shopping, and public transportation.
Key facts
- Easy access to i-17
- Easy access to i-10
- 8 parking spots
Tags
Property features AI
Finance
- Other: Lot dimensions listed as 6,335; Directions: From 7th St. take Mohave East to 5th St., turn right on 5th St.; property is on the second lot on the left.
- Financial info: $1,341 annual tax (2025)
- HOA & community: No pool; Community features: Other; see remarks
Exterior
- Parking: 8 total parking spaces; 4 covered spaces; 4 open spaces; Carports available; More than one space per unit
- Utilities: Electric service by APS; Public sewer; City franchise water
- Home design: Fee simple ownership; Two buildings on the property
- Construction: Wood frame construction; Painted exterior; Stucco finish; Composition roof
- Exterior features: Painted stucco finish; Wood frame construction; Composition roof; Asphalt road access
Interior
- Kitchen: Built-in electric oven; Disposal
- Flooring: Carpet; Vinyl
- Heating & cooling: Electric heating; Central air conditioning
- Interior features: Disposal; Built-in electric oven; Washer/dryer hookup
- Laundry & utility: Washer/dryer hookup
Neighborhood map
What this means for you Summary
Snapshot
- This is a 2 × 2-bed/1-bath units multifamily listed at $529k.
Deal economics
- At list price, monthly cash flow is $179 ($2k/yr) — positive. Per door: $90/mo.
- The deal already cash-flows at list — no discount required.
- To meet the 1% rule (rent ≥ 1% of price), the offer needs to be $416k (21.4% below list).
- Recommended offer: $416k (21.4% below list) — sets the bar for 1% rule.
- Cap rate 6.7% vs local median 3.3% in Phoenix — top-decile yield for the area; either an underpriced asset or a hidden risk that comps aren't pricing in. Stress-test before assuming the spread holds.
Location & tenants
- Location reads 75/100 on livability (#16 in AZ, #3,924 nationally) — a middle-class / working-renter tenant base. Strengths: amenities A+, commute A+, housing A+; Watch: health & safety C-, crime F.
- Phoenix Union High School District (4286) (urban): math 10% / reading 15% proficiency, ranked #224 of 249 in AZ (top 90%) — low school quality limits family demand, transient renter base, plan for 1-2y turnover.
- Market conditions: Rents soft (-2.3%/yr); 76 active listings in the ZIP; 6 comparable units currently listed for rent nearby; rentals leasing fast (median 1d on market — plan ~1-2 weeks tenant-placement turnaround); 36,011 units permitted in Maricopa County in 2024 (12,801 in 5+ unit buildings).
- At $4,159/mo this rent would consume 68% of the median local household income ($74k/yr) (locally 1285% of renters already pay >50% of income on rent) — very limited rent-growth headroom before tenants either downsize or default.
Forward outlook
- In year one you build about $8 of equity ($4k loan paydown + $-4k appreciation (-0.7% local appreciation)).
- Maricopa County population projected at +38% by 2050 — long-run rental-demand tailwind backs the buy-and-hold thesis.
Negotiation context
- It's been on market 35 days — a 3% lower offer ($513k) is reasonable based on typical stale-listing flexibility.
- 21 sale attempts since 20y ago with the ask held roughly flat each time — persistent listings suggest the price (not the market) is what's stuck; bring a comps-based counter.
- Current owner paid $380k; 39% above their basis — modest negotiation headroom, anchor on the comps not their cost.
Risks & watch-outs
- Climate carrying-cost: extreme-heat days projected 7→19/yr by 2055 (HVAC capex compounding) — expect insurance premiums to compound above CPI over the hold.
Questions for the listing agent
- It's been on market 35 days. Have you received any prior offers? Is the seller open to a 21% concession, seller financing, or rate buy-down credit?
- Can we see the unit-by-unit rent roll, current vacancy, and any below-market leases? What's the average tenancy length?
- What capital expenditures (roof, boiler, parking lot, exteriors) have been made in the last 5 years, and what's planned in the next 2?
- Is there a deadline driving the sale (1031 exchange, divorce, estate, relocation)? That informs how much negotiation room exists.
- Crime grade is F in this area — have there been break-ins, vandalism, or insurance claims at this property in the last 3 years? What carrier currently insures it and at what premium?
- The area grade is low — what's the realistic commute time and amenity access for the typical tenant pool here? Any planned neighborhood developments (good or bad) we should know about?
- What's the average days-on-market for RENTAL listings here right now (not sales)? A rising rental-DOM trend means longer vacancies and softer asking-rent achievability than the comps imply.
- What's the recent tenant-quality profile in this submarket — average credit score on applications, eviction rate, late-payment / NSF rate, and stable-employment percentage? A property-management company in the area should have these aggregated.
- How much new apartment / multifamily construction is in the pipeline within 1–3 miles? Heavy new supply (>2% of stock underway) typically softens rents 12–24 months out; light construction supports rent growth.
Investment metrics
- 1% rule
- 0.79% ✗
- Cap rate
- 6.70%
- Cash-on-cash
- 1.45%
- DSCR
- 1.06
- GRM
- 10.6
CMA / ARV
No comps found within radius.
Projected returns pro-forma
-0.69% appreciation · 0.0% rent growth · sell at horizon
- IRR
- -5.2%
- Equity multiple
- 0.77×
- Total profit
- $-33,432
- Equity at exit
- $135,613
- IRR
- -0.9%
- Equity multiple
- 0.92×
- Total profit
- $-11,751
- Equity at exit
- $149,268
Cash invested: $148,120 (down + closing). Projections, not guarantees.
Landlord ↔ Tenant lean methodology
- Overall (STATE)
- 87 Strongly Landlord-Friendly
- State Arizona
- 87 Strongly Landlord-Friendly · R+3
- County
- — inherits STATE
- City
- — inherits STATE
ZIP-level market 85004
- Home prices YoY
- -0.2%
- Rents YoY
- -2.3%
- Active inventory
- 76
- Price-to-rent
- 21.2×
Monthly cashflow live
- Estimated rent
- $4,159 high interval (Pro) →
- Mortgage (P&I)
- −$2,774
- Tax from tax record
- −$112 /mo · $1,341/yr
- Insurance
- −$220
- HOA
- −$0
- Vacancy / Maint / Mgmt
- −$873
- Net cashflow
- $179
Break-even live
2-unit breakdown (identical units grouped — click to expand)
| Units | Beds | Baths | Est. rent |
|---|---|---|---|
| 2× units | 2 | 1 | $4,158 |
| #1 | 2 | 1 | $2,079 |
| #2 | 2 | 1 | $2,079 |
| Total (2 units) | $4,159 | ||
UW: 25.0% down · 7.5% · 30yr · 1.5% tax · 5.0% vac · 8.0% maint · 8.0% mgmt
Financing live
Cash to close
- Down payment
- $132,250
- Closing costs
- $15,870
- Reserves months
- —
- Total cash needed
- —
Loan-product check · same deal, 3 products live
Conventional
25% down · 7.5% · 30yr
- Down + closing
- —
- Monthly P&I
- —
- Monthly cashflow
- —
- DSCR
- —
- Eligible?
- —
Personal DTI + credit; lowest rate.
DSCR
20% down · 8.5% · 30yr
- Down + closing
- —
- Monthly P&I
- —
- Monthly cashflow
- —
- DSCR
- —
- Eligible?
- —
No personal income docs; deal must DSCR.
Hard money
10% down · 12.0% · 12mo
- Down + closing
- —
- Monthly P&I
- —
- Monthly cashflow
- —
- DSCR
- —
- Eligible?
- —
Short-term bridge; refi at stabilization.
Rent comps 6 comps
| Address | Beds | Baths | Sqft | Rent | $/sqft | DOM | Units | Dist |
|---|---|---|---|---|---|---|---|---|
| 1714 S 5th St Phoenix, AZ | 3.0 | 2.5 | 1576 | $2,350 | $1.49 | 1d | 1 | 0.10mi |
| 1010 E Cocopah St Phoenix, AZ | 3.0 | 2.0 | 1590 | $2,850 | $1.79 | 2d | 1 | 0.47mi |
| 424 S 2nd St #208 Phoenix, AZ | 1.0 | 2.0 | 1710 | $3,000 | $1.75 | 1d | 1 | 0.81mi |
| 222 E Jefferson St Phoenix, AZ | 2.0 | 1.0–2.5 | 1135 | $4,225 | $3.72 | 1d | 50 | 1.04mi |
| 1325 W Apache St Phoenix, AZ | 3.0 | 2.0 | 1885 | $1,675 | $0.89 | 7d | 1 | 1.29mi |
| 50 W Van Buren St Phoenix, AZ | 2.0 | 1.0–2.0 | 1231 | $8,455 | $6.87 | 1d | 126 | 1.40mi |
Listing history 50 events
-
2026-06-18days on market $529,000 Active 35 DOM
-
2026-06-17days on market $529,000 Active 34 DOM
-
2026-06-16days on market $529,000 Active 33 DOM
-
2026-06-15days on market $529,000 Active 32 DOM
-
2026-06-13days on market $529,000 Active 30 DOM
-
2026-06-13days on market $529,000 Active 29 DOM
-
2026-06-09days on market $529,000 Active 26 DOM
-
2026-06-08days on market $529,000 Active 25 DOM
-
2026-06-07days on market $529,000 Active 24 DOM
-
2026-06-04days on market $529,000 Active 21 DOM
-
2026-06-03days on market $529,000 Active 20 DOM
-
2026-06-02days on market $529,000 Active 19 DOM
-
2026-06-01days on market $529,000 Active 18 DOM
-
2026-05-31days on market $529,000 Active 17 DOM
-
2026-05-05$529,000 Active
-
2017-04-03soldstatus $379,800
-
2017-03-31soldstatus $180,000
-
2017-03-03historical
-
2017-02-25historical Under Contract Accepting Backups
-
2017-02-10$189,999 Active
-
2016-11-02historical
-
2016-10-30price $189,900
-
2016-10-28price $192,999
-
2016-10-17status Active
-
2016-10-15historical Under Contract Accepting Backups
-
2016-10-15status Active
-
2016-10-13status Pending
-
2016-10-09$193,999 Active
-
2016-10-07historical
-
2016-10-06historical Under Contract Accepting Backups
-
2016-10-02historical
-
2016-09-30$389,998 Active
-
2016-09-30$194,999 Active
-
2016-09-20historical
-
2016-09-10$199,000 Active
-
2012-07-02soldstatus $115,000 Closed
-
2012-07-02soldstatus $115,000
-
2012-06-09$125,000 Active
-
2012-04-03historical
-
2012-04-02status Active
-
2012-03-30status Pending
-
2012-03-28price $105,000
-
2012-02-21price $95,000
-
2012-01-26price $98,000
-
2012-01-24status Active
-
2011-12-27status Pending
-
2011-12-05price $97,500
-
2011-11-28price $98,500
-
2011-11-23$99,500 Active
-
2011-11-04historical
ⓘ Source: listings_history table (triggers on properties + properties_extension) + one-shot
backfill from property_details.listing_events for pre-trigger history.
Tax reassessment forecast AZ · Resets to sale price
- Current annual tax
- $1,341 · $112/mo
- Projected year-2 tax
- $3,491 · $291/mo
- Expected delta
- +$2,150/yr (+$179/mo · 160.3%)
ⓘ Screening estimate from a state-policy table — verify with the county assessor before closing.
Climate risk First Street
- Flood 1/10 Low FEMA zone X (shaded) · 0% chance over 30 yrs
- Wildfire 1/10 Low
- Heat 9/10 Extreme 7 d/yr ≥112°F today · 19 d/yr by 30 yrs out
- Wind 1/10 Low
- Air quality 2/10 Low 2 unhealthy d/yr today · 2 by 30 yrs out
Nearby sold comps map
Loading sold comps map…
Walkable amenities ~0.75 mi
Loading nearby amenities…
Taxation est. · year 1
- Rental income
- $49,908
- − Mortgage interest
- −$29,632
- − Property taxes
- −$1,341
- − Insurance
- −$2,645
- − Repairs & maintenance
- −$3,993
- − Management
- −$3,993
- − Depreciation
- −$15,389
- Taxable loss
- −$7,085
- Est. tax savings @ 24.0%
- +$1,700
- After-tax cash flow
- $3,852/yr
For passive investors: Depreciation is non-cash, so a rental often shows a tax loss while cash-flowing — sheltering income. Rental losses are passive: they offset passive income freely, and up to $25,000/yr can offset ordinary (W-2) income if you actively participate and your MAGI is under $100k (phasing out to $0 by $150k); unused losses carry forward. On sale, claimed depreciation is recaptured at up to 25%, and gains may owe capital-gains tax (a 1031 exchange can defer both). Figures are a year-1 estimate at your 24.0% rate — not tax advice; consult a CPA.
Schools (NCES district)
- District
- Phoenix Union High School District (4286)
- NCES district ID
- 0406330
- Math proficiency
- 10% ▼ -27.00%
- Reading proficiency
- 15% ▼ -18.00%
- Median HH income
- $39,055
- Composite
- 10.63/100
- National rank
- #9773
- State rank
- #224 of 249 in AZ
Livability — Phoenix
- Score
- 75/100
- State rank
- #16
- US rank
- #3924
Category grades
Schools grade is shown separately in the Schools card above.
Census & demographics
- Census place
- Phoenix, AZ
- County
- Maricopa County · 4,537,380 people
- City population
- 1,500,198
- Metro
- Phoenix-Mesa-Chandler, AZ
- Population (ZIP)
- 12,408
- Household income
- $73,750
- Rent vs Own
- Severe rent burden
- 1285.0
Population outlook (Maricopa County) Hauer SSP2
- Today (2025)
- 4,979,203 people
- By 2030
- 5,378,229 · +8.0%
- By 2040
- 6,156,598 · +23.6%
- By 2050
- 6,872,376 · +38.0%
- By 2075
- 8,401,270 · +68.7%
- By 2100
- 9,247,439 · +85.7%
Race, ethnicity, and origin ACS 2023
- Neighborhood character
- Diverse neighborhood (Simpson 0.66)
- Race & ethnicity
- White 53% Hispanic / Latino 25% Two or more races 16% Native American 8% Black 6% Asian 6%
- Hispanic origin (detail)
- Mexican 20%
- Common ancestry
- Italian 3% Romanian 3% Slovak 1%
- Foreign-born
- 13% · Canada, Jamaica, South Korea
- Languages at home
- 77% English-only · Spanish 15% Other Indo-European 2% Other Asian/Pacific 1%
Political lean MEDSL · Maricopa
- 2024 margin
- Toss-up / Even · D 47.7% · R 51.2% · Other 1.1%
- 2008→2024 swing
- +7.1pp toward D · 2008: -10.6pp · 2024: -3.5pp
- All cycles
- 2024: R+3.5 2020: D+2.2 2016: R+3.5 2012: R+12.0 2008: R+10.6
Not yet ingested
- Civics
- —
Market trends
- HPI YoY
- ▼ -0.69%
- Current HPI
- 363.9116
- Rent YoY
- ▼ -2.30%
- Metro
- Phoenix-Mesa-Chandler, AZ
- State GDP YoY
- ▲ 4.54%
- F500 in state
- 20
Industry mix (Fortune 500 HQ in AZ)
| Industry | F500 HQs | Revenue |
|---|---|---|
| Technology | 2 | $13B |
|
||
| Mining / Metals | 1 | $23B |
|
||
| Environmental Services | 1 | $16B |
|
||
| Metals / Steel | 1 | $14B |
|
||
| Technology Distribution | 1 | $9B |
|
||
| Homebuilding | 1 | $8B |
|
||
Price history
+1222.5% since first listed59 events — show timeline
- 2026-05-05 Listed $529,000 ARMLS
- 2017-04-03 Sold (Public Records) $379,800 Public Records
- 2017-03-31 Sold (Public Records) $180,000 Public Records
- 2017-03-03 Listing Removed — ARMLS
- 2017-02-25 Contingent — ARMLS
- 2017-02-10 Listed $189,999 ARMLS
- 2016-11-02 Listing Removed — ARMLS
- 2016-10-30 Price Changed $189,900 ARMLS
- 2016-10-28 Price Changed $192,999 ARMLS
- 2016-10-17 Relisted — ARMLS
- 2016-10-15 Contingent — ARMLS
- 2016-10-15 Relisted — ARMLS
- 2016-10-13 Pending — ARMLS
- 2016-10-09 Listed $193,999 ARMLS
- 2016-10-07 Listing Removed — ARMLS
- 2016-10-06 Contingent — ARMLS
- 2016-10-02 Listing Removed — ARMLS
- 2016-09-30 Listed $389,998 ARMLS
- 2016-09-30 Listed $194,999 ARMLS
- 2016-09-20 Listing Removed — ARMLS
- 2016-09-10 Listed $199,000 ARMLS
- 2012-07-02 Sold (Public Records) $115,000 Public Records
- 2012-07-02 Sold (MLS) $115,000 ARMLS
- 2012-06-09 Listed $125,000 ARMLS
- 2012-04-03 Listing Removed — ARMLS
- 2012-04-02 Relisted — ARMLS
- 2012-03-30 Pending — ARMLS
- 2012-03-28 Price Changed $105,000 ARMLS
- 2012-02-21 Price Changed $95,000 ARMLS
- 2012-01-26 Price Changed $98,000 ARMLS
- 2012-01-24 Relisted — ARMLS
- 2011-12-27 Pending — ARMLS
- 2011-12-05 Price Changed $97,500 ARMLS
- 2011-11-28 Price Changed $98,500 ARMLS
- 2011-11-23 Listed $99,500 ARMLS
- 2011-11-04 Listing Removed — ARMLS
- 2011-09-22 Price Changed $119,900 ARMLS
- 2011-08-18 Listed $129,900 ARMLS
- 2010-06-17 Sold (MLS) $63,000 ARMLS
- 2010-05-15 Pending — ARMLS
- 2010-04-07 Listed $62,800 ARMLS
- 2007-07-02 Sold (Public Records) $275,000 Public Records
- 2007-07-02 Sold (MLS) $275,000 ARMLS
- 2007-04-23 Listing Removed — ARMLS
- 2007-04-23 Listing Removed — ARMLS
- 2007-04-23 Listed $285,000 ARMLS
- 2007-04-05 Listed $279,900 ARMLS
- 2007-03-09 Listed $279,900 ARMLS
- 2007-01-16 Listing Removed — ARMLS
- 2006-12-06 Listed $285,000 ARMLS
- 2006-11-09 Listing Removed — ARMLS
- 2006-11-01 Listed $285,000 ARMLS
- 2006-08-05 Sold (MLS) $270,000 ARMLS
- 2006-08-04 Sold (Public Records) $270,000 Public Records
- 2006-03-29 Listing Removed — ARMLS
- 2006-03-28 Listed $270,000 ARMLS
- 2006-03-16 Sold (MLS) $40,000 ARMLS
- 2006-02-03 Listing Removed — ARMLS
- 2006-01-28 Listed $40,000 ARMLS
Property tax history
-2.7%/yrLatest (2025): $1,341 · +6.2% YoY. Source: county tax records.
Cash-flow waterfall
monthlySold comps — $/sqft
last 12 mo · ≤1 miLoading sold comps…