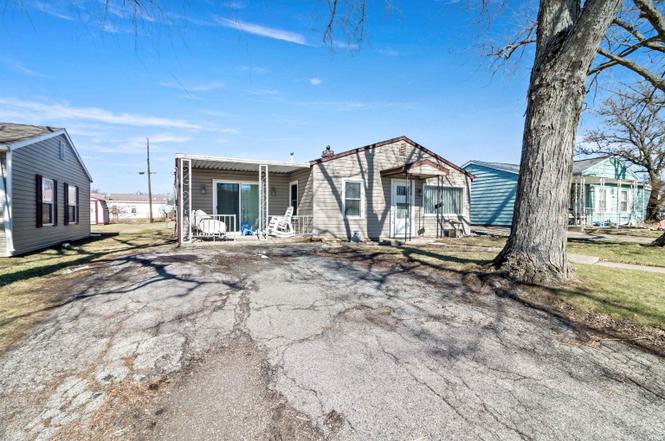
1113 E Grant St · Marion, IN
Flood risk 1/10 · Minimal
- FEMA flood zone
- X (unshaded)
- Chance of flooding over 30 yrs
- 0.0%
- Est. flood insurance / yr
- $507 – $1,088
Fire risk 1/10 · Minimal
- Est. fire insurance / yr
- $717 – $1,331
Heat risk 3/10 · Minor
- Hot days now (above 100°F)
- 7 days/yr
- Hot days in 30 yrs
- 18 days/yr
Wind risk 2/10 · Minimal
- Chance of severe wind over 30 yrs
- —
Air-quality risk 2/10 · Minimal
- Unhealthy air days now
- 1 days/yr
- Unhealthy air days in 30 yrs
- 2 days/yr
Risk factors via First Street. Map © Google.
Why this score? — see what drove the C grade
The composite is a weighted blend of 9 inputs, each scored 0–100. Each bar is that input's sub-score; the figure is the points it added to the 100-point composite (weight × sub-score).
- Cash flow +30.0/30.0
- DSCR +10.0/10.0
- 1% rule +8.1/10.0
- Livability +3.2/5.0
- Rent growth +2.5/5.0
- Condition / age +2.5/5.0
- Schools +1.7/10.0
- ARV discount +0.0/15.0
- Appreciation +0.0/10.0
$90,000
🖨 Deal sheet (PDF) 📄 Offer letter ✓ Due diligence
Listing remarks
Welcome to this inviting 3-bedroom, 1-bath home, nestled in a sought-after subdivision. The home features two spacious living rooms, offering plenty of room for relaxation and entertaining. The second living room presents a unique opportunity—it could easily be converted into a fourth bedroom, perfect for a growing family or those in need of extra space. Located just minutes from local schools and shopping centers, this home provides the perfect balance of convenience and comfort. The peaceful, family-friendly neighborhood is ideal for those looking to settle into a vibrant community. This home is selling AS-IS.
Key facts
- 6,000 sq ft lot
- Built 1959
- Listed 56 days
Tags
Neighborhood map
What this means for you Summary
Snapshot
- This is a 3-bed/1.0-bath single-family listed at $90k.
Deal economics
- At list price, monthly cash flow is $351 ($4k/yr) — positive.
- The deal already cash-flows at list — no discount required.
- Meets the 1% rule at list price ($1k rent vs $90k).
- Recommended offer: $87k (3.0% below list) — sets the bar for market timing.
- Cap rate 11.0% vs local median 8.5% in Marion — meaningfully above typical; check what's discounted (condition, days-on-market, listing class) to confirm the premium yield is real.
Location & tenants
- Location reads 65/100 on livability (#337 in IN) — a middle-class / working-renter tenant base. Strengths: crime A+, cost of living A+, housing A+; Watch: amenities F, commute F, employment F.
- Marion Community Schools (town): math 18% / reading 24% proficiency, ranked #277 of 301 in IN (top 92%) — low school quality limits family demand, transient renter base, plan for 1-2y turnover; 67% free/reduced lunch — lower-income household profile, screen leases tightly.
- Zoned schools: Riverview Elementary School (math 42% / reading 27%, grade F, #597 of 994 statewide, top 63%, 396 students, 72% FRL); John L Mcculloch Junior High Sch (math 11% / reading 22%, grade F, #287 of 330 statewide, top 88%, 524 students, 74% FRL); Marion High School (math 12% / reading 47%, grade F, #308 of 369 statewide, top 84%, 1,050 students, 66% FRL) — zoned schools at 71% FRL track the district average.
- Market conditions: 126 active listings in the ZIP; 1 comparable units currently listed for rent nearby; 52 units permitted in Grant County in 2024 (8 in 5+ unit buildings).
Forward outlook
- Local home prices are declining (-3.0%/yr); year-one equity from $622 of loan paydown is wiped out by about $3k of value loss. Plan a longer hold.
- Grant County population projected at -18% by 2050 — secular population decline; favor cash flow + early exit over multi-decade hold.
- At projected returns (-3.0% appreciation + 3.0% rent growth), your $25k cash investment doubles in ~8 years — after that, you're playing with house money.
Negotiation context
- It's been on market 56 days — a 3% lower offer ($87k) is reasonable based on typical stale-listing flexibility.
Risks & watch-outs
- Watch-outs: built in 1959 — expect roof / HVAC / electrical / plumbing capex.
Questions for the listing agent
- It's been on market 56 days. Have you received any prior offers? Is the seller open to a 3% concession, seller financing, or rate buy-down credit?
- Built in 1959 — when were the roof, HVAC, electrical panel, plumbing, and water heater last replaced?
- Is there a deadline driving the sale (1031 exchange, divorce, estate, relocation)? That informs how much negotiation room exists.
- Schools are F-rated, which usually means shorter tenancies and higher turnover. Who's the typical renter profile here, and what's been the actual vacancy rate?
- What's the average days-on-market for RENTAL listings here right now (not sales)? A rising rental-DOM trend means longer vacancies and softer asking-rent achievability than the comps imply.
- What's the recent tenant-quality profile in this submarket — average credit score on applications, eviction rate, late-payment / NSF rate, and stable-employment percentage? A property-management company in the area should have these aggregated.
- How much new for-sale + rental construction is in the pipeline within 1–3 miles? Heavy new supply typically softens prices + rents 12–24 months out; constrained supply supports both.
Investment metrics
- 1% rule
- 1.31% ✓
- Cap rate
- 10.97%
- Cash-on-cash
- 16.72%
- DSCR
- 1.74
- GRM
- 6.4
CMA / ARV
- ARV (on-the-fly)
- $75,123
- Comps found
- 7
Show comp detail 7 sales within ~0.75 mi
| Address | Dist | Beds/Ba | Sqft | Sold | Price | $/sf | Match |
|---|---|---|---|---|---|---|---|
| 1113 E Grant St | 0.00mi | 3/1.0 | 1,473 (0%) | 0mo | $75,000 | $51 | 100 |
| 730 E Sherman St | 0.32mi | 2/1.0 (-1) | 1,536 (+4%) | 6mo | $78,000 | $51 | 68 |
| 730 E Sherman St | 0.32mi | 2/1.0 (-1) | 1,536 (+4%) | 23mo | $17,200 | $11 | 54 |
| 510 E Grant St | 0.61mi | 4/1.0 (+1) | 1,656 (+12%) | 1mo | $47,000 | $28 | 44 |
| 700 N Horton St | 0.54mi | 3/1.0 | 1,296 (-12%) | 14mo | $72,900 | $56 | 43 |
| 518 E Marshall St | 0.61mi | 2/1.5 (-1) | 1,267 (-14%) | 6mo | $100,000 | $79 | 36 |
| 816 S Crossway Dr | 0.66mi | 3/2.0 | 1,661 (+13%) | 14mo | $275,000 | $166 | 32 |
Match score weights: distance 35% · size 25% · config 20% · recency 20%. Top-matched comps best support the ARV.
Projected returns pro-forma
-3.0% appreciation · 3.0% rent growth · sell at horizon
- IRR
- 7.9%
- Equity multiple
- 1.31×
- Total profit
- $7,773
- Equity at exit
- $13,419
- IRR
- 17.1%
- Equity multiple
- 2.41×
- Total profit
- $35,537
- Equity at exit
- $7,782
Cash invested: $25,200 (down + closing). Projections, not guarantees.
Landlord ↔ Tenant lean methodology
- Overall (STATE)
- 90 Strongly Landlord-Friendly
- State Indiana
- 90 Strongly Landlord-Friendly · R+11
- County
- — inherits STATE
- City
- — inherits STATE
ZIP-level market 46952
- Home prices YoY
- -29.9%
- Active inventory
- 126
- Price-to-rent
- 6.4×
Monthly cashflow live
- Estimated rent
- $1,181 medium interval (Pro) →
- Mortgage (P&I)
- −$472
- Tax from tax record
- −$72 /mo · $867/yr
- Insurance
- −$38
- HOA
- −$0
- Vacancy / Maint / Mgmt
- −$248
- Net cashflow
- $351
Break-even live
Sensitivity live
| Price | -10% $402 | -5% $377 | +0% $351 | +5% $326 | +10% $300 |
|---|---|---|---|---|---|
| Rent | -10% $258 | -5% $304 | +0% $351 | +5% $398 | +10% $444 |
| Rate | -1.0pp $396 | -0.5pp $374 | base $351 | +0.5pp $328 | +1.0pp $304 |
UW: 25.0% down · 7.5% · 30yr · 1.5% tax · 5.0% vac · 8.0% maint · 8.0% mgmt
Financing live
Cash to close
- Down payment
- $22,500
- Closing costs
- $2,700
- Reserves months
- —
- Total cash needed
- —
Loan-product check · same deal, 3 products live
Conventional
25% down · 7.5% · 30yr
- Down + closing
- —
- Monthly P&I
- —
- Monthly cashflow
- —
- DSCR
- —
- Eligible?
- —
Personal DTI + credit; lowest rate.
DSCR
20% down · 8.5% · 30yr
- Down + closing
- —
- Monthly P&I
- —
- Monthly cashflow
- —
- DSCR
- —
- Eligible?
- —
No personal income docs; deal must DSCR.
Hard money
10% down · 12.0% · 12mo
- Down + closing
- —
- Monthly P&I
- —
- Monthly cashflow
- —
- DSCR
- —
- Eligible?
- —
Short-term bridge; refi at stabilization.
Rent comps 1 comps
| Address | Beds | Baths | Sqft | Rent | $/sqft | DOM | Units | Dist |
|---|---|---|---|---|---|---|---|---|
| 715 E Sherman St Marion, IN | 2.0 | 1.0 | 1085 | $1,050 | $0.97 | 44d | 1 | 0.36mi |
Listing history 7 events
-
2026-04-23status Pending
-
2026-04-14price $90,000
-
2026-04-03price $92,500
-
2026-03-20price $95,000
-
2026-03-12price $105,000
-
2026-03-05price $110,000
-
2026-02-26$115,000 Active
ⓘ Source: listings_history table (triggers on properties + properties_extension) + one-shot
backfill from property_details.listing_events for pre-trigger history.
Tax reassessment forecast IN · Partial reset (capped growth)
- Current annual tax
- $867 · $72/mo
- Projected year-2 tax
- $867 · $72/mo
- Expected delta
- $0/yr ($0/mo · 0.0%)
ⓘ Screening estimate from a state-policy table — verify with the county assessor before closing.
Climate risk First Street
- Flood 1/10 Low FEMA zone X (unshaded) · 0% chance over 30 yrs
- Wildfire 1/10 Low
- Heat 3/10 Moderate 7 d/yr ≥100°F today · 18 d/yr by 30 yrs out
- Wind 2/10 Low
- Air quality 2/10 Low 1 unhealthy d/yr today · 2 by 30 yrs out
Nearby sold comps map
Loading sold comps map…
Walkable amenities ~0.75 mi
Loading nearby amenities…
Taxation est. · year 1
- Rental income
- $14,169
- − Mortgage interest
- −$5,041
- − Property taxes
- −$867
- − Insurance
- −$450
- − Repairs & maintenance
- −$1,134
- − Management
- −$1,134
- − Depreciation
- −$2,618
- Taxable income
- $2,926
- Est. tax owed @ 24.0%
- −$702
- After-tax cash flow
- $3,511/yr
For passive investors: Depreciation is non-cash, so a rental often shows a tax loss while cash-flowing — sheltering income. Rental losses are passive: they offset passive income freely, and up to $25,000/yr can offset ordinary (W-2) income if you actively participate and your MAGI is under $100k (phasing out to $0 by $150k); unused losses carry forward. On sale, claimed depreciation is recaptured at up to 25%, and gains may owe capital-gains tax (a 1031 exchange can defer both). Figures are a year-1 estimate at your 24.0% rate — not tax advice; consult a CPA.
Schools (NCES district)
- District
- Marion Community Schools
- NCES district ID
- 1806390
- Math proficiency
- 18% ▼ -9.00%
- Reading proficiency
- 24% ▼ -6.00%
- Median HH income
- $33,415
- Composite
- 17.13/100
- National rank
- #9115
- State rank
- #277 of 301 in IN
Livability — Marion
- Score
- 65/100
- State rank
- #337
- US rank
- #13006
Category grades
Schools grade is shown separately in the Schools card above.
Census & demographics
- Census place
- Marion, IN
- County
- Grant County · 41,561 people
- City population
- 41,561
- Metro
- Marion, IN
- Population (ZIP)
- 18,189
- Household income
- $52,880
- Rent vs Own
- Severe rent burden
- 662.0
Population outlook (Grant County) Hauer SSP2
- Today (2025)
- 64,394 people
- By 2030
- 62,145 · -3.5%
- By 2040
- 57,252 · -11.1%
- By 2050
- 52,968 · -17.7%
- By 2075
- 45,986 · -28.6%
- By 2100
- 39,400 · -38.8%
Race, ethnicity, and origin ACS 2023
- Neighborhood character
- Predominantly White (84%)
- Race & ethnicity
- White 84% Two or more races 7% Hispanic / Latino 5% Black 4% Asian 1%
- Hispanic origin (detail)
- Mexican 4%
- Common ancestry
- Italian 3% Romanian 1% Iranian 1%
- Foreign-born
- 4% · Canada
- Languages at home
- 96% English-only · Spanish 3%
Political lean MEDSL · Grant
- 2024 margin
- Solid R (+41.8) · D 28.2% · R 70.0% · Other 1.9%
- 2008→2024 swing
- -28.7pp toward R · 2008: -13.1pp · 2024: -41.8pp
- All cycles
- 2024: R+41.8 2020: R+38.8 2016: R+39.5 2012: R+22.0 2008: R+13.1
Not yet ingested
- Civics
- —
Market trends
- HPI YoY
- ▼ -76.69%
- Current HPI
- 180.1174
- Rent YoY
- —
- Metro
- Marion, IN
- State GDP YoY
- ▲ 2.90%
- F500 in state
- 18
Industry mix (Fortune 500 HQ in IN)
| Industry | F500 HQs | Revenue |
|---|---|---|
| Industrial Machinery | 2 | $37B |
|
||
| Healthcare | 1 | $177B |
|
||
| Pharmaceuticals | 1 | $45B |
|
||
| Metals / Steel | 1 | $18B |
|
||
| Agriculture | 1 | $17B |
|
||
| Packaging | 1 | $12B |
|
||
Price history
-21.7% since first listed7 events — show timeline
- 2026-04-23 Pending — IRMLS
- 2026-04-14 Price Changed $90,000 IRMLS
- 2026-04-03 Price Changed $92,500 IRMLS
- 2026-03-20 Price Changed $95,000 IRMLS
- 2026-03-12 Price Changed $105,000 IRMLS
- 2026-03-05 Price Changed $110,000 IRMLS
- 2026-02-26 Listed $115,000 IRMLS
Property tax history
+6.0%/yrLatest (2025): $867 · +16.0% YoY. Source: county tax records.
Cash-flow waterfall
monthlySold comps — $/sqft
last 12 mo · ≤1 miLoading sold comps…