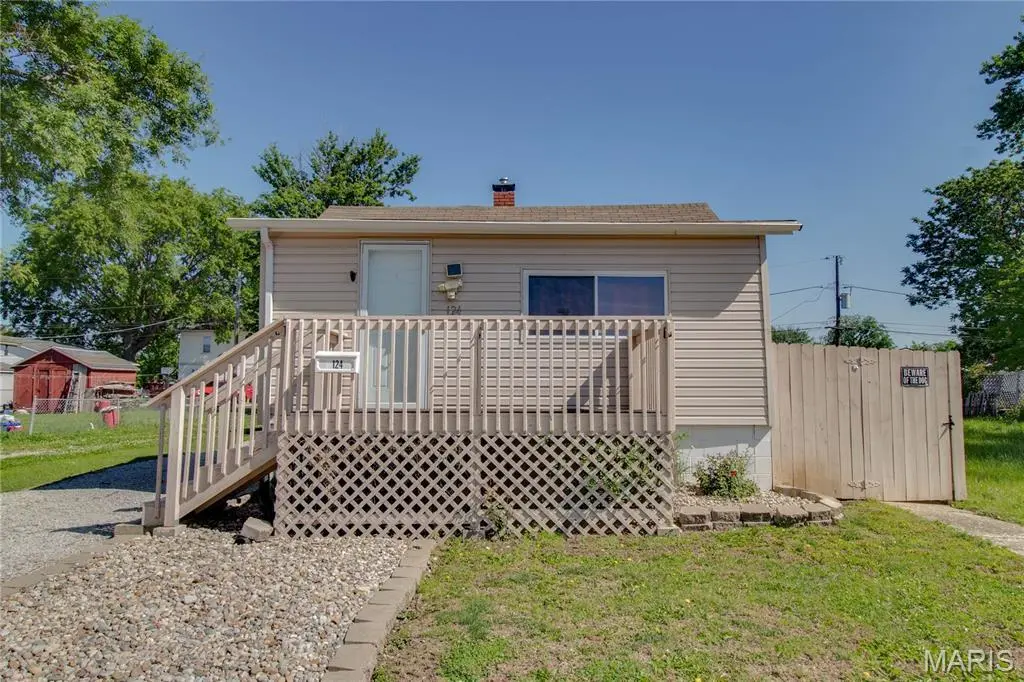
124 E 7th St · Roxana, IL
Flood risk 1/10 · Minimal
- FEMA flood zone
- X
- Chance of flooding over 30 yrs
- 0.0%
- Est. flood insurance / yr
- $507 – $1,088
Fire risk 1/10 · Minimal
- Est. fire insurance / yr
- $804 – $1,492
Heat risk 5/10 · Moderate
- Hot days now (above 107°F)
- 7 days/yr
- Hot days in 30 yrs
- 20 days/yr
Wind risk 2/10 · Minimal
- Chance of severe wind over 30 yrs
- 1.0%
Air-quality risk 4/10 · Minor
- Unhealthy air days now
- 5 days/yr
- Unhealthy air days in 30 yrs
- 6 days/yr
Risk factors via First Street. Map © Google.
Why this score? — see what drove the A- grade
The composite is a weighted blend of 9 inputs, each scored 0–100. Each bar is that input's sub-score; the figure is the points it added to the 100-point composite (weight × sub-score).
- Cash flow +30.0/30.0
- ARV discount +15.0/15.0
- 1% rule +10.0/10.0
- DSCR +10.0/10.0
- Appreciation +10.0/10.0
- Livability +3.1/5.0
- Rent growth +2.5/5.0
- Condition / age +2.5/5.0
- Schools +1.7/10.0
$44,900
🖨 Deal sheet 📄 Offer letter ✓ Due diligence
Listing remarks
Charming and affordable home! The main level features 1 bedroom plus a non-conforming second bedroom (no closet), ideal for a home office, guest space, or flex room, complete with a convenient washer hookup. Inside, you’ll find a comfortable living room, dining room, updated bathroom, and a welcoming foyer that leads to a sun porch—ideal for relaxing or enjoying your morning coffee. Step outside to a fully fenced yard with a storage shed and newer carport, offering space for pets, gardening, or outdoor entertaining. Plenty of room for storage in the unfinished basement. Major updates provide peace of mind, including siding, gutters, and soffit/fascia (2017), roof (2018), A/C (20
Key facts
- Sun porch
- Newer carport
- Storage shed
Tags
Property features AI
Exterior
- Parking: Has carport (1 space)
- Utilities: Public water; Public sewer; Ameren electric; Cable available
- Home design: Single-family residence; One level
- Construction: Vinyl siding
- Exterior features: Patio; Wood fence; Back yard; Shed(s)
Interior
- Kitchen: Range; Refrigerator
- Bedrooms: 1 bedroom on the main level
- Bathrooms: 1 full bathroom on the main level
- Heating & cooling: Forced air heating; Central air conditioning
- Interior features: Range, Refrigerator; Unfinished basement
- Laundry & utility: Main-level laundry room
Neighborhood map
What this means for you Summary
Snapshot
- This is a 2-bed/1.0-bath single-family listed at $45k.
Deal economics
- At list price, monthly cash flow is $303 ($4k/yr) — positive.
- The deal already cash-flows at list — no discount required.
- Meets the 1% rule at list price ($739 rent vs $45k).
- Recommended offer: $44k (3.0% below list) — sets the bar for market timing.
Location & tenants
- Location reads 62/100 on livability (#817 in IL) — a middle-class / working-renter tenant base. Strengths: crime A+, cost of living A+, housing A+; Watch: amenities F, commute F, health & safety F.
- Roxana CUSD 1 (suburban): math 18% / reading 19% proficiency, ranked #440 of 620 in IL (top 71%) — low school quality limits family demand, transient renter base, plan for 1-2y turnover.
- Zoned schools: Roxana Sr High School (math 12% / reading 12%, grade F, #511 of 693 statewide, top 75%, 515 students, 0% FRL) — zoned schools average 0% FRL vs 51% district-wide (51 pts lower); this property's tenant base skews higher-income than the district average.
- Market conditions: 4 active listings in the ZIP; 4 comparable units currently listed for rent nearby; rentals leasing fast (median 2d on market — plan ~1-2 weeks tenant-placement turnaround); 336 units permitted in Madison County in 2024 (0 in 5+ unit buildings).
Forward outlook
- In year one you build about $5k of equity ($310 loan paydown + $4k appreciation (10.0% local appreciation)).
- Madison County population projected at -18% by 2050 — secular population decline; favor cash flow + early exit over multi-decade hold.
- At projected returns (10.0% appreciation + 3.0% rent growth), your $13k cash investment doubles in ~2 years — after that, you're playing with house money.
- By year 7, paydown + projected appreciation supports a ~$35k cash-out refi (75% LTV) — recoverable capital for the next deal without selling this one.
Negotiation context
- It's been on market 40 days — a 3% lower offer ($44k) is reasonable based on typical stale-listing flexibility.
- 2 sale attempts; this cycle's ask has dropped $15k (25%) from the opening price — seller is motivated, your offer sets the floor, not the list.
- Current owner paid $22k; list at $45k implies a 104% gain — meaningful room to come down on a strong offer.
Risks & watch-outs
- Watch-outs: built in 1930 — expect roof / HVAC / electrical / plumbing capex.
- Climate carrying-cost: extreme-heat days projected 7→20/yr by 2055 (HVAC capex compounding) — expect insurance premiums to compound above CPI over the hold.
Questions for the listing agent
- It's been on market 40 days. Have you received any prior offers? Is the seller open to a 3% concession, seller financing, or rate buy-down credit?
- Built in 1930 — when were the roof, HVAC, electrical panel, plumbing, and water heater last replaced?
- Is there a deadline driving the sale (1031 exchange, divorce, estate, relocation)? That informs how much negotiation room exists.
- Schools are F-rated, which usually means shorter tenancies and higher turnover. Who's the typical renter profile here, and what's been the actual vacancy rate?
- What's the average days-on-market for RENTAL listings here right now (not sales)? A rising rental-DOM trend means longer vacancies and softer asking-rent achievability than the comps imply.
- What's the recent tenant-quality profile in this submarket — average credit score on applications, eviction rate, late-payment / NSF rate, and stable-employment percentage? A property-management company in the area should have these aggregated.
- How much new for-sale + rental construction is in the pipeline within 1–3 miles? Heavy new supply typically softens prices + rents 12–24 months out; constrained supply supports both.
Investment metrics
- 1% rule
- 1.65% ✓
- Cap rate
- 14.39%
- Cash-on-cash
- 28.90%
- DSCR
- 2.29
- GRM
- 5.1
CMA / ARV
- ARV (median comp)
- $78,405
- List price
- $44,900
- Delta
- -42.73%
- Verdict
- UNDERPRICED
- Comps
- 20 within 1.0 mi
Show comp detail 7 sales within ~0.75 mi
| Address | Dist | Beds/Ba | Sqft | Sold | Price | $/sf | Match |
|---|---|---|---|---|---|---|---|
| 145 E 6th St | 0.06mi | 2/1.0 | 925 (+7%) | 20mo | $84,900 | $92 | 69 |
| 142 E 3rd St | 0.24mi | 3/1.5 (+1) | 952 (+10%) | 7mo | $135,000 | $142 | 60 |
| 121 E 1st St | 0.32mi | 2/1.0 | 930 (+7%) | 20mo | $110,000 | $118 | 56 |
| 644 S 9th St | 0.70mi | 2/1.0 | 912 (+5%) | 17mo | $114,900 | $126 | 45 |
| 300 Clark St | 0.73mi | 2/1.0 | 816 (-6%) | 14mo | $82,000 | $100 | 44 |
| 215 Rohm Pl | 0.66mi | 2/1.0 | 816 (-6%) | 22mo | $119,900 | $147 | 41 |
| 330 W Thomas St | 0.70mi | 2/1.0 | 974 (+12%) | 10mo | $124,900 | $128 | 39 |
Match score weights: distance 35% · size 25% · config 20% · recency 20%. Top-matched comps best support the ARV.
Projected returns pro-forma
10.0% appreciation · 3.0% rent growth · sell at horizon
- IRR
- 46.2%
- Equity multiple
- 4.48×
- Total profit
- $43,733
- Equity at exit
- $40,449
- IRR
- 40.1%
- Equity multiple
- 10.04×
- Total profit
- $113,605
- Equity at exit
- $87,231
Cash invested: $12,572 (down + closing). Projections, not guarantees.
Landlord ↔ Tenant lean methodology
- Overall (STATE)
- 43 Moderately Tenant-Leaning
- State Illinois
- 43 Moderately Tenant-Leaning · D+7
- County
- — inherits STATE
- City
- — inherits STATE
ZIP-level market 62084
- Home prices YoY
- 24.7%
- Active inventory
- 4
- Price-to-rent
- 5.1×
Monthly cashflow live
- Estimated rent
- $739 medium interval (Pro) →
- Mortgage (P&I)
- −$235
- Tax from tax record
- −$27 /mo · $319/yr
- Insurance
- −$19
- HOA
- −$0
- Vacancy / Maint / Mgmt
- −$155
- Net cashflow
- $303
Break-even live
UW: 25.0% down · 7.5% · 30yr · 1.5% tax · 5.0% vac · 8.0% maint · 8.0% mgmt
Financing live
Cash to close
- Down payment
- $11,225
- Closing costs
- $1,347
- Reserves months
- —
- Total cash needed
- —
Loan-product check · same deal, 3 products live
Conventional
25% down · 7.5% · 30yr
- Down + closing
- —
- Monthly P&I
- —
- Monthly cashflow
- —
- DSCR
- —
- Eligible?
- —
Personal DTI + credit; lowest rate.
DSCR
20% down · 8.5% · 30yr
- Down + closing
- —
- Monthly P&I
- —
- Monthly cashflow
- —
- DSCR
- —
- Eligible?
- —
No personal income docs; deal must DSCR.
Hard money
10% down · 12.0% · 12mo
- Down + closing
- —
- Monthly P&I
- —
- Monthly cashflow
- —
- DSCR
- —
- Eligible?
- —
Short-term bridge; refi at stabilization.
Rent comps 4 comps
| Address | Beds | Baths | Sqft | Rent | $/sqft | DOM | Units | Dist |
|---|---|---|---|---|---|---|---|---|
| 103 W 1st St Unit C Roxana, IL | 1.0 | 1.0 | 700 | $650 | $0.93 | 1d | 1 | 0.33mi |
| 111 S Central Ave Roxana, IL | 1.0 | 1.0 | 600 | $650 | $1.08 | 1d | 1 | 0.37mi |
| 1905 Tyler Timmins Dr Unit 21 Wood River, IL | 3.0 | 1.0 | 960 | $1,100 | $1.15 | 1d | 1 | 1.32mi |
| 1905 Tyler Timmins Dr Apt 19 Wood River, IL | 2.0 | 1.5 | 1000 | $950 | $0.95 | 1d | 1 | 1.33mi |
Listing history 15 events
-
2026-06-13statusdays on market $44,900 Pending 40 DOM
-
2026-06-09pricedays on market $44,900 Active 39 DOM
-
2026-06-08days on market $49,900 Active 38 DOM
-
2026-06-07days on market $49,900 Active 37 DOM
-
2026-06-05days on market $49,900 Active 34 DOM
-
2026-06-03days on market $49,900 Active 33 DOM
-
2026-06-02days on market $49,900 Active 32 DOM
-
2026-06-01days on market $49,900 Active 31 DOM
-
2026-05-31days on market $49,900 Active 30 DOM
-
2026-05-14price $49,900 851-char remark
-
2026-05-01$59,900 Active 851-char remark
-
2026-02-03price $69,900
-
2025-11-26$79,900 Active
-
2000-12-29soldstatus $22,000
-
1991-06-06soldstatus $18,900
ⓘ Source: listings_history table (triggers on properties + properties_extension) + one-shot
backfill from property_details.listing_events for pre-trigger history.
Tax reassessment forecast IL · Partial reset (capped growth)
- Current annual tax
- $319 · $27/mo
- Projected year-2 tax
- $669 · $56/mo
- Expected delta
- +$350/yr (+$29/mo · 109.8%)
ⓘ Screening estimate from a state-policy table — verify with the county assessor before closing.
Climate risk First Street
- Flood 1/10 Low FEMA zone X · 0% chance over 30 yrs
- Wildfire 1/10 Low
- Heat 5/10 Major 7 d/yr ≥107°F today · 20 d/yr by 30 yrs out
- Wind 2/10 Low 100% chance of damaging wind over 30 yrs
- Air quality 4/10 Moderate 5 unhealthy d/yr today · 6 by 30 yrs out
Nearby sold comps map
Loading sold comps map…
Walkable amenities ~0.75 mi
Loading nearby amenities…
Taxation est. · year 1
- Rental income
- $8,864
- − Mortgage interest
- −$2,515
- − Property taxes
- −$319
- − Insurance
- −$224
- − Repairs & maintenance
- −$709
- − Management
- −$709
- − Depreciation
- −$1,306
- Taxable income
- $3,081
- Est. tax owed @ 24.0%
- −$739
- After-tax cash flow
- $2,894/yr
For passive investors: Depreciation is non-cash, so a rental often shows a tax loss while cash-flowing — sheltering income. Rental losses are passive: they offset passive income freely, and up to $25,000/yr can offset ordinary (W-2) income if you actively participate and your MAGI is under $100k (phasing out to $0 by $150k); unused losses carry forward. On sale, claimed depreciation is recaptured at up to 25%, and gains may owe capital-gains tax (a 1031 exchange can defer both). Figures are a year-1 estimate at your 24.0% rate — not tax advice; consult a CPA.
Schools (NCES district)
- District
- Roxana CUSD 1
- NCES district ID
- 1735010
- Math proficiency
- 18% ▼ -8.00%
- Reading proficiency
- 19% ▼ -11.00%
- Median HH income
- $50,661
- Composite
- 16.73/100
- National rank
- #9164
- State rank
- #440 of 620 in IL
Livability — Roxana
- Score
- 62/100
- State rank
- #817
- US rank
- #16133
Category grades
Schools grade is shown separately in the Schools card above.
Census & demographics
- Census place
- Roxana, IL
- City population
- 1,660
- Population (ZIP)
- 1,660
Population outlook (Madison County) Hauer SSP2
- Today (2025)
- 258,371 people
- By 2030
- 251,523 · -2.7%
- By 2040
- 233,640 · -9.6%
- By 2050
- 213,042 · -17.5%
- By 2075
- 165,255 · -36.0%
- By 2100
- 123,953 · -52.0%
Race, ethnicity, and origin ACS 2023
- Neighborhood character
- Predominantly White (97%)
- Race & ethnicity
- White 97% Black 1% Two or more races 1% Hispanic / Latino 1%
- Common ancestry
- Lithuanian 6% Romanian 2% Slovak 2%
- Foreign-born
- 0%
Political lean MEDSL · Madison
- 2024 margin
- R (+13.3) · D 42.5% · R 55.8% · Other 1.8%
- 2008→2024 swing
- -22.5pp toward R · 2008: 9.2pp · 2024: -13.3pp
- All cycles
- 2024: R+13.3 2020: R+13.2 2016: R+15.6 2012: R+1.4 2008: D+9.2
Not yet ingested
- Civics
- —
Market trends
- HPI YoY
- ▲ 41.51%
- Current HPI
- 209.6547
- Rent YoY
- —
- Metro
- —
- State GDP YoY
- ▲ 1.59%
- F500 in state
- 60
Industry mix (Fortune 500 HQ in IL)
| Industry | F500 HQs | Revenue |
|---|---|---|
| Insurance | 4 | $201B |
|
||
| Consumer Goods | 4 | $87B |
|
||
| Industrial Machinery | 3 | $64B |
|
||
| Healthcare | 2 | $55B |
|
||
| Retail / Pharmacy | 1 | $148B |
|
||
| Agriculture / Food | 1 | $86B |
|
||
Price history
+137.6% since first listed8 events — show timeline
- 2026-06-10 Pending — MARIS as Distributed by MLS Grid
- 2026-06-09 Price Changed $44,900 MARIS as Distributed by MLS Grid
- 2026-05-14 Price Changed $49,900 MARIS as Distributed by MLS Grid
- 2026-05-01 Listed $59,900 MARIS as Distributed by MLS Grid
- 2026-02-03 Price Changed $69,900 MARIS as Distributed by MLS Grid
- 2025-11-26 Listed $79,900 MARIS as Distributed by MLS Grid
- 2000-12-29 Sold (Public Records) $22,000 Public Records
- 1991-06-06 Sold (Public Records) $18,900 Public Records
Property tax history
-6.4%/yrLatest (2024): $319 · -0.2% YoY. Source: county tax records.
Cash-flow waterfall
monthlySold comps — $/sqft
last 12 mo · ≤1 miLoading sold comps…