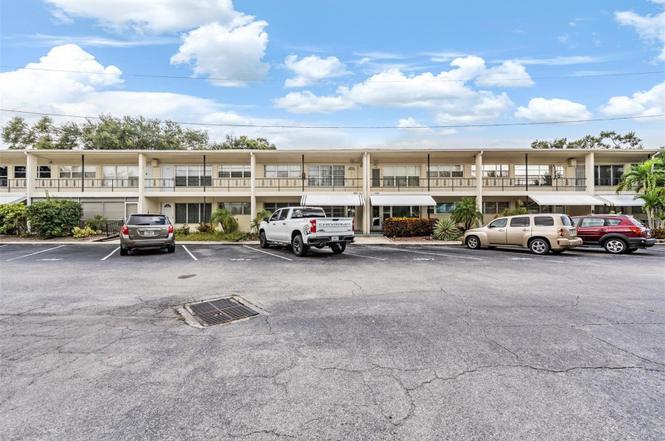
5665 40th Ave N #407 · Kenneth City, FL
Flood risk 1/10 · Minimal
- FEMA flood zone
- X (unshaded)
- Chance of flooding over 30 yrs
- 0.0%
- Est. flood insurance / yr
- $507 – $1,088
Fire risk 1/10 · Minimal
- Est. fire insurance / yr
- $947 – $1,759
Heat risk 10/10 · Severe
- Hot days now (above 106°F)
- 7 days/yr
- Hot days in 30 yrs
- 25 days/yr
Wind risk 10/10 · Severe
- Chance of severe wind over 30 yrs
- 99.0%
Air-quality risk 4/10 · Minor
- Unhealthy air days now
- 4 days/yr
- Unhealthy air days in 30 yrs
- 4 days/yr
Risk factors via First Street. Map © Google.
Why this score? — see what drove the B- grade
The composite is a weighted blend of 9 inputs, each scored 0–100. Each bar is that input's sub-score; the figure is the points it added to the 100-point composite (weight × sub-score).
- Cash flow +25.9/30.0
- 1% rule +10.0/10.0
- DSCR +8.7/10.0
- ARV discount +7.5/15.0
- Schools +4.3/10.0
- Livability +4.2/5.0
- Rent growth +2.7/5.0
- Condition / age +2.5/5.0
- Appreciation +0.0/10.0
$105,000
🖨 Deal sheet 📄 Offer letter ✓ Due diligence
Listing remarks
Welcome to Clearview Oaks! Discover this beautifully maintained 2-bedroom, 1-bath, second-floor condo in one of St. Pete’s most charming 55+ communities. This move-in-ready home offers comfort, convenience, and peace of mind — located in Flood Zone X (no flood insurance required) and sitting 20 feet above sea level in Evacuation Zone E. Step inside to a bright, inviting space with laminate flooring throughout — no carpet anywhere! The open living and dining areas flow together seamlessly, perfect for relaxing or entertaining guests. The kitchen is compact yet efficient, featuring plenty of cabinet space and a sliding doors to the screened balcony where washer and dryer ar
Key facts
- Pond view
- Screened balcony
- Community storage
Tags
Property features AI
Finance
- Other: Homestead exemption applied
- Financial info: Total monthly fees $511; total annual fees $6,132; Lease restrictions apply
- HOA & community: Monthly condo fee $511 (includes cable TV, internet, insurance, common area taxes, escrow reserves, structure and grounds maintenance, private road, sewer, trash, water); Association name: Kelly Vickers; Community features include clubhouse, community mailbox, street lights, deed restrictions, buyer approval required; Senior community; Pets allowed (maximum weight 25 lbs)
Exterior
- Parking: Unassigned/unnumbered parking (park in an unmarked/unassigned spot)
- Utilities: Public water; Public sewer; Electricity available and connected; Cable available and connected; Water connected
- Home design: Condominium; Residential property; One story (single level); Faces northwest; Located on 2nd floor
- Construction: Block and stucco construction; Other roof type; Slab foundation; Building/complex includes unit number 5665
- Exterior features: Rear porch (screened); Balcony; Rain gutters; Near public transit; Trees/landscaped
Interior
- Kitchen: Range; Microwave; Refrigerator; Electric water heater
- Bedrooms: 2 bedrooms
- Flooring: Laminate flooring
- Bathrooms: 1 full bathroom
- Heating & cooling: Central heating (electric); Central air conditioning
- Interior features: Ceiling fans; Open concept living/dining (living room/dining room combo); Blinds on windows
- Laundry & utility: Washer and Dryer inside unit; Inside utility/Great Room area
Neighborhood map
What this means for you Summary
Snapshot
- This is a 2-bed/1.0-bath condo listed at $105k.
Deal economics
- At list price, monthly cash flow is $259 ($3k/yr) — positive.
- The deal already cash-flows at list — no discount required.
- Meets the 1% rule at list price ($2k rent vs $105k).
- Recommended offer: $92k (12.0% below list) — sets the bar for market timing.
- Cap rate 9.3% vs local median 6.7% in Kenneth City — top-decile yield for the area; either an underpriced asset or a hidden risk that comps aren't pricing in. Stress-test before assuming the spread holds.
Location & tenants
- Location reads 83/100 on livability (#47 in FL, #874 nationally) — a professional / high-income tenant draw. Strengths: commute A+, cost of living A+, housing A+; Watch: schools C-, amenities D.
- Pinellas (suburban): math 51% / reading 51% proficiency, ranked #31 of 73 in FL (top 42%) — acceptable for families but not a draw, mixed tenant base, ~2y average lease.
- Market conditions: Rents flat; 309 active listings in the ZIP; 37 comparable units currently listed for rent nearby; rentals at typical pace (median 15d on market — plan ~3-4 weeks tenant-placement turnaround); 2,676 units permitted in Pinellas County in 2024 (1,422 in 5+ unit buildings).
- This rent runs 41% of the median local income ($54k/yr) — at the standard rent-burdened threshold; future hikes will face affordability resistance.
Forward outlook
- Local home prices are declining (-3.0%/yr); year-one equity from $726 of loan paydown is wiped out by about $3k of value loss. Plan a longer hold.
- Pinellas County population projected at +14% by 2050 — modest demand growth; plan on rents tracking national, not racing it.
Negotiation context
- It's been on market 244 days — a 12% lower offer ($92k) is reasonable based on typical stale-listing flexibility.
- 6 sale attempts since 20y ago; this cycle's ask has dropped $14k (12%) from the opening price — seller is motivated, your offer sets the floor, not the list.
- Current owner paid $20k; list at $105k implies a 425% gain — meaningful room to come down on a strong offer.
Risks & watch-outs
- Watch-outs: HOA is 28% of rent.
- Climate carrying-cost: severe wind risk, 99% chance of damaging wind over 30y; extreme-heat days projected 7→25/yr by 2055 (HVAC capex compounding) — expect insurance premiums to compound above CPI over the hold.
Questions for the listing agent
- It's been on market 244 days. Have you received any prior offers? Is the seller open to a 12% concession, seller financing, or rate buy-down credit?
- Built in 1963 — when were the roof, HVAC, electrical panel, plumbing, and water heater last replaced?
- What does the HOA fee cover, when was the last increase, and are there any pending special assessments or reserve-fund shortfalls?
- Any open or pending special assessments — roof, HVAC, plumbing, elevator, façade? What's the per-unit balance and payoff schedule, and is the seller paying it off at close or rolling it to the buyer?
- Why hasn't it sold? Are there any deal-killer items the seller is aware of (foundation, flood, title, zoning, code violations)?
- Is there a deadline driving the sale (1031 exchange, divorce, estate, relocation)? That informs how much negotiation room exists.
- What's the average days-on-market for RENTAL listings here right now (not sales)? A rising rental-DOM trend means longer vacancies and softer asking-rent achievability than the comps imply.
- What's the recent tenant-quality profile in this submarket — average credit score on applications, eviction rate, late-payment / NSF rate, and stable-employment percentage? A property-management company in the area should have these aggregated.
- How much new apartment / multifamily construction is in the pipeline within 1–3 miles? Heavy new supply (>2% of stock underway) typically softens rents 12–24 months out; light construction supports rent growth.
Investment metrics
- 1% rule
- 1.72% ✓
- Cap rate
- 9.25%
- Cash-on-cash
- 10.58%
- DSCR
- 1.47
- GRM
- 4.8
CMA / ARV
No comps found within radius.
Projected returns pro-forma
-3.0% appreciation · 0.99% rent growth · sell at horizon
- IRR
- -3.5%
- Equity multiple
- 0.87×
- Total profit
- $-3,801
- Equity at exit
- $15,656
- IRR
- 2.7%
- Equity multiple
- 1.17×
- Total profit
- $5,016
- Equity at exit
- $9,078
Cash invested: $29,400 (down + closing). Projections, not guarantees.
Landlord ↔ Tenant lean methodology
- Overall (STATE)
- 87 Strongly Landlord-Friendly
- State Florida
- 87 Strongly Landlord-Friendly · R+3
- County
- — inherits STATE
- City
- — inherits STATE
ZIP-level market 33709
- Rents YoY
- 1.0%
- Active inventory
- 309
- Price-to-rent
- 4.8×
Monthly cashflow live
- Estimated rent
- $1,810 high interval (Pro) →
- Mortgage (P&I)
- −$551
- Tax from tax record
- −$66 /mo · $789/yr
- Insurance
- −$44
- HOA
- −$511
- Vacancy / Maint / Mgmt
- −$380
- Net cashflow
- $259
Break-even live
UW: 25.0% down · 7.5% · 30yr · 1.5% tax · 5.0% vac · 8.0% maint · 8.0% mgmt
Financing live
Cash to close
- Down payment
- $26,250
- Closing costs
- $3,150
- Reserves months
- —
- Total cash needed
- —
Loan-product check · same deal, 3 products live
Conventional
25% down · 7.5% · 30yr
- Down + closing
- —
- Monthly P&I
- —
- Monthly cashflow
- —
- DSCR
- —
- Eligible?
- —
Personal DTI + credit; lowest rate.
DSCR
20% down · 8.5% · 30yr
- Down + closing
- —
- Monthly P&I
- —
- Monthly cashflow
- —
- DSCR
- —
- Eligible?
- —
No personal income docs; deal must DSCR.
Hard money
10% down · 12.0% · 12mo
- Down + closing
- —
- Monthly P&I
- —
- Monthly cashflow
- —
- DSCR
- —
- Eligible?
- —
Short-term bridge; refi at stabilization.
Rent comps 37 comps
| Address | Beds | Baths | Sqft | Rent | $/sqft | DOM | Units | Dist |
|---|---|---|---|---|---|---|---|---|
| 4000 58th St N Kenneth City, FL | 2.0 | 1.0 | 900 | $1,649 | $1.83 | 14d | 4 | 0.10mi |
| 5870 38th Ave N #40 Saint Petersburg, FL | 2.0 | 1.0 | 985 | $1,800 | $1.83 | 16d | 1 | 0.26mi |
| 6190 36th Ave N Saint Petersburg, FL | 2.0 | 1.0 | 1008 | $2,500 | $2.48 | 4d | 1 | 0.66mi |
| 5323 59th Cir W Kenneth City, FL | 1.0–2.0 | 1.0 | 800 | $1,375 | $1.72 | 3d | 4 | 0.83mi |
| 2819 53rd St N Saint Petersburg, FL | 2.0 | 1.0 | 900 | $1,995 | $2.22 | 4d | 1 | 0.85mi |
| 3980 64th St N Saint Petersburg, FL | 1.0–2.0 | 1.0–2.0 | 707 | $1,500 | $2.12 | 3d | 6 | 0.87mi |
| 5457 59th St N Unit NA St. Petersburg, FL | 2.0 | 1.0 | 800 | $2,400 | $3.00 | 24d | 1 | 0.90mi |
| 5255 62nd St N Kenneth City, FL | 1.0–3.0 | 1.0–2.0 | 1000 | $1,538 | $1.54 | 2d | 2 | 0.92mi |
| 6423 34th Ter N Saint Petersburg, FL | 3.0 | 1.0 | 900 | $2,200 | $2.44 | 4d | 1 | 0.92mi |
| 5540 59th St N Saint Petersburg, FL | 2.0 | 1.0 | 824 | $2,100 | $2.55 | 4d | 1 | 0.97mi |
| 6538 42nd Ave N Unit 7 Kenneth City, FL | 2.0 | 1.0 | 648 | $2,000 | $3.09 | 24d | 1 | 1.02mi |
| 5870 56th Ave N Kenneth City, FL | 2.0 | 1.0–2.0 | 850 | $1,595 | $1.88 | 3d | 7 | 1.03mi |
| 3910 44th St N Unit C9 Saint Petersburg, FL | 2.0 | 1.0 | 965 | $1,395 | $1.45 | 14d | 1 | 1.10mi |
| 3556 66th St N St. Petersburg, FL | 1.0 | 1.0 | 610 | $1,300 | $2.13 | 14d | 1 | 1.15mi |
| 5701 21st Ave N Saint Petersburg, FL | 1.0–2.0 | 1.0 | 775 | $1,899 | $2.45 | 7d | 3 | 1.21mi |
| 6522 54th Ave N Saint Petersburg, FL | 1.0–3.0 | 1.0–2.0 | 892 | $1,600 | $1.79 | 1d | 10 | 1.22mi |
| 5860 22nd Ave N Apt 5 St. Petersburg, FL | 2.0 | 1.0 | 800 | $1,300 | $1.62 | 24d | 1 | 1.22mi |
| 5900 22nd Ave N Saint Petersburg, FL | 3.0 | 1.0 | 1100 | $1,950 | $1.77 | 4d | 1 | 1.22mi |
| 5900 22nd Ave N Unit 14 St. Petersburg, FL | 2.0 | 1.0 | 1000 | $1,650 | $1.65 | 14d | 1 | 1.22mi |
| 5900 22nd Ave N Unit 1 St. Petersburg, FL | 3.0 | 2.0 | 1100 | $1,999 | $1.82 | 17d | 1 | 1.22mi |
| 2176 Winchester Rd N #2 Saint Petersburg, FL | 3.0 | 2.0 | 1080 | $2,250 | $2.08 | 14d | 1 | 1.24mi |
| 6215 58th Ave N Saint Petersburg, FL | 2.0 | 1.0 | 850 | $1,900 | $2.24 | 4d | 1 | 1.25mi |
| 6524 54th Ave N Unit 2 St. Petersburg, FL | 2.0 | 1.0 | 840 | $1,360 | $1.62 | 24d | 1 | 1.26mi |
| 6080 22nd Ave N #5 Saint Petersburg, FL | 2.0 | 2.0 | 890 | $1,725 | $1.94 | 24d | 1 | 1.28mi |
| 6080 22nd Ave N #3 Saint Petersburg, FL | 2.0 | 2.0 | 890 | $1,825 | $2.05 | 24d | 1 | 1.28mi |
| 6080 22nd Ave N #3 Saint Petersburg, FL | 2.0 | 2.0 | 900 | $1,825 | $2.03 | 4d | 1 | 1.28mi |
| 4082 38th Ave N Saint Petersburg, FL | 2.0 | 1.0 | 775 | $2,400 | $3.10 | 4d | 1 | 1.33mi |
| 5541 Lown St N Apt S St. Petersburg, FL | 2.0 | 1.0 | 850 | $1,600 | $1.88 | 7d | 1 | 1.35mi |
| 4701 68th St N Saint Petersburg, FL | 1.0 | 1.0 | 700 | $1,099 | $1.57 | 24d | 1 | 1.37mi |
| 2871 67th St N Saint Petersburg, FL | 3.0 | 1.0 | 1075 | $2,500 | $2.33 | 24d | 1 | 1.39mi |
| 4390 68th St N Saint Petersburg, FL | 3.0 | 1.0 | 864 | $1,950 | $2.26 | 24d | 1 | 1.41mi |
| 6801 48th Ave N Unit B St. Petersburg, FL | 1.0 | 1.0 | 650 | $1,525 | $2.35 | 24d | 1 | 1.42mi |
| 4083 30th Ave N Saint Petersburg, FL | 2.0 | 1.0 | 924 | $1,750 | $1.89 | 17d | 1 | 1.48mi |
| 4719 21st Ave N Saint Petersburg, FL | 2.0 | 1.0 | 672 | $1,800 | $2.68 | 24d | 1 | 1.48mi |
| 4711 Sunnydale Ln N Unit A St. Petersburg, FL | 2.0 | 1.0 | 800 | $1,750 | $2.19 | 24d | 1 | 1.49mi |
| 3947 Mohr Ave N Unit 1 St. Petersburg, FL | 2.0 | 1.0 | 767 | $1,450 | $1.89 | 14d | 1 | 1.49mi |
| 5136 68th St N Unit C St. Petersburg, FL | 2.0 | 1.0 | 957 | $1,700 | $1.78 | 4d | 1 | 1.49mi |
HOA detail condo
- Monthly dues
- $511 · $6,132/yr
- Assessments
- None detected in remarks — confirm with the listing agent.
Listing history 23 events
-
2026-06-18days on market $105,000 Active 244 DOM
-
2026-06-17days on market $105,000 Active 243 DOM
-
2026-06-16days on market $105,000 Active 242 DOM
-
2026-06-15days on market $105,000 Active 241 DOM
-
2026-06-13days on market $105,000 Active 239 DOM
-
2026-06-09days on market $105,000 Active 235 DOM
-
2026-06-08days on market $105,000 Active 234 DOM
-
2026-06-07days on market $105,000 Active 233 DOM
-
2026-06-04days on market $105,000 Active 230 DOM
-
2026-06-03days on market $105,000 Active 229 DOM
-
2026-06-01days on market $105,000 Active 227 DOM
-
2026-05-31days on market $105,000 Active 226 DOM
-
2026-04-14price $105,000
-
2025-10-17$119,000 Active
-
2017-12-10historical
-
2017-11-02status Active
-
2017-10-08status Pending
-
2017-06-28price $59,500
-
2017-06-13$63,000 Active
-
2007-10-03$86,000
-
2006-11-27$106,900
-
2006-03-17$124,900
-
1999-09-17soldstatus $20,000
ⓘ Source: listings_history table (triggers on properties + properties_extension) + one-shot
backfill from property_details.listing_events for pre-trigger history.
Tax reassessment forecast FL · Resets to sale price
- Current annual tax
- $789 · $66/mo
- Projected year-2 tax
- $872 · $73/mo
- Expected delta
- +$83/yr (+$7/mo · 10.5%)
ⓘ Screening estimate from a state-policy table — verify with the county assessor before closing.
Climate risk First Street
- Flood 1/10 Low FEMA zone X (unshaded) · 0% chance over 30 yrs
- Wildfire 1/10 Low
- Heat 10/10 Extreme 7 d/yr ≥106°F today · 25 d/yr by 30 yrs out
- Wind 10/10 Extreme 99% chance of damaging wind over 30 yrs
- Air quality 4/10 Moderate 4 unhealthy d/yr today · 4 by 30 yrs out
Nearby sold comps map
Loading sold comps map…
Walkable amenities ~0.75 mi
Loading nearby amenities…
Taxation est. · year 1
- Rental income
- $21,725
- − Mortgage interest
- −$5,882
- − Property taxes
- −$789
- − Insurance
- −$525
- − Repairs & maintenance
- −$1,738
- − Management
- −$1,738
- − HOA
- −$6,132
- − Depreciation
- −$3,055
- Taxable income
- $1,867
- Est. tax owed @ 24.0%
- −$448
- After-tax cash flow
- $2,661/yr
For passive investors: Depreciation is non-cash, so a rental often shows a tax loss while cash-flowing — sheltering income. Rental losses are passive: they offset passive income freely, and up to $25,000/yr can offset ordinary (W-2) income if you actively participate and your MAGI is under $100k (phasing out to $0 by $150k); unused losses carry forward. On sale, claimed depreciation is recaptured at up to 25%, and gains may owe capital-gains tax (a 1031 exchange can defer both). Figures are a year-1 estimate at your 24.0% rate — not tax advice; consult a CPA.
Schools (NCES district)
- District
- Pinellas
- NCES district ID
- 1201560
- Math proficiency
- 51% ▼ -5.00%
- Reading proficiency
- 51% ▼ -3.00%
- Median HH income
- $46,270
- Composite
- 43.27/100
- National rank
- #3046
- State rank
- #31 of 73 in FL
Livability — Kenneth City
- Score
- 83/100
- State rank
- #47
- US rank
- #874
Category grades
Schools grade is shown separately in the Schools card above.
Census & demographics
- Census place
- Kenneth City, FL
- County
- Pinellas County · 939,478 people
- Metro
- Tampa-St. Petersburg-Clearwater, FL
- Population (ZIP)
- 25,050
- Household income
- $53,501
- Rent vs Own
- Severe rent burden
- 712.0
Population outlook (Pinellas County) Hauer SSP2
- Today (2025)
- 1,027,532 people
- By 2030
- 1,063,586 · +3.5%
- By 2040
- 1,125,020 · +9.5%
- By 2050
- 1,168,637 · +13.7%
- By 2075
- 1,265,188 · +23.1%
- By 2100
- 1,260,357 · +22.7%
Race, ethnicity, and origin ACS 2023
- Neighborhood character
- Predominantly White (73%)
- Race & ethnicity
- White 73% Hispanic / Latino 11% Two or more races 10% Black 5% Asian 5%
- Hispanic origin (detail)
- Mexican 2% Puerto Rican 3% Cuban 2% Dominican 1%
- Common ancestry
- Lithuanian 3% Romanian 3% Slovak 2%
- Foreign-born
- 14% · Canada, Vietnam, Jamaica
- Languages at home
- 84% English-only · Spanish 9% Other Indo-European 2% Vietnamese 2%
Political lean MEDSL · Pinellas
- 2024 margin
- Lean R (+5.2) · D 46.9% · R 52.1%
- 2008→2024 swing
- -13.5pp toward R · 2008: 8.3pp · 2024: -5.2pp
- All cycles
- 2024: R+5.2 2020: D+0.2 2016: R+1.1 2012: D+5.6 2008: D+8.3
Not yet ingested
- Civics
- —
Market trends
- HPI YoY
- ▼ -416.74%
- Current HPI
- 391.368
- Rent YoY
- ▲ 0.99%
- Metro
- Tampa-St. Petersburg-Clearwater, FL
- State GDP YoY
- ▲ 3.28%
- F500 in state
- 36
Industry mix (Fortune 500 HQ in FL)
| Industry | F500 HQs | Revenue |
|---|---|---|
| Industrial Technology | 2 | $29B |
|
||
| Insurance | 2 | $17B |
|
||
| Retail | 1 | $60B |
|
||
| Technology Distribution | 1 | $58B |
|
||
| Homebuilding | 1 | $35B |
|
||
| Technology Manufacturing | 1 | $35B |
|
||
Price history
+425.0% since first listed11 events — show timeline
- 2026-04-14 Price Changed $105,000 Stellar MLS as Distributed by MLS Grid
- 2025-10-17 Listed $119,000 Stellar MLS as Distributed by MLS Grid
- 2017-12-10 Listing Removed — Stellar MLS as Distributed by MLS Grid
- 2017-11-02 Relisted — Stellar MLS as Distributed by MLS Grid
- 2017-10-08 Pending — Stellar MLS as Distributed by MLS Grid
- 2017-06-28 Price Changed $59,500 Stellar MLS as Distributed by MLS Grid
- 2017-06-13 Listed $63,000 Stellar MLS as Distributed by MLS Grid
- 2007-10-03 Listed $86,000 Stellar MLS as Distributed by MLS Grid
- 2006-11-27 Listed $106,900 Stellar MLS as Distributed by MLS Grid
- 2006-03-17 Listed $124,900 Stellar MLS as Distributed by MLS Grid
- 1999-09-17 Sold (Public Records) $20,000 Public Records
Property tax history
+4.2%/yrLatest (2025): $789 · +2.1% YoY. Source: county tax records.
Cash-flow waterfall
monthlySold comps — $/sqft
last 12 mo · ≤1 miLoading sold comps…