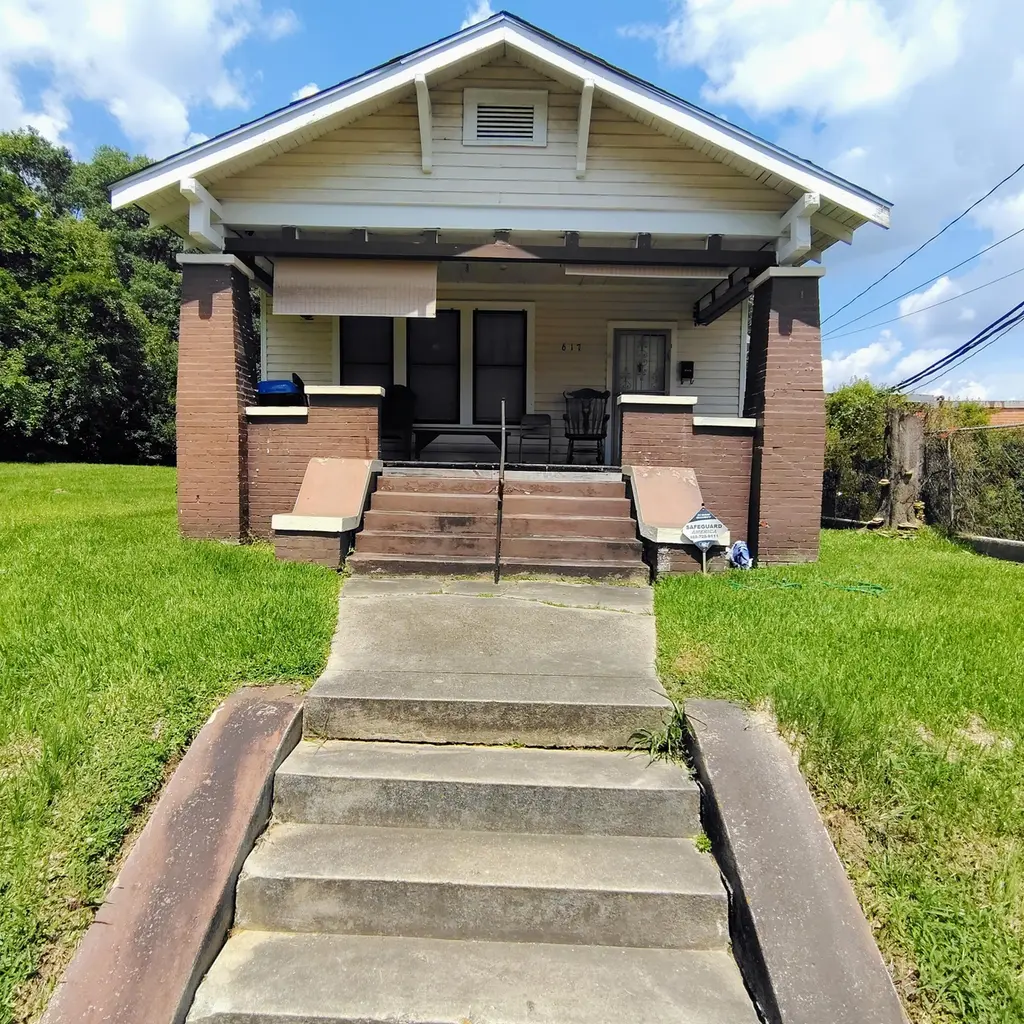
617 Edgar St · McComb, MS
Flood risk 1/10 · Minimal
- FEMA flood zone
- X (unshaded)
- Chance of flooding over 30 yrs
- 0.0%
- Est. flood insurance / yr
- $507 – $1,088
Fire risk 4/10 · Minor
- Est. fire insurance / yr
- $1,241 – $2,305
Heat risk 8/10 · Major
- Hot days now (above 109°F)
- 7 days/yr
- Hot days in 30 yrs
- 22 days/yr
Wind risk 8/10 · Major
- Chance of severe wind over 30 yrs
- 99.0%
Air-quality risk 1/10 · Minimal
- Unhealthy air days now
- 0 days/yr
- Unhealthy air days in 30 yrs
- 0 days/yr
Risk factors via First Street. Map © Google.
Why this score? — see what drove the D grade
The composite is a weighted blend of 9 inputs, each scored 0–100. Each bar is that input's sub-score; the figure is the points it added to the 100-point composite (weight × sub-score).
- Cash flow +22.7/30.0
- DSCR +7.3/10.0
- 1% rule +5.0/10.0
- Livability +3.5/5.0
- Rent growth +2.5/5.0
- Condition / age +2.5/5.0
- Schools +1.2/10.0
- ARV discount +0.0/15.0
- Appreciation +0.0/10.0
$100,000
🖨 Deal sheet 📄 Offer letter ✓ Due diligence
Listing remarks
This 3 bedroom 2 bath home has so much to offer this could be a investment for a investor with great potential on income. This home can be for a first time homebuyer that want to put there own touches on the home. The home still need some repairs to it. The home is sitting on 0.45 acre lot with 2 more extra lots that is attach to the home. There is a portable building on the property that go with property.
Key facts
- 0.45 acre lot
- Portable building
- Extra lots
Tags
Property features AI
Exterior
- Parking: No designated parking
- Utilities: Public sewer
- Home design: Single-family residence; One level; Corner lot
- Construction: Wood siding
- Exterior features: Covered front porch
Interior
- Flooring: Vinyl; Laminate; Carpet
- Bathrooms: Two full bathrooms
- Heating & cooling: Window units for cooling; Gas heating
- Interior features: Ceiling fan(s)
- Laundry & utility: Laundry area in kitchen
Neighborhood map
What this means for you Summary
Snapshot
- This is a 3-bed/2.0-bath single-family listed at $100k.
Deal economics
- At list price, monthly cash flow is $173 ($2k/yr) — positive.
- The deal already cash-flows at list — no discount required.
- To meet the 1% rule (rent ≥ 1% of price), the offer needs to be $100k (0.4% below list).
- Recommended offer: $98k (1.5% below list) — sets the bar for market timing.
- Cap rate 8.4% vs local median 6.5% in McComb — meaningfully above typical; check what's discounted (condition, days-on-market, listing class) to confirm the premium yield is real.
Location & tenants
- Location reads 69/100 on livability (#50 in MS) — a middle-class / working-renter tenant base. Strengths: cost of living A+, health & safety A+, housing A-; Watch: schools D-, amenities F, commute F.
- Mccomb School District (town): math 15% / reading 16% proficiency, ranked #106 of 130 in MS (top 82%) — low school quality limits family demand, transient renter base, plan for 1-2y turnover; 93% free/reduced lunch — lower-income household profile, screen leases tightly.
- Market conditions: 190 active listings in the ZIP; 3 comparable units currently listed for rent nearby; rentals lingering (median 44d on market — plan ~5-8 weeks vacancy on turnover, expect pricing pressure); 100% of comp listings sitting > 30 days — soft ceiling on asking rent; 10 units permitted in Pike County in 2024 (0 in 5+ unit buildings).
Forward outlook
- Local home prices are declining (-3.0%/yr); year-one equity from $691 of loan paydown is wiped out by about $3k of value loss. Plan a longer hold.
- Pike County population projected at -14% by 2050 — secular population decline; favor cash flow + early exit over multi-decade hold.
Negotiation context
- It's been on market 17 days — a 2% lower offer ($98k) is reasonable based on typical stale-listing flexibility.
- 2 sale attempts since 2y ago with the ask held roughly flat each time — persistent listings suggest the price (not the market) is what's stuck; bring a comps-based counter.
Risks & watch-outs
- Watch-outs: built in 1954 — expect roof / HVAC / electrical / plumbing capex.
- Climate carrying-cost: severe wind risk, 99% chance of damaging wind over 30y; extreme-heat days projected 7→22/yr by 2055 (HVAC capex compounding) — expect insurance premiums to compound above CPI over the hold.
Questions for the listing agent
- Built in 1954 — when were the roof, HVAC, electrical panel, plumbing, and water heater last replaced?
- Is there a deadline driving the sale (1031 exchange, divorce, estate, relocation)? That informs how much negotiation room exists.
- Schools are D-rated, which usually means shorter tenancies and higher turnover. Who's the typical renter profile here, and what's been the actual vacancy rate?
- The area grade is low — what's the realistic commute time and amenity access for the typical tenant pool here? Any planned neighborhood developments (good or bad) we should know about?
- What's the average days-on-market for RENTAL listings here right now (not sales)? A rising rental-DOM trend means longer vacancies and softer asking-rent achievability than the comps imply.
- What's the recent tenant-quality profile in this submarket — average credit score on applications, eviction rate, late-payment / NSF rate, and stable-employment percentage? A property-management company in the area should have these aggregated.
- How much new for-sale + rental construction is in the pipeline within 1–3 miles? Heavy new supply typically softens prices + rents 12–24 months out; constrained supply supports both.
Investment metrics
- 1% rule
- 1.00% ✗
- Cap rate
- 8.36%
- Cash-on-cash
- 7.39%
- DSCR
- 1.33
- GRM
- 8.4
CMA / ARV
- ARV (on-the-fly)
- $84,360
- Comps found
- 12
Show comp detail 12 sales within ~0.75 mi
| Address | Dist | Beds/Ba | Sqft | Sold | Price | $/sf | Match |
|---|---|---|---|---|---|---|---|
| 618 Edgar St | 0.03mi | 3/2.0 | 1,448 (-2%) | 16mo | $60,000 | $41 | 81 |
| 319 S 4th St | 0.41mi | 3/2.0 | 1,422 (-4%) | 8mo | $119,900 | $84 | 68 |
| 703 Pennsylvania Ave | 0.49mi | 2/1.0 (-1) | 1,432 (-3%) | 0mo | $81,500 | $57 | 62 |
| 908 Venable St | 0.39mi | 3/2.0 | 1,511 (+2%) | 20mo | $48,500 | $32 | 62 |
| 630 Virginia | 0.57mi | 3/1.0 | 1,442 (-3%) | 12mo | $109,999 | $76 | 55 |
| 707 Earl St | 0.42mi | 3/1.0 | 1,290 (-13%) | 2mo | $59,500 | $46 | 53 |
| 622 S Sixth St | 0.60mi | 2/1.5 (-1) | 1,513 (+2%) | 11mo | $74,000 | $49 | 52 |
| 407 7th St | 0.67mi | 3/1.0 | 1,323 (-11%) | 4mo | $49,900 | $38 | 44 |
| 904 Lasalle | 0.24mi | 2/2.0 (-1) | 1,260 (-15%) | 20mo | $25,000 | $20 | 42 |
| 917 College | 0.67mi | 3/1.0 | 1,420 (-4%) | 21mo | $121,000 | $85 | 40 |
| 726 Virginia Ave | 0.64mi | 3/2.0 | 1,616 (+9%) | 21mo | $149,500 | $93 | 38 |
| 612 25th St | 0.55mi | 4/2.0 (+1) | 1,280 (-14%) | 13mo | $82,500 | $64 | 36 |
Match score weights: distance 35% · size 25% · config 20% · recency 20%. Top-matched comps best support the ARV.
Projected returns pro-forma
-3.0% appreciation · 3.0% rent growth · sell at horizon
- IRR
- -5.0%
- Equity multiple
- 0.81×
- Total profit
- $-5,248
- Equity at exit
- $14,910
- IRR
- 4.6%
- Equity multiple
- 1.34×
- Total profit
- $9,448
- Equity at exit
- $8,646
Cash invested: $28,000 (down + closing). Projections, not guarantees.
Landlord ↔ Tenant lean methodology
- Overall (STATE)
- 90 Strongly Landlord-Friendly
- State Mississippi
- 90 Strongly Landlord-Friendly · R+11
- County
- — inherits STATE
- City
- — inherits STATE
ZIP-level market 39648
- Active inventory
- 190
- Price-to-rent
- 8.4×
Monthly cashflow live
- Estimated rent
- $996 medium interval (Pro) →
- Mortgage (P&I)
- −$524
- Tax from tax record
- −$48 /mo · $578/yr
- Insurance
- −$42
- HOA
- −$0
- Vacancy / Maint / Mgmt
- −$209
- Net cashflow
- $173
Break-even live
UW: 25.0% down · 7.5% · 30yr · 1.5% tax · 5.0% vac · 8.0% maint · 8.0% mgmt
Financing live
Cash to close
- Down payment
- $25,000
- Closing costs
- $3,000
- Reserves months
- —
- Total cash needed
- —
Loan-product check · same deal, 3 products live
Conventional
25% down · 7.5% · 30yr
- Down + closing
- —
- Monthly P&I
- —
- Monthly cashflow
- —
- DSCR
- —
- Eligible?
- —
Personal DTI + credit; lowest rate.
DSCR
20% down · 8.5% · 30yr
- Down + closing
- —
- Monthly P&I
- —
- Monthly cashflow
- —
- DSCR
- —
- Eligible?
- —
No personal income docs; deal must DSCR.
Hard money
10% down · 12.0% · 12mo
- Down + closing
- —
- Monthly P&I
- —
- Monthly cashflow
- —
- DSCR
- —
- Eligible?
- —
Short-term bridge; refi at stabilization.
Rent comps 3 comps
| Address | Beds | Baths | Sqft | Rent | $/sqft | DOM | Units | Dist |
|---|---|---|---|---|---|---|---|---|
| 919 25th St McComb, MS | 3.0 | 3.0 | 1107 | $595 | $0.54 | 43d | 1 | 0.89mi |
| 238 Westview Cir McComb, MS | 3.0 | 2.0 | 1574 | $1,300 | $0.83 | 43d | 1 | 1.07mi |
| 1210 Parklane Rd McComb, MS | 1.0–2.0 | 1.0–2.0 | 844 | $1,171 | $1.39 | 43d | 5 | 1.46mi |
Listing history 13 events
-
2026-06-18days on market $100,000 Active 17 DOM
-
2026-06-17days on market $100,000 Active 16 DOM
-
2026-06-16days on market $100,000 Active 15 DOM
-
2026-06-15days on market $100,000 Active 14 DOM
-
2026-06-13days on market $100,000 Active 12 DOM
-
2026-06-12days on market $100,000 Active 11 DOM
-
2026-06-09days on market $100,000 Active 8 DOM
-
2026-06-08days on market $100,000 Active 7 DOM
-
2026-06-07days on market $100,000 Active 6 DOM
-
2026-06-07days on market $100,000 Active 5 DOM
-
2026-06-04days on market $100,000 Active 2 DOM
-
2026-06-02remarks 409-char remark
-
2026-06-02$100,000 Active 1 DOM
ⓘ Source: listings_history table (triggers on properties + properties_extension) + one-shot
backfill from property_details.listing_events for pre-trigger history.
Tax reassessment forecast MS · Resets to sale price
- Current annual tax
- $578 · $48/mo
- Projected year-2 tax
- $790 · $66/mo
- Expected delta
- +$213/yr (+$18/mo · 36.8%)
ⓘ Screening estimate from a state-policy table — verify with the county assessor before closing.
Climate risk First Street
- Flood 1/10 Low FEMA zone X (unshaded) · 0% chance over 30 yrs
- Wildfire 4/10 Moderate
- Heat 8/10 Severe 7 d/yr ≥109°F today · 22 d/yr by 30 yrs out
- Wind 8/10 Severe 99% chance of damaging wind over 30 yrs
- Air quality 1/10 Low 0 unhealthy d/yr today · 0 by 30 yrs out
Nearby sold comps map
Loading sold comps map…
Walkable amenities ~0.75 mi
Loading nearby amenities…
Taxation est. · year 1
- Rental income
- $11,950
- − Mortgage interest
- −$5,602
- − Property taxes
- −$578
- − Insurance
- −$500
- − Repairs & maintenance
- −$956
- − Management
- −$956
- − Depreciation
- −$2,909
- Taxable income
- $450
- Est. tax owed @ 24.0%
- −$108
- After-tax cash flow
- $1,962/yr
For passive investors: Depreciation is non-cash, so a rental often shows a tax loss while cash-flowing — sheltering income. Rental losses are passive: they offset passive income freely, and up to $25,000/yr can offset ordinary (W-2) income if you actively participate and your MAGI is under $100k (phasing out to $0 by $150k); unused losses carry forward. On sale, claimed depreciation is recaptured at up to 25%, and gains may owe capital-gains tax (a 1031 exchange can defer both). Figures are a year-1 estimate at your 24.0% rate — not tax advice; consult a CPA.
Schools (NCES district)
- District
- Mccomb School District
- NCES district ID
- 2802880
- Math proficiency
- 15% ▼ -20.00%
- Reading proficiency
- 16% ▼ -5.00%
- Median HH income
- $29,855
- Composite
- 12.26/100
- National rank
- #9645
- State rank
- #106 of 130 in MS
Livability — McComb
- Score
- 69/100
- State rank
- #50
- US rank
- #8347
Category grades
Schools grade is shown separately in the Schools card above.
Census & demographics
- Census place
- McComb, MS
- Population (ZIP)
- 19,767
Population outlook (Pike County) Hauer SSP2
- Today (2025)
- 38,766 people
- By 2030
- 37,874 · -2.3%
- By 2040
- 35,743 · -7.8%
- By 2050
- 33,276 · -14.2%
- By 2075
- 26,799 · -30.9%
- By 2100
- 18,562 · -52.1%
Race, ethnicity, and origin ACS 2023
- Neighborhood character
- Majority Black (64%)
- Race & ethnicity
- Black 64% White 32% Two or more races 2% Hispanic / Latino 2%
- Common ancestry
- Slovak 2% Lithuanian 1% Italian 1%
- Foreign-born
- 1%
- Languages at home
- 98% English-only · Spanish 1%
Political lean MEDSL · Pike
- 2024 margin
- Toss-up / Even · D 47.8% · R 51.3%
- 2008→2024 swing
- -7.0pp toward R · 2008: 3.5pp · 2024: -3.5pp
- All cycles
- 2024: R+3.5 2020: D+1.0 2016: R+0.7 2012: D+7.6 2008: D+3.5
Not yet ingested
- Civics
- —
Market trends
- HPI YoY
- ▼ -88.61%
- Current HPI
- 92.2495
- Rent YoY
- —
- Metro
- —
- State GDP YoY
- —
- F500 in state
- 0
Price history
+53.8% since first listed5 events — show timeline
- 2026-06-01 Listed $100,000 HAAR
- 2025-12-17 Listing Removed — MLSU
- 2024-10-16 Listed $65,000 MLSU
- 2009-11-13 Sold (Public Records) — Public Records
- 2005-04-01 Sold (Public Records) — Public Records
Property tax history
+6.4%/yrLatest (2025): $578 · +11.6% YoY. Source: county tax records.
Cash-flow waterfall
monthlySold comps — $/sqft
last 12 mo · ≤1 miLoading sold comps…