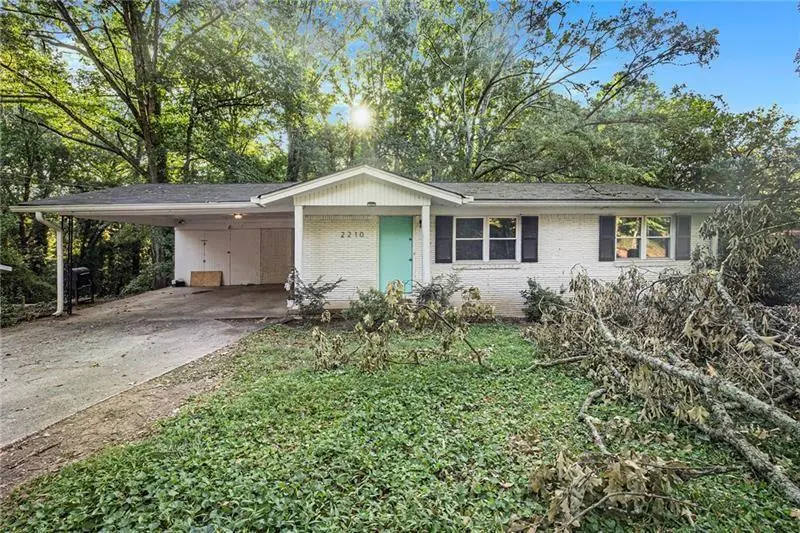
2210 Rhinehill Rd SE · Atlanta, GA
Flood risk 1/10 · Minimal
- FEMA flood zone
- X (unshaded)
- Chance of flooding over 30 yrs
- 0.0%
- Est. flood insurance / yr
- $473 – $860
Fire risk 2/10 · Minimal
- Est. fire insurance / yr
- $963 – $1,789
Heat risk 5/10 · Moderate
- Hot days now (above 105°F)
- 7 days/yr
- Hot days in 30 yrs
- 17 days/yr
Wind risk 5/10 · Moderate
- Chance of severe wind over 30 yrs
- 25.0%
Air-quality risk 4/10 · Minor
- Unhealthy air days now
- 4 days/yr
- Unhealthy air days in 30 yrs
- 6 days/yr
Risk factors via First Street. Map © Google.
Why this score? — see what drove the D grade
The composite is a weighted blend of 9 inputs, each scored 0–100. Each bar is that input's sub-score; the figure is the points it added to the 100-point composite (weight × sub-score).
- ARV discount +15.0/15.0
- Cash flow +8.9/30.0
- Livability +4.2/5.0
- 1% rule +3.5/10.0
- Rent growth +3.3/5.0
- Schools +2.7/10.0
- DSCR +2.5/10.0
- Condition / age +2.5/5.0
- Appreciation +0.0/10.0
$237,000
🖨 Deal sheet 📄 Offer letter ✓ Due diligence
Listing remarks MLS
**SHORTSALE***. Approved shortsale, appraised April 2025 for $265,000. Perfect Airbnb Investment Opportunity! This renovated 3-bed, 3-bath Brick Ranch, updated in 2020, is ideally located near the airport, making it a prime choice for short-term rentals. Inside, enjoy new flooring, an open kitchen with stainless steel appliances and marble countertops, and a serene master suite with a spa-style bathroom. The unfinished basement, already framed, offers the potential to add two more bedrooms, expanding your investment. With a spacious backyard, two-car carport, and proximity to The BeltLine, Grant Park, and more, this property is a fantastic blend of comfort and potential!
Key facts
- Marble countertops
- Spa-style bathroom
- Serene master suite
Tags
Neighborhood map
What this means for you Summary
Snapshot
- This is a 3-bed/3.0-bath single-family listed at $237k.
Deal economics
- At list price, monthly cash flow is $-192 ($-2k/yr) — negative.
- To cash-flow at today's rent, offer at most $203k (14.3% below list).
- To meet the 1% rule (rent ≥ 1% of price), the offer needs to be $201k (15.3% below list).
- Recommended offer: $201k (15.3% below list) — sets the bar for 1% rule.
- Cap rate 5.3% vs local median 3.1% in Atlanta — top-decile yield for the area; either an underpriced asset or a hidden risk that comps aren't pricing in. Stress-test before assuming the spread holds.
Location & tenants
- Location reads 83/100 on livability (#6 in GA, #919 nationally) — a professional / high-income tenant draw. Strengths: amenities A+, commute A+, housing A+; Watch: schools C-, cost of living C-.
- Atlanta Public Schools (urban): math 28% / reading 35% proficiency, ranked #80 of 174 in GA (top 46%) — families likely to look elsewhere, expect single-tenant / working-renter base with shorter leases; 71% free/reduced lunch — lower-income household profile, screen leases tightly.
- Market conditions: Rents rising (+3.2%/yr); 378 active listings in the ZIP; 40 comparable units currently listed for rent nearby; rentals at typical pace (median 22d on market — plan ~3-4 weeks tenant-placement turnaround); 11,565 units permitted in Fulton County in 2024 (8,159 in 5+ unit buildings).
- At $2,008/mo this rent would consume 47% of the median local household income ($51k/yr) (locally 2962% of renters already pay >50% of income on rent) — very limited rent-growth headroom before tenants either downsize or default.
Forward outlook
- Local home prices are declining (-3.0%/yr); year-one equity from $2k of loan paydown is wiped out by about $7k of value loss. Plan a longer hold.
- Fulton County population projected at +38% by 2050 — long-run rental-demand tailwind backs the buy-and-hold thesis.
Negotiation context
- It's been on market 221 days — a 12% lower offer ($209k) is reasonable based on typical stale-listing flexibility.
- 24 sale attempts since 8y ago with the ask held roughly flat each time — persistent listings suggest the price (not the market) is what's stuck; bring a comps-based counter.
Risks & watch-outs
- Climate carrying-cost: moderate wind risk, 25% chance of damaging wind over 30y; extreme-heat days projected 7→17/yr by 2055 (HVAC capex compounding) — expect insurance premiums to compound above CPI over the hold.
Questions for the listing agent
- What do current leases actually rent for vs. the listed asking? Can we see a recent rent roll and the last 12 months of T-12 income?
- It's been on market 221 days. Have you received any prior offers? Is the seller open to a 15% concession, seller financing, or rate buy-down credit?
- Built in 1960 — when were the roof, HVAC, electrical panel, plumbing, and water heater last replaced?
- Why hasn't it sold? Are there any deal-killer items the seller is aware of (foundation, flood, title, zoning, code violations)?
- Is there a deadline driving the sale (1031 exchange, divorce, estate, relocation)? That informs how much negotiation room exists.
- The area grade is low — what's the realistic commute time and amenity access for the typical tenant pool here? Any planned neighborhood developments (good or bad) we should know about?
- What's the average days-on-market for RENTAL listings here right now (not sales)? A rising rental-DOM trend means longer vacancies and softer asking-rent achievability than the comps imply.
- What's the recent tenant-quality profile in this submarket — average credit score on applications, eviction rate, late-payment / NSF rate, and stable-employment percentage? A property-management company in the area should have these aggregated.
- How much new for-sale + rental construction is in the pipeline within 1–3 miles? Heavy new supply typically softens prices + rents 12–24 months out; constrained supply supports both.
Investment metrics
- 1% rule
- 0.85% ✗
- Cap rate
- 5.32%
- Cash-on-cash
- -3.47%
- DSCR
- 0.85
- GRM
- 9.8
CMA / ARV
- ARV (median comp)
- $290,440
- List price
- $237,000
- Delta
- -18.40%
- Verdict
- UNDERPRICED
- Comps
- 20 within 1.0 mi
Show comp detail 12 sales within ~0.75 mi
| Address | Dist | Beds/Ba | Sqft | Sold | Price | $/sf | Match |
|---|---|---|---|---|---|---|---|
| 2126 Jernigan Dr | 0.42mi | 4/2.0 (+1) | 1,700 (+1%) | 7mo | $295,000 | $174 | 64 |
| 1924 Browns Mill Rd SE | 0.56mi | 3/2.0 | 1,750 (+4%) | 11mo | $315,000 | $180 | 53 |
| 1812 Lakewood Ave SE | 0.73mi | 3/2.5 | 1,664 (-1%) | 11mo | $240,000 | $144 | 53 |
| 290 Bromack Dr SE | 0.36mi | 4/2.5 (+1) | 1,512 (-10%) | 9mo | $313,000 | $207 | 52 |
| 1885 Lakewood Ave SE | 0.71mi | 3/2.5 | 1,564 (-7%) | 2mo | $150,000 | $96 | 52 |
| 2187 Baywood Dr SE | 0.60mi | 3/2.5 | 1,867 (+11%) | 0mo | $315,000 | $169 | 51 |
| 2509 Browns Mill Rd SE | 0.57mi | 4/2.0 (+1) | 1,620 (-4%) | 12mo | $250,000 | $154 | 48 |
| 117 Hillsdale Dr | 0.62mi | 3/2.0 | 1,560 (-7%) | 12mo | $325,000 | $208 | 45 |
| 353 Troy St SE | 0.52mi | 3/2.0 | 1,500 (-11%) | 14mo | $370,000 | $247 | 42 |
| 16 Bromack Dr SE | 0.61mi | 4/1.5 (+1) | 1,775 (+6%) | 12mo | $192,000 | $108 | 41 |
| 121 Hillsdale Dr SE | 0.62mi | 3/1.5 | 1,489 (-11%) | 12mo | $205,000 | $138 | 37 |
| 2368 Jernigan Pl SE | 0.52mi | 3/1.0 | 1,466 (-13%) | 14mo | $151,000 | $103 | 35 |
Match score weights: distance 35% · size 25% · config 20% · recency 20%. Top-matched comps best support the ARV.
Projected returns pro-forma
-3.0% appreciation · 3.23% rent growth · sell at horizon
- IRR
- -21.8%
- Equity multiple
- 0.25×
- Total profit
- $-50,058
- Equity at exit
- $35,337
- IRR
- -14.9%
- Equity multiple
- 0.14×
- Total profit
- $-56,951
- Equity at exit
- $20,491
Cash invested: $66,360 (down + closing). Projections, not guarantees.
Landlord ↔ Tenant lean methodology
- Overall (STATE)
- 90 Strongly Landlord-Friendly
- State Georgia
- 90 Strongly Landlord-Friendly · R+3
- County
- — inherits STATE
- City
- — inherits STATE
ZIP-level market 30315
- Rents YoY
- 3.2%
- Active inventory
- 378
- Price-to-rent
- 9.8×
Monthly cashflow live
- Estimated rent
- $2,008 high interval (Pro) →
- Mortgage (P&I)
- −$1,243
- Tax from tax record
- −$437 /mo · $5,241/yr
- Insurance
- −$99
- HOA
- −$0
- Vacancy / Maint / Mgmt
- −$422
- Net cashflow
- $-192
Break-even live
UW: 25.0% down · 7.5% · 30yr · 1.5% tax · 5.0% vac · 8.0% maint · 8.0% mgmt
Financing live
Cash to close
- Down payment
- $59,250
- Closing costs
- $7,110
- Reserves months
- —
- Total cash needed
- —
Loan-product check · same deal, 3 products live
Conventional
25% down · 7.5% · 30yr
- Down + closing
- —
- Monthly P&I
- —
- Monthly cashflow
- —
- DSCR
- —
- Eligible?
- —
Personal DTI + credit; lowest rate.
DSCR
20% down · 8.5% · 30yr
- Down + closing
- —
- Monthly P&I
- —
- Monthly cashflow
- —
- DSCR
- —
- Eligible?
- —
No personal income docs; deal must DSCR.
Hard money
10% down · 12.0% · 12mo
- Down + closing
- —
- Monthly P&I
- —
- Monthly cashflow
- —
- DSCR
- —
- Eligible?
- —
Short-term bridge; refi at stabilization.
Rent comps 40 comps
| Address | Beds | Baths | Sqft | Rent | $/sqft | DOM | Units | Dist |
|---|---|---|---|---|---|---|---|---|
| 76 Schell Rd SE Atlanta, GA | 3.0 | 1.0 | 1080 | $1,623 | $1.50 | 24d | 1 | 0.18mi |
| 172 Meador Way SE Atlanta, GA | 3.0 | 2.0 | 1100 | $1,950 | $1.77 | 24d | 1 | 0.35mi |
| 2087 Lakewood Trl SE Atlanta, GA | 3.0 | 2.5 | 1056 | $2,256 | $2.14 | 24d | 1 | 0.39mi |
| 2153 Burroughs Ave SE Atlanta, GA | 3.0 | 2.0 | 2212 | $1,650 | $0.75 | 22d | 1 | 0.44mi |
| 340 Adelle St SE Atlanta, GA | 3.0 | 1.0 | 1122 | $1,500 | $1.34 | 3d | 1 | 0.49mi |
| 2332 Baywood Dr SE Atlanta, GA | 3.0 | 2.0 | 1100 | $1,400 | $1.27 | 18d | 1 | 0.49mi |
| 136 Hillsdale Dr SE Atlanta, GA | 3.0 | 2.0 | 1075 | $1,995 | $1.86 | 24d | 1 | 0.57mi |
| 349 Laquita Dr SE Atlanta, GA | 3.0 | 2.5 | 1587 | $1,850 | $1.17 | 19d | 1 | 0.59mi |
| 293 Jordan St SE Atlanta, GA | 3.0 | 2.5 | 1637 | $2,500 | $1.53 | 24d | 1 | 0.64mi |
| 2145 Macon Dr SW Atlanta, GA | 3.0 | 1.0 | 1059 | $1,450 | $1.37 | 24d | 1 | 0.64mi |
| 1875 Conrad Ave SE Atlanta, GA | 3.0 | 2.0 | 1088 | $1,803 | $1.66 | 22d | 1 | 0.64mi |
| 585 McWilliams Rd SE #104 Atlanta, GA | 2.0 | 3.0 | 1500 | $2,078 | $1.39 | 20d | 1 | 0.67mi |
| 1845 Lakewood Ter SE Atlanta, GA | 3.0 | 2.0 | 1859 | $1,850 | $1.00 | 13d | 1 | 0.68mi |
| 73 Polar Rock Rd SW Atlanta, GA | 3.0 | 1.0 | 1098 | $1,850 | $1.68 | 10d | 1 | 0.71mi |
| 585 McWilliams Rd SE #2402 Atlanta, GA | 2.0 | 2.5 | 1548 | $2,200 | $1.42 | 3d | 1 | 0.71mi |
| 585 McWilliams Rd SE #1406 Atlanta, GA | 3.0 | 2.5 | 1742 | $2,400 | $1.38 | 24d | 1 | 0.76mi |
| 9 Gould St SE Atlanta, GA | 3.0 | 2.0 | 1800 | $2,000 | $1.11 | 24d | 1 | 0.85mi |
| 1770 Richmond Cir SE Unit 1000E Atlanta, GA | 2.0 | 2.0 | 1200 | $1,365 | $1.14 | 24d | 1 | 0.87mi |
| 1770 Richmond Cir SE Unit 500F Atlanta, GA | 2.0 | 2.0 | 1200 | $1,750 | $1.46 | 24d | 1 | 0.87mi |
| 2694 Fairlane Dr SE Atlanta, GA | 4.0 | 2.0 | 1372 | $2,800 | $2.04 | 24d | 1 | 0.88mi |
| 1754 Richmond Cir SE Atlanta, GA | 2.0 | 2.0 | 1200 | $1,750 | $1.46 | 8d | 2 | 0.94mi |
| 1114 Oak Knoll Ter SE Atlanta, GA | 4.0 | 2.0 | 1525 | $2,800 | $1.84 | 24d | 1 | 0.99mi |
| 445 Cleveland Ave SE Atlanta, GA | 2.0–3.0 | 1.0–2.0 | 1014 | $1,591 | $1.57 | 2d | 13 | 1.00mi |
| 1569 Jonesboro Rd SE Atlanta, GA | 4.0 | 2.0 | 1680 | $2,400 | $1.43 | 19d | 1 | 1.12mi |
| 1569 Jonesboro Rd SE Atlanta, GA | 4.0 | 2.0 | 1680 | $2,400 | $1.43 | 17d | 1 | 1.12mi |
| 2019 Pryor Rd SW Atlanta, GA | 2.0 | 2.5 | 1449 | $2,600 | $1.79 | 24d | 1 | 1.22mi |
| 250 Amal Dr SW #7009 Atlanta, GA | 3.0 | 2.5 | 1440 | $1,850 | $1.28 | 8d | 1 | 1.24mi |
| 41 Meldon Ave SE Atlanta, GA | 4.0 | 1.5 | 1323 | $1,495 | $1.13 | 17d | 1 | 1.25mi |
| 976 McKay Dr SE Atlanta, GA | 3.0 | 1.0 | 1200 | $1,695 | $1.41 | 3d | 1 | 1.28mi |
| 2745 Old Hapeville Rd SW Atlanta, GA | 2.0–3.0 | 2.0 | 1007 | $1,375 | $1.36 | 15d | 1 | 1.28mi |
| 2786 Old Hapeville Rd SW Atlanta, GA | 2.0 | 1.5 | 1050 | $1,150 | $1.10 | 24d | 1 | 1.30mi |
| 245 Amal Dr SW #3004 Atlanta, GA | 2.0 | 2.0 | 1402 | $1,800 | $1.28 | 22d | 1 | 1.30mi |
| 64 Moury Ave SE Atlanta, GA | 4.0 | 3.5 | 1877 | $2,699 | $1.44 | 24d | 1 | 1.33mi |
| 1515 Jonesboro Rd SE Atlanta, GA | 3.0 | 2.0 | 1360 | $2,300 | $1.69 | 13d | 1 | 1.33mi |
| 1037 Rebel Forest Dr SE Atlanta, GA | 3.0 | 2.0 | 1075 | $1,750 | $1.63 | 24d | 1 | 1.33mi |
| 2007 Turner Rd SE Atlanta, GA | 3.0 | 2.0 | 2000 | $2,399 | $1.20 | 15d | 1 | 1.38mi |
| 117 Brown Ave SE Atlanta, GA | 4.0 | 2.5 | 1632 | $1,945 | $1.19 | 14d | 1 | 1.39mi |
| 309 Pickfair Way SW Atlanta, GA | 3.0 | 2.5 | 1824 | $2,423 | $1.33 | 24d | 1 | 1.42mi |
| 91 Thirkield Ave SE Atlanta, GA | 2.0 | 1.0 | 1092 | $1,995 | $1.83 | 24d | 1 | 1.45mi |
| 95 Thirkield Ave SE Atlanta, GA | 3.0 | 2.0 | 1096 | $1,850 | $1.69 | 16d | 1 | 1.45mi |
Listing history 50 events
-
2025-10-21$237,000 New 679-char remark
Show marketing remark (679 chars)
**SHORTSALE***. Approved shortsale, appraised April 2025 for $265,000. Perfect Airbnb Investment Opportunity! This renovated 3-bed, 3-bath Brick Ranch, updated in 2020, is ideally located near the airport, making it a prime choice for short-term rentals. Inside, enjoy new flooring, an open kitchen with stainless steel appliances and marble countertops, and a serene master suite with a spa-style bathroom. The unfinished basement, already framed, offers the potential to add two more bedrooms, expanding your investment. With a spacious backyard, two-car carport, and proximity to The BeltLine, Grant Park, and more, this property is a fantastic blend of comfort and potential!
-
2025-10-21$237,000 Active 679-char remark
Show marketing remark (679 chars)
**SHORTSALE***. Approved shortsale, appraised April 2025 for $265,000. Perfect Airbnb Investment Opportunity! This renovated 3-bed, 3-bath Brick Ranch, updated in 2020, is ideally located near the airport, making it a prime choice for short-term rentals. Inside, enjoy new flooring, an open kitchen with stainless steel appliances and marble countertops, and a serene master suite with a spa-style bathroom. The unfinished basement, already framed, offers the potential to add two more bedrooms, expanding your investment. With a spacious backyard, two-car carport, and proximity to The BeltLine, Grant Park, and more, this property is a fantastic blend of comfort and potential!
-
2025-10-21historical
Show marketing remark (679 chars)
**SHORTSALE***. Approved shortsale, appraised April 2025 for $265,000. Perfect Airbnb Investment Opportunity! This renovated 3-bed, 3-bath Brick Ranch, updated in 2020, is ideally located near the airport, making it a prime choice for short-term rentals. Inside, enjoy new flooring, an open kitchen with stainless steel appliances and marble countertops, and a serene master suite with a spa-style bathroom. The unfinished basement, already framed, offers the potential to add two more bedrooms, expanding your investment. With a spacious backyard, two-car carport, and proximity to The BeltLine, Grant Park, and more, this property is a fantastic blend of comfort and potential!
-
2025-09-02price $238,000
-
2025-09-02price $238,000
-
2025-05-27price $245,000
-
2025-05-27price $245,000
-
2025-05-14status Active
-
2025-05-14status Back On Market
-
2025-04-24status Pending
-
2025-03-31status Under Contract
-
2025-03-31historical Active Under Contract
-
2025-03-25status Back On Market
-
2025-03-25status Active
-
2025-03-18status Under Contract
-
2025-03-18historical Active Under Contract
-
2025-01-23price $220,000
-
2025-01-23price $220,000
-
2025-01-22status Back On Market
-
2025-01-22status Active
-
2025-01-11status Under Contract
-
2025-01-11historical Active Under Contract
-
2024-10-23$250,000 New
-
2024-10-23$250,000 Active
-
2024-10-23historical
-
2024-10-23historical
-
2024-09-09$305,000 Active
-
2024-09-09$305,000 New
-
2021-01-07soldstatus $230,000
-
2020-12-18soldstatus $230,000 Closed
-
2020-12-18soldstatus $230,000 Sold
-
2020-11-17status Pending
-
2020-11-11historical Active Under Contract
-
2020-11-06status Under Contract
-
2020-10-08$230,000 Active
-
2020-10-08$230,000 New
-
2020-07-01historical
-
2020-06-30historical
-
2020-05-22price $212,999
-
2020-03-11$215,000 Active
-
2020-03-11$212,999 Active
-
2019-09-03soldstatus $108,000
-
2019-08-27soldstatus $108,000 Closed
-
2019-08-27soldstatus $108,000 Sold
-
2019-07-12status Under Contract
-
2019-07-12status Pending
-
2019-07-04status Back on Market
-
2019-07-04status Active
-
2019-06-21status Under Contract
ⓘ Source: listings_history table (triggers on properties + properties_extension) + one-shot
backfill from property_details.listing_events for pre-trigger history.
Tax reassessment forecast GA · Resets to sale price
- Current annual tax
- $5,241 · $437/mo
- Projected year-2 tax
- $5,241 · $437/mo
- Expected delta
- $0/yr ($0/mo · 0.0%)
ⓘ Screening estimate from a state-policy table — verify with the county assessor before closing.
Climate risk First Street
- Flood 1/10 Low FEMA zone X (unshaded) · 0% chance over 30 yrs
- Wildfire 2/10 Low
- Heat 5/10 Major 7 d/yr ≥105°F today · 17 d/yr by 30 yrs out
- Wind 5/10 Major 25% chance of damaging wind over 30 yrs
- Air quality 4/10 Moderate 4 unhealthy d/yr today · 6 by 30 yrs out
Nearby sold comps map
Loading sold comps map…
Walkable amenities ~0.75 mi
Loading nearby amenities…
Taxation est. · year 1
- Rental income
- $24,095
- − Mortgage interest
- −$13,276
- − Property taxes
- −$5,241
- − Insurance
- −$1,185
- − Repairs & maintenance
- −$1,928
- − Management
- −$1,928
- − Depreciation
- −$6,895
- Taxable loss
- −$6,357
- Est. tax savings @ 24.0%
- +$1,526
- After-tax cash flow
- $-780/yr
For passive investors: Depreciation is non-cash, so a rental often shows a tax loss while cash-flowing — sheltering income. Rental losses are passive: they offset passive income freely, and up to $25,000/yr can offset ordinary (W-2) income if you actively participate and your MAGI is under $100k (phasing out to $0 by $150k); unused losses carry forward. On sale, claimed depreciation is recaptured at up to 25%, and gains may owe capital-gains tax (a 1031 exchange can defer both). Figures are a year-1 estimate at your 24.0% rate — not tax advice; consult a CPA.
Schools (NCES district)
- District
- Atlanta Public Schools
- NCES district ID
- 1300120
- Math proficiency
- 28% ▼ -6.00%
- Reading proficiency
- 35% ▼ -2.00%
- Median HH income
- $48,306
- Composite
- 27.27/100
- National rank
- #7006
- State rank
- #80 of 174 in GA
Livability — Atlanta
- Score
- 83/100
- State rank
- #6
- US rank
- #919
Category grades
Schools grade is shown separately in the Schools card above.
Census & demographics
- Census place
- Atlanta, GA
- County
- Fulton County · 1,094,430 people
- City population
- 629,525
- Metro
- Atlanta-Sandy Springs-Alpharetta, GA
- Population (ZIP)
- 34,264
- Household income
- $50,822
- Rent vs Own
- Severe rent burden
- 2962.0
Population outlook (Fulton County) Hauer SSP2
- Today (2025)
- 1,203,707 people
- By 2030
- 1,299,706 · +8.0%
- By 2040
- 1,488,256 · +23.6%
- By 2050
- 1,664,580 · +38.3%
- By 2075
- 2,036,072 · +69.2%
- By 2100
- 2,222,402 · +84.6%
Race, ethnicity, and origin ACS 2023
- Neighborhood character
- Predominantly Black (72%)
- Race & ethnicity
- Black 72% White 14% Hispanic / Latino 10% Two or more races 4%
- Hispanic origin (detail)
- Mexican 4%
- Common ancestry
- Romanian 1% Italian 1% Lithuanian 1%
- Foreign-born
- 5% · Canada
- Languages at home
- 90% English-only · Spanish 9% French/Haitian/Cajun 1%
Political lean MEDSL · Fulton
- 2024 margin
- Solid D (+44.9) · D 71.9% · R 27.0% · Other 1.1%
- 2008→2024 swing
- +9.8pp toward D · 2008: 35.0pp · 2024: 44.9pp
- All cycles
- 2024: D+44.9 2020: D+46.4 2016: D+42.1 2012: D+29.6 2008: D+35.0
Not yet ingested
- Civics
- —
Market trends
- HPI YoY
- ▼ -281.87%
- Current HPI
- 176.673
- Rent YoY
- ▲ 3.23%
- Metro
- Atlanta-Sandy Springs-Alpharetta, GA
- State GDP YoY
- ▲ 2.66%
- F500 in state
- 28
Industry mix (Fortune 500 HQ in GA)
| Industry | F500 HQs | Revenue |
|---|---|---|
| Paper / Packaging | 2 | $29B |
|
||
| Retail | 1 | $160B |
|
||
| Transportation / Logistics | 1 | $91B |
|
||
| Airlines | 1 | $62B |
|
||
| Consumer Goods | 1 | $47B |
|
||
| Utilities | 1 | $25B |
|
||
Price history
+930.4% since first listed67 events — show timeline
- 2025-10-21 Listing Removed — FMLS
- 2025-10-21 Listing Removed — GAMLS
- 2025-10-21 Listed $237,000 FMLS
- 2025-10-21 Listed $237,000 GAMLS
- 2025-09-02 Price Changed $238,000 FMLS
- 2025-09-02 Price Changed $238,000 GAMLS
- 2025-05-27 Price Changed $245,000 GAMLS
- 2025-05-27 Price Changed $245,000 FMLS
- 2025-05-14 Relisted — FMLS
- 2025-05-14 Relisted — GAMLS
- 2025-04-24 Pending — FMLS
- 2025-03-31 Pending — GAMLS
- 2025-03-31 Contingent — FMLS
- 2025-03-25 Relisted — GAMLS
- 2025-03-25 Relisted — FMLS
- 2025-03-18 Pending — GAMLS
- 2025-03-18 Contingent — FMLS
- 2025-01-23 Price Changed $220,000 FMLS
- 2025-01-23 Price Changed $220,000 GAMLS
- 2025-01-22 Relisted — GAMLS
- 2025-01-22 Relisted — FMLS
- 2025-01-11 Pending — GAMLS
- 2025-01-11 Contingent — FMLS
- 2024-10-23 Listing Removed — GAMLS
- 2024-10-23 Listing Removed — FMLS
- 2024-10-23 Listed $250,000 FMLS
- 2024-10-23 Listed $250,000 GAMLS
- 2024-09-09 Listed $305,000 GAMLS
- 2024-09-09 Listed $305,000 FMLS
- 2021-01-07 Sold (Public Records) $230,000 Public Records
- 2020-12-18 Sold (MLS) $230,000 GAMLS
- 2020-12-18 Sold (MLS) $230,000 FMLS
- 2020-11-17 Pending — FMLS
- 2020-11-11 Contingent — FMLS
- 2020-11-06 Pending — GAMLS
- 2020-10-08 Listed $230,000 GAMLS
- 2020-10-08 Listed $230,000 FMLS
- 2020-07-01 Listing Removed — GAMLS
- 2020-06-30 Listing Removed — FMLS
- 2020-05-22 Price Changed $212,999 FMLS
- 2020-03-11 Listed $212,999 GAMLS
- 2020-03-11 Listed $215,000 FMLS
- 2019-09-03 Sold (Public Records) $108,000 Public Records
- 2019-08-27 Sold (MLS) $108,000 GAMLS
- 2019-08-27 Sold (MLS) $108,000 FMLS
- 2019-07-12 Pending — GAMLS
- 2019-07-12 Pending — FMLS
- 2019-07-04 Relisted — GAMLS
- 2019-07-04 Relisted — FMLS
- 2019-06-21 Pending — GAMLS
- 2019-06-21 Pending — FMLS
- 2019-06-19 Listed $115,000 GAMLS
- 2019-06-18 Listed $115,000 FMLS
- 2018-10-10 Sold (Public Records) $83,000 Public Records
- 2018-10-03 Sold (MLS) $83,000 GAMLS
- 2018-09-28 Pending — FMLS
- 2018-09-28 Pending — GAMLS
- 2018-09-26 Sold (MLS) $83,000 FMLS
- 2018-09-17 Contingent — GAMLS
- 2018-09-17 Contingent — FMLS
- 2018-09-06 Relisted — GAMLS
- 2018-09-06 Relisted — FMLS
- 2018-08-31 Pending — GAMLS
- 2018-08-30 Contingent — FMLS
- 2018-08-23 Listed $89,900 GAMLS
- 2018-08-23 Listed $89,900 FMLS
- 2018-08-10 Sold (Public Records) $23,000 Public Records
Property tax history
+13.1%/yrLatest (2025): $5,241 · -6.3% YoY. Source: county tax records.
Cash-flow waterfall
monthlySold comps — $/sqft
last 12 mo · ≤1 miLoading sold comps…