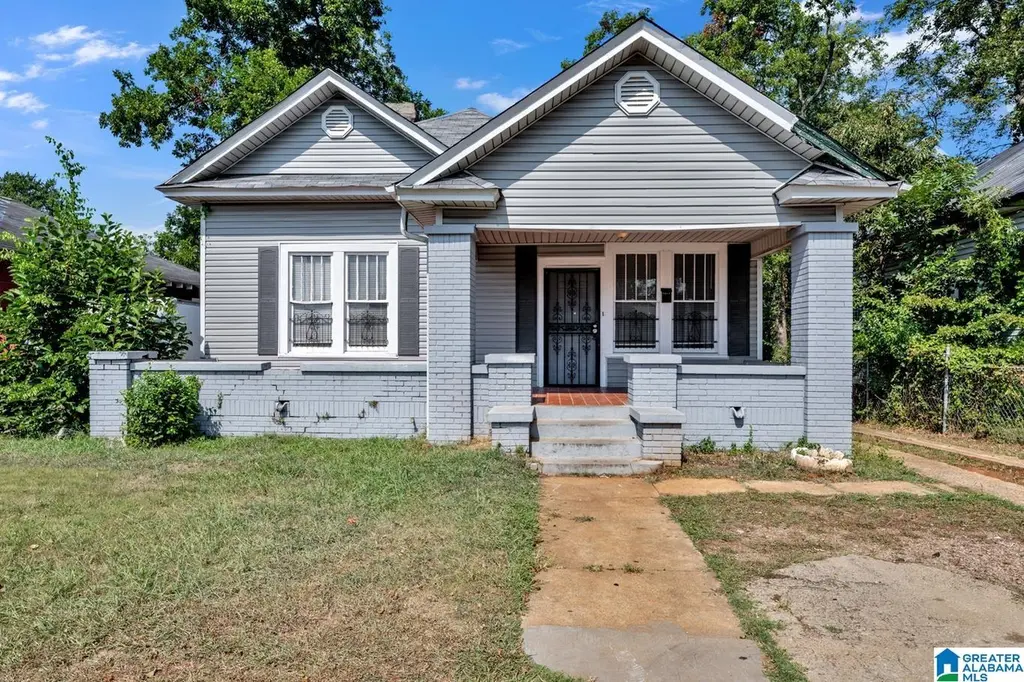
1672 SW Tuscaloosa Ave SW · Birmingham, AL
Flood risk 1/10 · Minimal
- FEMA flood zone
- X (unshaded)
- Chance of flooding over 30 yrs
- 0.0%
- Est. flood insurance / yr
- $473 – $860
Fire risk 1/10 · Minimal
- Est. fire insurance / yr
- $916 – $1,700
Heat risk 6/10 · Moderate
- Hot days now (above 106°F)
- 7 days/yr
- Hot days in 30 yrs
- 19 days/yr
Wind risk 6/10 · Moderate
- Chance of severe wind over 30 yrs
- 27.0%
Air-quality risk 4/10 · Minor
- Unhealthy air days now
- 5 days/yr
- Unhealthy air days in 30 yrs
- 5 days/yr
Risk factors via First Street. Map © Google.
Why this score? — see what drove the D+ grade
The composite is a weighted blend of 9 inputs, each scored 0–100. Each bar is that input's sub-score; the figure is the points it added to the 100-point composite (weight × sub-score).
- Cash flow +20.9/30.0
- ARV discount +7.5/15.0
- DSCR +6.6/10.0
- 1% rule +4.9/10.0
- Livability +3.4/5.0
- Rent growth +2.5/5.0
- Condition / age +2.5/5.0
- Schools +0.9/10.0
- Appreciation +0.0/10.0
$130,000
🖨 Deal sheet (PDF) 📄 Offer letter ✓ Due diligence
Listing remarks MLS
NO SELLER FINANCING!! This charming one-level home features 3 spacious bedrooms, 1 updated bathroom, and an updated kitchen with modern finishes. Inside, you’ll find beautiful hardwood and tile flooring throughout, veryyy tall ceilings that add a bright and open feel, and washer/dryer connections for convenience. Outside, enjoy a large front porch, a screened back porch perfect for relaxing, and driveway parking. Located within walking distance to Piggly Wiggly and other nearby amenities, this home blends classic character with modern updates in an ideal location.
Key facts
- Hardwood flooring
- Screened back porch
- Large front porch
Tags
Neighborhood map
What this means for you Summary
Snapshot
- This is a 3-bed/1.0-bath single-family listed at $130k.
Deal economics
- At list price, monthly cash flow is $180 ($2k/yr) — positive.
- The deal already cash-flows at list — no discount required.
- To meet the 1% rule (rent ≥ 1% of price), the offer needs to be $129k (0.8% below list).
- Recommended offer: $114k (12.0% below list) — sets the bar for market timing.
- Cap rate 8.0% vs local median 6.2% in Birmingham — meaningfully above typical; check what's discounted (condition, days-on-market, listing class) to confirm the premium yield is real.
Location & tenants
- Location reads 67/100 on livability (#78 in AL) — a middle-class / working-renter tenant base. Strengths: commute A+, cost of living A+, housing A+; Watch: amenities C-, schools F, crime F.
- Birmingham City (urban): math 4% / reading 20% proficiency, ranked #116 of 129 in AL (top 90%) — low school quality limits family demand, transient renter base, plan for 1-2y turnover; 82% free/reduced lunch — lower-income household profile, screen leases tightly.
- Market conditions: Rents soft (-0.0%/yr); 152 active listings in the ZIP; 40 comparable units currently listed for rent nearby; rentals at typical pace (median 25d on market — plan ~3-4 weeks tenant-placement turnaround); 45% of comp listings sitting > 30 days — soft ceiling on asking rent; lower-income renter base — watch delinquency; 2,114 units permitted in Jefferson County in 2024 (556 in 5+ unit buildings).
- This rent runs 44% of the median local income ($35k/yr) — at the standard rent-burdened threshold; future hikes will face affordability resistance.
Forward outlook
- Local home prices are declining (-3.0%/yr); year-one equity from $899 of loan paydown is wiped out by about $4k of value loss. Plan a longer hold.
- Jefferson County population projected to shrink 4% by 2050 — rents likely to lag national; underwrite the cash flow, not the appreciation.
Negotiation context
- It's been on market 257 days — a 12% lower offer ($114k) is reasonable based on typical stale-listing flexibility.
- 2 sale attempts; this cycle's ask is 10733% above the opening price — seller raised mid-cycle; expect resistance to lowballs.
- Current owner paid $35k; list at $130k implies a 272% gain — meaningful room to come down on a strong offer.
Risks & watch-outs
- Watch-outs: built in 1910 — expect roof / HVAC / electrical / plumbing capex.
- Climate carrying-cost: major wind risk, 27% chance of damaging wind over 30y; extreme-heat days projected 7→19/yr by 2055 (HVAC capex compounding) — expect insurance premiums to compound above CPI over the hold.
Questions for the listing agent
- It's been on market 257 days. Have you received any prior offers? Is the seller open to a 12% concession, seller financing, or rate buy-down credit?
- Built in 1910 — when were the roof, HVAC, electrical panel, plumbing, and water heater last replaced?
- Why hasn't it sold? Are there any deal-killer items the seller is aware of (foundation, flood, title, zoning, code violations)?
- Is there a deadline driving the sale (1031 exchange, divorce, estate, relocation)? That informs how much negotiation room exists.
- Schools are F-rated, which usually means shorter tenancies and higher turnover. Who's the typical renter profile here, and what's been the actual vacancy rate?
- Crime grade is F in this area — have there been break-ins, vandalism, or insurance claims at this property in the last 3 years? What carrier currently insures it and at what premium?
- The area grade is low — what's the realistic commute time and amenity access for the typical tenant pool here? Any planned neighborhood developments (good or bad) we should know about?
- What's the average days-on-market for RENTAL listings here right now (not sales)? A rising rental-DOM trend means longer vacancies and softer asking-rent achievability than the comps imply.
- What's the recent tenant-quality profile in this submarket — average credit score on applications, eviction rate, late-payment / NSF rate, and stable-employment percentage? A property-management company in the area should have these aggregated.
- How much new for-sale + rental construction is in the pipeline within 1–3 miles? Heavy new supply typically softens prices + rents 12–24 months out; constrained supply supports both.
Investment metrics
- 1% rule
- 0.99% ✗
- Cap rate
- 7.95%
- Cash-on-cash
- 5.93%
- DSCR
- 1.26
- GRM
- 8.4
CMA / ARV
- ARV (median comp)
- $66,674
- List price
- $130,000
- Delta
- 94.98%
- Verdict
- OVERPRICED
- Comps
- 20 within 1.0 mi
Show comp detail 12 sales within ~0.75 mi
| Address | Dist | Beds/Ba | Sqft | Sold | Price | $/sf | Match |
|---|---|---|---|---|---|---|---|
| 1700 Lee Ave SW | 0.10mi | 3/2.0 | 1,586 (+7%) | 0mo | $177,000 | $112 | 80 |
| 724 18th Pl SW | 0.41mi | 4/2.0 (+1) | 1,508 (+2%) | 4mo | $48,900 | $32 | 65 |
| 1437 Woodland Ave SW | 0.51mi | 3/1.0 | 1,369 (-8%) | 5mo | $53,000 | $39 | 59 |
| 915 19th Pl SW | 0.64mi | 4/1.0 (+1) | 1,434 (-3%) | 2mo | $20,000 | $14 | 58 |
| 1241 15th St SW | 0.71mi | 3/2.0 | 1,443 (-3%) | 1mo | $102,000 | $71 | 57 |
| 1440 16th Way SW | 0.73mi | 4/1.0 (+1) | 1,519 (+2%) | 2mo | $42,500 | $28 | 55 |
| 1625 SW Alabama Ave | 0.30mi | 2/2.0 (-1) | 1,290 (-13%) | 2mo | $19,900 | $15 | 53 |
| 1317 SW 16th St SW | 0.73mi | 3/2.0 | 1,420 (-4%) | 6mo | $133,000 | $94 | 50 |
| 430 12th St SW | 0.73mi | 3/2.0 | 1,408 (-5%) | 7mo | $140,000 | $99 | 48 |
| 1245 16th St SW | 0.63mi | 3/2.0 | 1,336 (-10%) | 5mo | $145,000 | $109 | 46 |
| 1125 SW 15th St | 0.54mi | 3/2.0 | 1,684 (+14%) | 7mo | $139,000 | $83 | 42 |
| 1236 Mims St SW | 0.71mi | 4/2.0 (+1) | 1,695 (+14%) | 1mo | $168,000 | $99 | 34 |
Match score weights: distance 35% · size 25% · config 20% · recency 20%. Top-matched comps best support the ARV.
Projected returns pro-forma
-3.0% appreciation · 0.0% rent growth · sell at horizon
- IRR
- -10.4%
- Equity multiple
- 0.63×
- Total profit
- $-13,398
- Equity at exit
- $19,383
- IRR
- -5.6%
- Equity multiple
- 0.68×
- Total profit
- $-11,577
- Equity at exit
- $11,240
Cash invested: $36,400 (down + closing). Projections, not guarantees.
Landlord ↔ Tenant lean methodology
- Overall (STATE)
- 90 Strongly Landlord-Friendly
- State Alabama
- 90 Strongly Landlord-Friendly · R+15
- County
- — inherits STATE
- City
- — inherits STATE
ZIP-level market 35211
- Rents YoY
- -0.0%
- Active inventory
- 152
- Price-to-rent
- 8.4×
Monthly cashflow live
- Estimated rent
- $1,289 high interval (Pro) →
- Mortgage (P&I)
- −$682
- Tax from tax record
- −$103 /mo · $1,231/yr
- Insurance
- −$54
- HOA
- −$0
- Vacancy / Maint / Mgmt
- −$271
- Net cashflow
- $180
Break-even live
Sensitivity live
| Price | -10% $254 | -5% $217 | +0% $180 | +5% $143 | +10% $106 |
|---|---|---|---|---|---|
| Rent | -10% $78 | -5% $129 | +0% $180 | +5% $231 | +10% $282 |
| Rate | -1.0pp $245 | -0.5pp $213 | base $180 | +0.5pp $146 | +1.0pp $112 |
UW: 25.0% down · 7.5% · 30yr · 1.5% tax · 5.0% vac · 8.0% maint · 8.0% mgmt
Financing live
Cash to close
- Down payment
- $32,500
- Closing costs
- $3,900
- Reserves months
- —
- Total cash needed
- —
Loan-product check · same deal, 3 products live
Conventional
25% down · 7.5% · 30yr
- Down + closing
- —
- Monthly P&I
- —
- Monthly cashflow
- —
- DSCR
- —
- Eligible?
- —
Personal DTI + credit; lowest rate.
DSCR
20% down · 8.5% · 30yr
- Down + closing
- —
- Monthly P&I
- —
- Monthly cashflow
- —
- DSCR
- —
- Eligible?
- —
No personal income docs; deal must DSCR.
Hard money
10% down · 12.0% · 12mo
- Down + closing
- —
- Monthly P&I
- —
- Monthly cashflow
- —
- DSCR
- —
- Eligible?
- —
Short-term bridge; refi at stabilization.
Rent comps 40 comps
| Address | Beds | Baths | Sqft | Rent | $/sqft | DOM | Units | Dist |
|---|---|---|---|---|---|---|---|---|
| 1734 Lee Ave SW Birmingham, AL | 4.0 | 1.0 | 1142 | $1,150 | $1.01 | 20d | 1 | 0.17mi |
| 1728 Princeton Ave SW Birmingham, AL | 4.0 | 2.0 | 1334 | $1,300 | $0.97 | 44d | 1 | 0.18mi |
| 504 Francis Pl SW Birmingham, AL | 3.0 | 2.0 | 1816 | $1,223 | $0.67 | 24d | 1 | 0.24mi |
| 1816 Saint Charles Ave SW Birmingham, AL | 3.0 | 1.0 | 1395 | $1,295 | $0.93 | 24d | 1 | 0.27mi |
| 1645 Woodland Ave SW Birmingham, AL | 4.0 | 2.0 | 1298 | $1,300 | $1.00 | 20d | 1 | 0.35mi |
| 1501 Princeton Ave SW Birmingham, AL | 3.0 | 2.0 | 1260 | $1,350 | $1.07 | 45d | 1 | 0.35mi |
| 1609 Jefferson Ave SW Birmingham, AL | 4.0 | 1.0 | 1572 | $1,300 | $0.83 | 4d | 1 | 0.35mi |
| 1000 17th Pl SW Birmingham, AL | 3.0 | 2.0 | 1200 | $1,275 | $1.06 | 20d | 1 | 0.36mi |
| 1800 Woodland Ave SW Birmingham, AL | 4.0 | 1.0 | 1411 | $1,195 | $0.85 | 3d | 1 | 0.37mi |
| 1620 Alemeda Ave SW Birmingham, AL | 3.0 | 2.0 | 1314 | $1,295 | $0.99 | 3d | 1 | 0.41mi |
| 1900 Saint Charles Ave SW Birmingham, AL | 4.0 | 2.0 | 1623 | $1,350 | $0.83 | 3d | 1 | 0.49mi |
| 1437 Woodland Ave SW Birmingham, AL | 3.0 | 1.0 | 1369 | $1,100 | $0.80 | 4d | 1 | 0.50mi |
| 1136 15th St SW Birmingham, AL | 4.0 | 2.0 | 1296 | $1,395 | $1.08 | 24d | 1 | 0.56mi |
| 1698 Dennison Ave SW Birmingham, AL | 4.0 | 2.0 | 1780 | $1,300 | $0.73 | 44d | 1 | 0.56mi |
| 1204 15th Way SW Birmingham, AL | 4.0 | 3.0 | 1715 | $1,400 | $0.82 | 44d | 1 | 0.56mi |
| 1933 Saint Charles Ct SW Birmingham, AL | 3.0 | 1.0 | 1106 | $1,050 | $0.95 | 24d | 1 | 0.59mi |
| 2028 Lee Ter SW Birmingham, AL | 2.0 | 1.0 | 884 | $695 | $0.79 | 44d | 1 | 0.60mi |
| 1233 15th Way SW Birmingham, AL | 3.0 | 1.0 | 1119 | $1,050 | $0.94 | 44d | 1 | 0.64mi |
| 2026 Lee Ct SW Birmingham, AL | 3.0 | 1.0 | 1204 | $1,100 | $0.91 | 44d | 1 | 0.65mi |
| 1228 Fulton Ave SW Birmingham, AL | 2.0 | 1.0 | 900 | $800 | $0.89 | 45d | 1 | 0.67mi |
| 1217 Fulton Ave SW Birmingham, AL | 4.0 | 2.0 | 1397 | $1,395 | $1.00 | 44d | 1 | 0.69mi |
| 208 22nd St SW Birmingham, AL | 2.0 | 1.0 | 926 | $1,050 | $1.13 | 4d | 1 | 0.70mi |
| 2216 Lee Ave SW Birmingham, AL | 3.0 | 1.0 | 902 | $900 | $1.00 | 24d | 1 | 0.71mi |
| 1220 Alabama Ave SW Birmingham, AL | 3.0 | 1.5 | 1175 | $1,350 | $1.15 | 44d | 1 | 0.71mi |
| 1213 Alabama Ave SW Birmingham, AL | 4.0 | 2.0 | 1616 | $1,200 | $0.74 | 44d | 1 | 0.72mi |
| 1256 15th St SW Birmingham, AL | 3.0 | 1.0 | 1206 | $1,300 | $1.08 | 4d | 1 | 0.74mi |
| 1332 15th Pl SW Birmingham, AL | 2.0 | 1.0 | 1115 | $950 | $0.85 | 4d | 1 | 0.80mi |
| 1252 18th Pl SW Birmingham, AL | 3.0 | 1.0 | 950 | $1,000 | $1.05 | 17d | 1 | 0.83mi |
| 407 S Park Rd SW Birmingham, AL | 3.0 | 1.0 | 1050 | $900 | $0.86 | 44d | 1 | 0.85mi |
| 405 11th St SW Unit B Birmingham, AL | 2.0 | 1.0 | 1065 | $800 | $0.75 | 44d | 1 | 0.88mi |
| 312 25th St SW Birmingham, AL | 4.0 | 1.0 | 1159 | $1,000 | $0.86 | 24d | 1 | 0.88mi |
| 1319 18th Way SW Birmingham, AL | 4.0 | 2.0 | 1337 | $1,345 | $1.01 | 24d | 1 | 0.90mi |
| 1209 19th Pl SW Birmingham, AL | 3.0 | 1.0 | 1050 | $1,275 | $1.21 | 44d | 1 | 0.91mi |
| 1508 Dennison Ave SW Birmingham, AL | 2.0 | 1.0 | 924 | $890 | $0.96 | 44d | 1 | 0.91mi |
| 1012 Cotton Ave SW Birmingham, AL | 3.0 | 1.0 | 1232 | $1,000 | $0.81 | 44d | 1 | 0.91mi |
| 2519 Saint Charles Ave SW Birmingham, AL | 2.0 | 1.0 | 990 | $975 | $0.98 | 45d | 1 | 0.92mi |
| 2017 48th Street Ensley Birmingham, AL | 3.0 | 2.0 | 1383 | $1,250 | $0.90 | 44d | 1 | 0.94mi |
| 1228 19th Pl SW Birmingham, AL | 3.0 | 2.0 | 978 | $1,195 | $1.22 | 4d | 1 | 0.96mi |
| 2320 Wesley Ave SW Birmingham, AL | 4.0 | 1.0 | 1865 | $1,200 | $0.64 | 11d | 1 | 0.97mi |
| 2304 Beulah Ave SW Birmingham, AL | 3.0 | 1.0 | 1283 | $1,025 | $0.80 | 3d | 1 | 0.98mi |
Listing history 4 events
-
2025-12-03historical $1,200
-
2025-09-14$1,200
-
2025-09-12$130,000 Active 576-char remark
Show marketing remark (576 chars)
NO SELLER FINANCING!! This charming one-level home features 3 spacious bedrooms, 1 updated bathroom, and an updated kitchen with modern finishes. Inside, you’ll find beautiful hardwood and tile flooring throughout, veryyy tall ceilings that add a bright and open feel, and washer/dryer connections for convenience. Outside, enjoy a large front porch, a screened back porch perfect for relaxing, and driveway parking. Located within walking distance to Piggly Wiggly and other nearby amenities, this home blends classic character with modern updates in an ideal location.
-
1994-10-27soldstatus $34,900
ⓘ Source: listings_history table (triggers on properties + properties_extension) + one-shot
backfill from property_details.listing_events for pre-trigger history.
Tax reassessment forecast AL · Resets to sale price
- Current annual tax
- $1,231 · $103/mo
- Projected year-2 tax
- $1,231 · $103/mo
- Expected delta
- $0/yr ($0/mo · 0.0%)
ⓘ Screening estimate from a state-policy table — verify with the county assessor before closing.
Climate risk First Street
- Flood 1/10 Low FEMA zone X (unshaded) · 0% chance over 30 yrs
- Wildfire 1/10 Low
- Heat 6/10 Major 7 d/yr ≥106°F today · 19 d/yr by 30 yrs out
- Wind 6/10 Major 27% chance of damaging wind over 30 yrs
- Air quality 4/10 Moderate 5 unhealthy d/yr today · 5 by 30 yrs out
Nearby sold comps map
Loading sold comps map…
Walkable amenities ~0.75 mi
Loading nearby amenities…
Taxation est. · year 1
- Rental income
- $15,471
- − Mortgage interest
- −$7,282
- − Property taxes
- −$1,231
- − Insurance
- −$650
- − Repairs & maintenance
- −$1,238
- − Management
- −$1,238
- − Depreciation
- −$3,782
- Taxable income
- $50
- Est. tax owed @ 24.0%
- −$12
- After-tax cash flow
- $2,148/yr
For passive investors: Depreciation is non-cash, so a rental often shows a tax loss while cash-flowing — sheltering income. Rental losses are passive: they offset passive income freely, and up to $25,000/yr can offset ordinary (W-2) income if you actively participate and your MAGI is under $100k (phasing out to $0 by $150k); unused losses carry forward. On sale, claimed depreciation is recaptured at up to 25%, and gains may owe capital-gains tax (a 1031 exchange can defer both). Figures are a year-1 estimate at your 24.0% rate — not tax advice; consult a CPA.
Schools (NCES district)
- District
- Birmingham City
- NCES district ID
- 0100390
- Math proficiency
- 4% ▼ -17.00%
- Reading proficiency
- 20% ▼ -4.00%
- Median HH income
- $31,988
- Composite
- 9.49/100
- National rank
- #9850
- State rank
- #116 of 129 in AL
Livability — Birmingham
- Score
- 67/100
- State rank
- #78
- US rank
- #10412
Category grades
Schools grade is shown separately in the Schools card above.
Census & demographics
- Census place
- Birmingham, AL
- County
- Jefferson County · 527,445 people
- City population
- 210,422
- Metro
- Birmingham-Hoover, AL
- Population (ZIP)
- 24,924
- Household income
- $34,884
- Rent vs Own
- Severe rent burden
- 2161.0
Population outlook (Jefferson County) Hauer SSP2
- Today (2025)
- 669,185 people
- By 2030
- 669,694 · +0.1%
- By 2040
- 661,388 · -1.2%
- By 2050
- 643,086 · -3.9%
- By 2075
- 577,267 · -13.7%
- By 2100
- 474,758 · -29.1%
Race, ethnicity, and origin ACS 2023
- Neighborhood character
- Predominantly Black (77%)
- Race & ethnicity
- Black 77% White 10% Hispanic / Latino 10% Two or more races 4%
- Hispanic origin (detail)
- Mexican 7%
- Foreign-born
- 6% · Canada
- Languages at home
- 91% English-only · Spanish 8% French/Haitian/Cajun 1%
Political lean MEDSL · Jefferson
- 2024 margin
- D (+10.4) · D 54.6% · R 44.2% · Other 1.2%
- 2008→2024 swing
- +5.4pp toward D · 2008: 5.1pp · 2024: 10.4pp
- All cycles
- 2024: D+10.4 2020: D+13.2 2016: D+7.2 2012: D+6.0 2008: D+5.1
Not yet ingested
- Civics
- —
Market trends
- HPI YoY
- ▼ -49.29%
- Current HPI
- 91.2903
- Rent YoY
- ▬ -0.01%
- Metro
- Birmingham-Hoover, AL
- State GDP YoY
- ▲ 2.94%
- F500 in state
- 4
Industry mix (Fortune 500 HQ in AL)
| Industry | F500 HQs | Revenue |
|---|---|---|
| Financial Services | 1 | $8B |
|
||
| Healthcare | 1 | $5B |
|
||
Price history
-96.6% since first listed4 events — show timeline
- 2025-12-03 Rental Removed $1,200 GALMLS
- 2025-09-14 Listed for Rent $1,200 GALMLS
- 2025-09-12 Listed $130,000 Greater Alabama MLS
- 1994-10-27 Sold (Public Records) $34,900 Public Records
Property tax history
+3.7%/yrLatest (2025): $1,231 · +0.0% YoY. Source: county tax records.
Cash-flow waterfall
monthlySold comps — $/sqft
last 12 mo · ≤1 miLoading sold comps…