7 Woodland · Middle River, MD
Flood risk No data
- FEMA flood zone
- —
- Chance of flooding over 30 yrs
- —
- Est. flood insurance / yr
- —
Fire risk No data
- Est. fire insurance / yr
- —
Heat risk No data
- Hot days now (above threshold)
- —
- Hot days in 30 yrs
- —
Wind risk No data
- Chance of severe wind over 30 yrs
- —
Air-quality risk No data
- Unhealthy air days now
- —
- Unhealthy air days in 30 yrs
- —
Risk factors via First Street. Map © Google.
Why this score? — see what drove the D grade
The composite is a weighted blend of 9 inputs, each scored 0–100. Each bar is that input's sub-score; the figure is the points it added to the 100-point composite (weight × sub-score).
- ARV discount +13.6/15.0
- Cash flow +11.6/30.0
- Livability +3.9/5.0
- DSCR +3.4/10.0
- Rent growth +2.7/5.0
- 1% rule +2.6/10.0
- Condition / age +2.5/5.0
- Schools +2.3/10.0
- Appreciation +0.0/10.0
$399,999
🖨 Deal sheet (PDF) 📄 Offer letter ✓ Due diligence
Listing remarks MLS
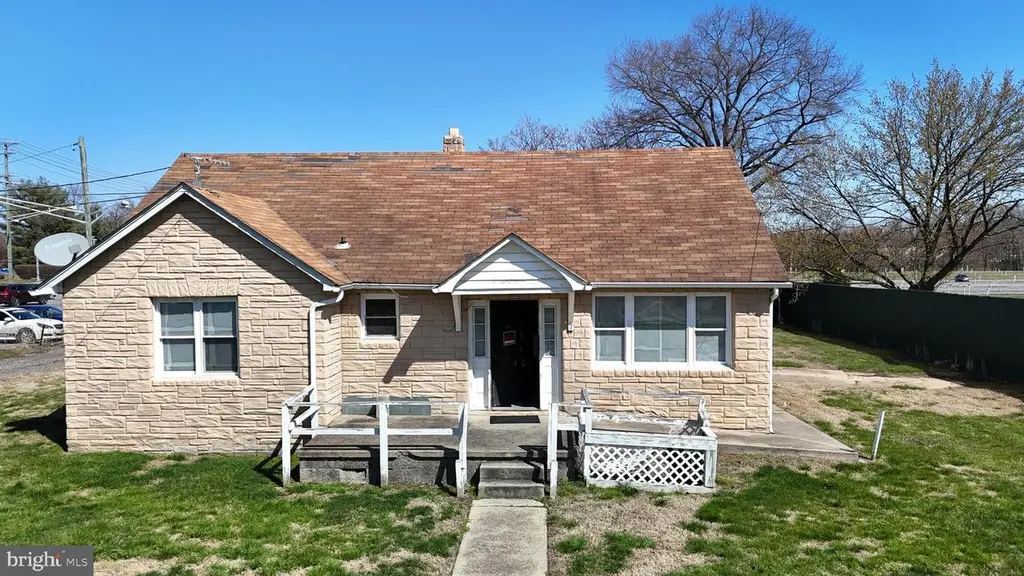
Rare opportunity alert — this is the one savvy investors have been waiting for! Situated in the heart of Middle River just steps off Eastern Avenue, 7 Woodland Ave is a versatile, high-potential property that puts the power of choice squarely in your hands. Currently configured as three separate units (two 2-bedroom units and one 1-bedroom unit), this property is ready for a visionary buyer to bring it back to life as a cash-flowing 3-unit rental income machine. Renovate and rent — and watch your investment work for you month after month with three income streams under one roof. But the opportunity doesn't stop there. This property carries BLCNS zoning (Business Local / Commercial Neighborhood Service), opening the door to a world of possibilities beyond residential. Want to build a neighborhood shop, a service business, or a small commercial development? The zoning allows it. Whether you're a seasoned investor, a developer, or someone looking to put their stamp on a growing community — this property gives you the flexibility to build exactly what the market needs. The location is unbeatable. Nestled right in the corridor of Middle River's main artery, you'll have instant visibility and access to steady local traffic, nearby parks, and the area's expanding amenity base. Properties with this combination of multi-unit income potential, commercial zoning, and a prime central location simply don't come around often. Bring your contractor, bring your vision, and bring your best offer. The bones are there. The zoning is there. All that's missing is you. Sold strictly AS-IS. Buyer to perform all due diligence.
Key facts
- Three separate units
- Blcns zoning
- 0.28 acre lot
Tags
Neighborhood map
What this means for you Summary
Snapshot
- This is a 5-bed/3.0-bath single-family listed at $400k.
Deal economics
- At list price, monthly cash flow is $-125 ($-2k/yr) — negative.
- To cash-flow at today's rent, offer at most $378k (5.5% below list).
- To meet the 1% rule (rent ≥ 1% of price), the offer needs to be $306k (23.6% below list).
- Recommended offer: $306k (23.6% below list) — sets the bar for 1% rule.
- Cap rate 5.9% vs local median 4.2% in Middle River — top-decile yield for the area; either an underpriced asset or a hidden risk that comps aren't pricing in. Stress-test before assuming the spread holds.
Location & tenants
- Location reads 78/100 on livability (#76 in MD, #2,777 nationally) — a middle-class / working-renter tenant base. Strengths: commute A+, housing A+, health & safety A+; Watch: crime F.
- Baltimore County Public Schools (suburban): math 15% / reading 34% proficiency, ranked #11 of 24 in MD (top 46%) — low school quality limits family demand, transient renter base, plan for 1-2y turnover.
- Zoned schools: Chase Elementary (math 12% / reading 17%, grade F, #477 of 860 statewide, top 59%, 358 students, 60% FRL); Stemmers Run Middle (math 5% / reading 28%, grade F, #174 of 225 statewide, top 81%, 838 students, 68% FRL); Kenwood High (math 10% / reading 43%, grade F, #161 of 222 statewide, top 72%, 1,908 students, 63% FRL) — zoned schools average 64% FRL vs 39% district-wide (25 pts higher); higher-poverty schools than district average — tighter screening recommended.
- Market conditions: Rents flat; 252 active listings in the ZIP; 5 comparable units currently listed for rent nearby; rentals lingering (median 46d on market — plan ~5-8 weeks vacancy on turnover, expect pricing pressure); 80% of comp listings sitting > 30 days — soft ceiling on asking rent; solid renter incomes; 1,511 units permitted in Baltimore County in 2024 (643 in 5+ unit buildings).
- This rent runs 45% of the median local income ($82k/yr) — at the standard rent-burdened threshold; future hikes will face affordability resistance.
Forward outlook
- Local home prices are declining (-3.0%/yr); year-one equity from $3k of loan paydown is wiped out by about $12k of value loss. Plan a longer hold.
- Baltimore County population projected at +12% by 2050 — modest demand growth; plan on rents tracking national, not racing it.
Negotiation context
- It's been on market 88 days — a 6% lower offer ($376k) is reasonable based on typical stale-listing flexibility.
- 4 sale attempts since 12y ago with the ask held roughly flat each time — persistent listings suggest the price (not the market) is what's stuck; bring a comps-based counter.
- Current owner paid $170k; list at $400k implies a 135% gain — meaningful room to come down on a strong offer.
Risks & watch-outs
- Watch-outs: built in 1914 — expect roof / HVAC / electrical / plumbing capex.
Questions for the listing agent
- What do current leases actually rent for vs. the listed asking? Can we see a recent rent roll and the last 12 months of T-12 income?
- It's been on market 88 days. Have you received any prior offers? Is the seller open to a 24% concession, seller financing, or rate buy-down credit?
- Built in 1914 — when were the roof, HVAC, electrical panel, plumbing, and water heater last replaced?
- Why hasn't it sold? Are there any deal-killer items the seller is aware of (foundation, flood, title, zoning, code violations)?
- Is there a deadline driving the sale (1031 exchange, divorce, estate, relocation)? That informs how much negotiation room exists.
- Schools are F-rated, which usually means shorter tenancies and higher turnover. Who's the typical renter profile here, and what's been the actual vacancy rate?
- Crime grade is F in this area — have there been break-ins, vandalism, or insurance claims at this property in the last 3 years? What carrier currently insures it and at what premium?
- The area grade is low — what's the realistic commute time and amenity access for the typical tenant pool here? Any planned neighborhood developments (good or bad) we should know about?
- What's the average days-on-market for RENTAL listings here right now (not sales)? A rising rental-DOM trend means longer vacancies and softer asking-rent achievability than the comps imply.
- What's the recent tenant-quality profile in this submarket — average credit score on applications, eviction rate, late-payment / NSF rate, and stable-employment percentage? A property-management company in the area should have these aggregated.
- How much new for-sale + rental construction is in the pipeline within 1–3 miles? Heavy new supply typically softens prices + rents 12–24 months out; constrained supply supports both.
Investment metrics
- 1% rule
- 0.76% ✗
- Cap rate
- 5.92%
- Cash-on-cash
- -1.34%
- DSCR
- 0.94
- GRM
- 10.9
CMA / ARV
- ARV (median comp)
- $462,878
- List price
- $399,999
- Delta
- -13.58%
- Verdict
- UNDERPRICED
- Comps
- 4 within 1.0 mi
Projected returns pro-forma
-3.0% appreciation · 0.83% rent growth · sell at horizon
- IRR
- -20.8%
- Equity multiple
- 0.29×
- Total profit
- $-79,418
- Equity at exit
- $59,641
- IRR
- -19.4%
- Equity multiple
- 0.06×
- Total profit
- $-105,464
- Equity at exit
- $34,585
Cash invested: $112,000 (down + closing). Projections, not guarantees.
Landlord ↔ Tenant lean methodology
- Overall (STATE)
- 27 Tenant-Leaning
- State Maryland
- 27 Tenant-Leaning · D+14
- County
- — inherits STATE
- City
- — inherits STATE
ZIP-level market 21220
- Rents YoY
- 0.8%
- Active inventory
- 252
- Price-to-rent
- 10.9×
Monthly cashflow live
- Estimated rent
- $3,057 high interval (Pro) →
- Mortgage (P&I)
- −$2,098
- Tax from tax record
- −$276 /mo · $3,308/yr
- Insurance
- −$167
- HOA
- −$0
- Vacancy / Maint / Mgmt
- −$642
- Net cashflow
- $-125
Break-even live
Sensitivity live
| Price | -10% $101 | -5% $-12 | +0% $-125 | +5% $-238 | +10% $-352 |
|---|---|---|---|---|---|
| Rent | -10% $-367 | -5% $-246 | +0% $-125 | +5% $-5 | +10% $116 |
| Rate | -1.0pp $76 | -0.5pp $-24 | base $-125 | +0.5pp $-229 | +1.0pp $-334 |
UW: 25.0% down · 7.5% · 30yr · 1.5% tax · 5.0% vac · 8.0% maint · 8.0% mgmt
Financing live
Cash to close
- Down payment
- $100,000
- Closing costs
- $12,000
- Reserves months
- —
- Total cash needed
- —
Loan-product check · same deal, 3 products live
Conventional
25% down · 7.5% · 30yr
- Down + closing
- —
- Monthly P&I
- —
- Monthly cashflow
- —
- DSCR
- —
- Eligible?
- —
Personal DTI + credit; lowest rate.
DSCR
20% down · 8.5% · 30yr
- Down + closing
- —
- Monthly P&I
- —
- Monthly cashflow
- —
- DSCR
- —
- Eligible?
- —
No personal income docs; deal must DSCR.
Hard money
10% down · 12.0% · 12mo
- Down + closing
- —
- Monthly P&I
- —
- Monthly cashflow
- —
- DSCR
- —
- Eligible?
- —
Short-term bridge; refi at stabilization.
Rent comps 5 comps
| Address | Beds | Baths | Sqft | Rent | $/sqft | DOM | Units | Dist |
|---|---|---|---|---|---|---|---|---|
| 17 Hidden Cove Ct Middle River, MD | 4.0 | 2.5 | 2350 | $3,500 | $1.49 | 18d | 1 | 0.29mi |
| 520 Holly Hunt Rd Middle River, MD | 4.0 | 3.0 | 1508 | $2,300 | $1.53 | 46d | 1 | 0.97mi |
| 4146 Cutty Sark Rd Middle River, MD | 4.0 | 3.0 | 2267 | $2,500 | $1.10 | 46d | 1 | 1.39mi |
| 985 Morgan Run Rd Middle River, MD | 4.0 | 3.5 | 2200 | $3,100 | $1.41 | 46d | 1 | 1.39mi |
| 10018 Sandy Run Rd Middle River, MD | 4.0 | 2.5 | 1970 | $3,050 | $1.55 | 46d | 1 | 1.49mi |
Listing history 25 events
-
2026-06-21days on market $399,999 Active 88 DOM
-
2026-06-18days on market $399,999 Active 85 DOM
-
2026-06-17days on market $399,999 Active 84 DOM
-
2026-06-16days on market $399,999 Active 83 DOM
-
2026-06-15days on market $399,999 Active 82 DOM
-
2026-06-13days on market $399,999 Active 80 DOM
-
2026-06-09days on market $399,999 Active 76 DOM
-
2026-06-08days on market $399,999 Active 75 DOM
-
2026-06-07days on market $399,999 Active 74 DOM
-
2026-06-04days on market $399,999 Active 71 DOM
-
2026-06-03days on market $399,999 Active 70 DOM
-
2026-06-02days on market $399,999 Active 69 DOM
-
2026-06-01days on market $399,999 Active 68 DOM
-
2026-05-31days on market $399,999 Active 67 DOM
-
2026-03-25$399,999 Active 1648-char remark
Show marketing remark (1648 chars)
Rare opportunity alert — this is the one savvy investors have been waiting for! Situated in the heart of Middle River just steps off Eastern Avenue, 7 Woodland Ave is a versatile, high-potential property that puts the power of choice squarely in your hands. Currently configured as three separate units (two 2-bedroom units and one 1-bedroom unit), this property is ready for a visionary buyer to bring it back to life as a cash-flowing 3-unit rental income machine. Renovate and rent — and watch your investment work for you month after month with three income streams under one roof. But the opportunity doesn't stop there. This property carries BLCNS zoning (Business Local / Commercial Neighborhood Service), opening the door to a world of possibilities beyond residential. Want to build a neighborhood shop, a service business, or a small commercial development? The zoning allows it. Whether you're a seasoned investor, a developer, or someone looking to put their stamp on a growing community — this property gives you the flexibility to build exactly what the market needs. The location is unbeatable. Nestled right in the corridor of Middle River's main artery, you'll have instant visibility and access to steady local traffic, nearby parks, and the area's expanding amenity base. Properties with this combination of multi-unit income potential, commercial zoning, and a prime central location simply don't come around often. Bring your contractor, bring your vision, and bring your best offer. The bones are there. The zoning is there. All that's missing is you. Sold strictly AS-IS. Buyer to perform all due diligence.
-
2023-03-29soldstatus $170,500
-
2023-02-10soldstatus $170,500 Closed 473-char remark
Show marketing remark (473 chars)
EVENING VIRTUAL AUCTION: Pre-Bidding Begins 01/09 @ 10:00 AM. Pre-Bidding ends 01/11 @ 6:50 PM. Virtual Simulcast Auction Begins 01/11 @ 7:00 PM. List Price is Suggested Opening Bid. Deposit: $10,000. Detached Home located in the Middle River area of Baltimore County. JUST MINUTES to Eastern Regional Park & Seneca Creek. Easy Access to Major Traffic Artery Eastern Blvd. Property is believed to be set up as 3 units, with 2 2-Bedroom Units & 1 1-Bedroom Unit.
-
2023-01-12status Pending 473-char remark
Show marketing remark (473 chars)
EVENING VIRTUAL AUCTION: Pre-Bidding Begins 01/09 @ 10:00 AM. Pre-Bidding ends 01/11 @ 6:50 PM. Virtual Simulcast Auction Begins 01/11 @ 7:00 PM. List Price is Suggested Opening Bid. Deposit: $10,000. Detached Home located in the Middle River area of Baltimore County. JUST MINUTES to Eastern Regional Park & Seneca Creek. Easy Access to Major Traffic Artery Eastern Blvd. Property is believed to be set up as 3 units, with 2 2-Bedroom Units & 1 1-Bedroom Unit.
-
2023-01-05$75,000 Active 473-char remark
Show marketing remark (473 chars)
EVENING VIRTUAL AUCTION: Pre-Bidding Begins 01/09 @ 10:00 AM. Pre-Bidding ends 01/11 @ 6:50 PM. Virtual Simulcast Auction Begins 01/11 @ 7:00 PM. List Price is Suggested Opening Bid. Deposit: $10,000. Detached Home located in the Middle River area of Baltimore County. JUST MINUTES to Eastern Regional Park & Seneca Creek. Easy Access to Major Traffic Artery Eastern Blvd. Property is believed to be set up as 3 units, with 2 2-Bedroom Units & 1 1-Bedroom Unit.
-
2017-09-27soldstatus $155,000
-
2014-12-28historical
-
2014-12-28historical
-
2014-01-03Active
-
2014-01-03$190,000
-
1996-03-06soldstatus $63,000
ⓘ Source: listings_history table (triggers on properties + properties_extension) + one-shot
backfill from property_details.listing_events for pre-trigger history.
Tax reassessment forecast MD · Partial reset (capped growth)
- Current annual tax
- $3,308 · $276/mo
- Projected year-2 tax
- $3,834 · $319/mo
- Expected delta
- +$526/yr (+$44/mo · 15.9%)
ⓘ Screening estimate from a state-policy table — verify with the county assessor before closing.
Nearby sold comps map
Loading sold comps map…
Walkable amenities ~0.75 mi
Loading nearby amenities…
Taxation est. · year 1
- Rental income
- $36,679
- − Mortgage interest
- −$22,406
- − Property taxes
- −$3,308
- − Insurance
- −$2,000
- − Repairs & maintenance
- −$2,934
- − Management
- −$2,934
- − Depreciation
- −$11,636
- Taxable loss
- −$8,540
- Est. tax savings @ 24.0%
- +$2,050
- After-tax cash flow
- $547/yr
For passive investors: Depreciation is non-cash, so a rental often shows a tax loss while cash-flowing — sheltering income. Rental losses are passive: they offset passive income freely, and up to $25,000/yr can offset ordinary (W-2) income if you actively participate and your MAGI is under $100k (phasing out to $0 by $150k); unused losses carry forward. On sale, claimed depreciation is recaptured at up to 25%, and gains may owe capital-gains tax (a 1031 exchange can defer both). Figures are a year-1 estimate at your 24.0% rate — not tax advice; consult a CPA.
Schools (NCES district)
- District
- Baltimore County Public Schools
- NCES district ID
- 2400120
- Math proficiency
- 15% ▼ -16.00%
- Reading proficiency
- 34% ▼ -5.00%
- Median HH income
- $66,746
- Composite
- 23.17/100
- National rank
- #7948
- State rank
- #11 of 24 in MD
Livability — Middle River
- Score
- 78/100
- State rank
- #76
- US rank
- #2777
Category grades
Schools grade is shown separately in the Schools card above.
Census & demographics
- Census place
- Middle River, MD
- County
- Baltimore County · 769,527 people
- City population
- 42,824
- Metro
- Baltimore-Columbia-Towson, MD
- Population (ZIP)
- 42,824
- Household income
- $81,817
- Rent vs Own
- Severe rent burden
- 1921.0
Population outlook (Baltimore County) Hauer SSP2
- Today (2025)
- 885,518 people
- By 2030
- 909,272 · +2.7%
- By 2040
- 951,547 · +7.5%
- By 2050
- 990,955 · +11.9%
- By 2075
- 1,086,411 · +22.7%
- By 2100
- 1,135,078 · +28.2%
Race, ethnicity, and origin ACS 2023
- Neighborhood character
- Diverse neighborhood (Simpson 0.60)
- Race & ethnicity
- White 57% Black 27% Two or more races 6% Hispanic / Latino 6% Asian 5%
- Hispanic origin (detail)
- Puerto Rican 1%
- Common ancestry
- Romanian 4% Ukrainian 2% Lithuanian 1%
- Foreign-born
- 12% · Canada, Vietnam
- Languages at home
- 86% English-only · Spanish 3% Arabic 3% Tagalog/Filipino 2%
Political lean MEDSL · Baltimore
- 2024 margin
- Strong D (+24.5) · D 61.0% · R 36.5% · Other 2.5%
- 2008→2024 swing
- +9.9pp toward D · 2008: 14.6pp · 2024: 24.5pp
- All cycles
- 2024: D+24.5 2020: D+27.0 2016: D+17.4 2012: D+16.4 2008: D+14.6
Not yet ingested
- Civics
- —
Market trends
- HPI YoY
- ▼ -199.31%
- Current HPI
- 254.5597
- Rent YoY
- ▲ 0.83%
- Metro
- Baltimore-Columbia-Towson, MD
- State GDP YoY
- ▲ 2.97%
- F500 in state
- 12
Industry mix (Fortune 500 HQ in MD)
| Industry | F500 HQs | Revenue |
|---|---|---|
| Aerospace / Defense | 1 | $71B |
|
||
| Utilities | 1 | $25B |
|
||
| Hotels | 1 | $24B |
|
||
| Consumer Goods | 1 | $7B |
|
||
| Real Estate | 1 | $6B |
|
||
| Chemicals | 1 | $2B |
|
||
Price history
+534.9% since first listed11 events — show timeline
- 2026-03-25 Listed $399,999 BRIGHT MLS
- 2023-03-29 Sold (Public Records) $170,500 Public Records
- 2023-02-10 Sold (MLS) $170,500 BRIGHT MLS
- 2023-01-12 Pending — BRIGHT MLS
- 2023-01-05 Listed $75,000 BRIGHT MLS
- 2017-09-27 Sold (Public Records) $155,000 Public Records
- 2014-12-28 Listing Removed — BRIGHT MLS
- 2014-12-28 Delisted — MRIS
- 2014-01-03 Listed — MRIS
- 2014-01-03 Listed $190,000 BRIGHT MLS
- 1996-03-06 Sold (Public Records) $63,000 Public Records
Property tax history
+1.4%/yrLatest (2025): $3,308 · +1.7% YoY. Source: county tax records.
Cash-flow waterfall
monthlySold comps — $/sqft
last 12 mo · ≤1 miLoading sold comps…