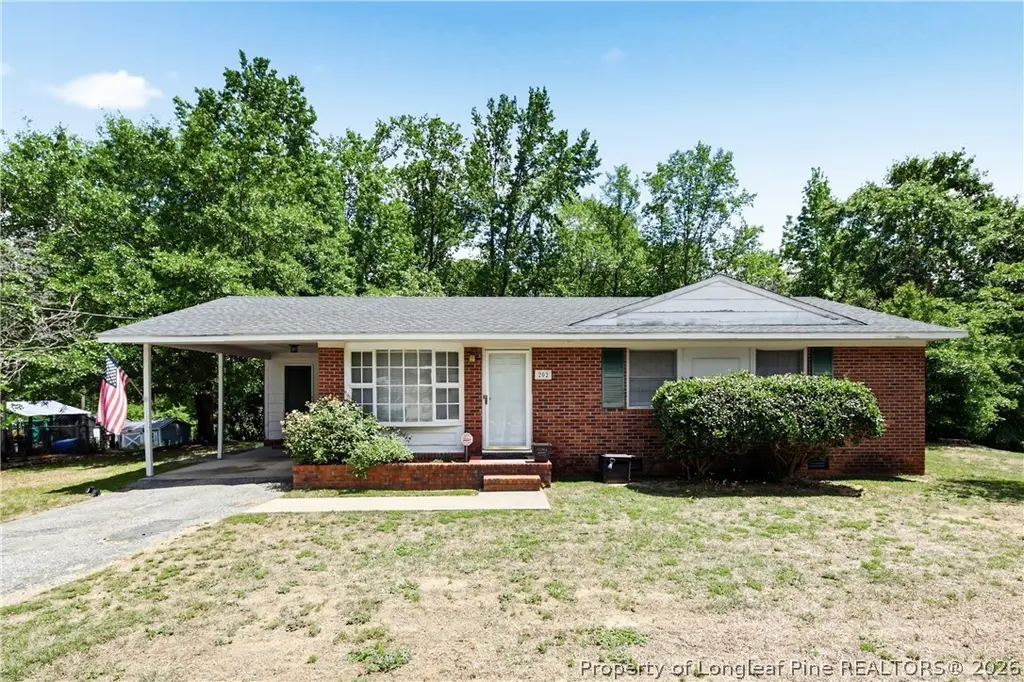
202 Onie Ct · Fayetteville, NC
Flood risk 1/10 · Minimal
- FEMA flood zone
- X (unshaded)
- Chance of flooding over 30 yrs
- 0.0%
- Est. flood insurance / yr
- $507 – $1,088
Fire risk 1/10 · Minimal
- Est. fire insurance / yr
- $906 – $1,684
Heat risk 7/10 · Major
- Hot days now (above 107°F)
- 7 days/yr
- Hot days in 30 yrs
- 16 days/yr
Wind risk 6/10 · Moderate
- Chance of severe wind over 30 yrs
- 73.0%
Air-quality risk 2/10 · Minimal
- Unhealthy air days now
- 0 days/yr
- Unhealthy air days in 30 yrs
- 1 days/yr
Risk factors via First Street. Map © Google.
Why this score? — see what drove the D grade
The composite is a weighted blend of 9 inputs, each scored 0–100. Each bar is that input's sub-score; the figure is the points it added to the 100-point composite (weight × sub-score).
- Cash flow +13.2/30.0
- ARV discount +9.5/15.0
- DSCR +4.0/10.0
- Livability +3.8/5.0
- 1% rule +3.3/10.0
- Rent growth +3.3/5.0
- Schools +3.1/10.0
- Condition / age +2.5/5.0
- Appreciation +0.0/10.0
$180,000
🖨 Deal sheet 📄 Offer letter ✓ Due diligence
Listing remarks
Charming all-brick ranch nestled on a spacious, tree-lined lot in the heart of Fayetteville! This well-maintained home offers timeless character paired with comfortable living spaces and thoughtful updates throughout. Step inside to a warm and inviting living room featuring beautiful floors, abundant natural light, and an easy flow into the adjoining flex space perfect for a home office, sitting area, or dining room. The bright kitchen offers ample cabinet storage, stylish backsplash accents, and convenient access to the laundry area. The generously sized bedrooms provide comfort and versatility, while the classic brick exterior, covered carport, and mature landscaping add curb appeal and c
Key facts
- Flex space
- Covered carport
- Mature landscaping
Tags
Property features AI
Exterior
- Parking: Attached carport; One covered parking space; One carport space
- Utilities: Public water; Holding tank and septic sewer
- Home design: Single family residence; Residential property
- Construction: Brick veneer construction
- Exterior features: Lot in KENDALL subdivision; Zoned SF10 (Single Family Residential)
Interior
- Kitchen: Refrigerator; Range
- Flooring: Hardwood; Laminate; Tile; Vinyl
- Bathrooms: One full bathroom; One half bathroom
- Heating & cooling: Heat pump
- Interior features: Eat-in kitchen; Crawl space basement
- Laundry & utility: Washer hookup
Neighborhood map
What this means for you Summary
Snapshot
- This is a 3-bed/2.0-bath single-family listed at $180k.
Deal economics
- At list price, monthly cash flow is $-5 ($-56/yr) — negative.
- To cash-flow at today's rent, offer at most $179k (0.5% below list).
- To meet the 1% rule (rent ≥ 1% of price), the offer needs to be $150k (16.8% below list).
- Recommended offer: $150k (16.8% below list) — sets the bar for 1% rule.
- Cap rate 6.3% vs local median 4.9% in Fayetteville — meaningfully above typical; check what's discounted (condition, days-on-market, listing class) to confirm the premium yield is real.
Location & tenants
- Location reads 75/100 on livability (#45 in NC, #4,031 nationally) — a middle-class / working-renter tenant base. Strengths: commute A+, cost of living A+, housing A+; Watch: crime F, employment D-.
- Cumberland County Schools (urban): math 32% / reading 41% proficiency, ranked #126 of 178 in NC (top 71%) — families likely to look elsewhere, expect single-tenant / working-renter base with shorter leases.
- Zoned schools: Westover Middle (math 20% / reading 30%, grade F, #396 of 475 statewide, top 84%, 784 students, 100% FRL); Westover High (math 42% / reading 39%, grade F, #387 of 535 statewide, top 73%, 1,202 students, 100% FRL) — zoned schools average 100% FRL vs 55% district-wide (45 pts higher); higher-poverty schools than district average — tighter screening recommended.
- Market conditions: Rents rising (+3.1%/yr); 429 active listings in the ZIP; 37 comparable units currently listed for rent nearby; rentals at typical pace (median 21d on market — plan ~3-4 weeks tenant-placement turnaround); 1,125 units permitted in Cumberland County in 2024 (104 in 5+ unit buildings).
Forward outlook
- Local home prices are declining (-3.0%/yr); year-one equity from $1k of loan paydown is wiped out by about $5k of value loss. Plan a longer hold.
Negotiation context
- It's been on market 35 days — a 3% lower offer ($175k) is reasonable based on typical stale-listing flexibility.
- 7 sale attempts since 8y ago with the ask held roughly flat each time — persistent listings suggest the price (not the market) is what's stuck; bring a comps-based counter.
Risks & watch-outs
- Climate carrying-cost: major wind risk, 73% chance of damaging wind over 30y; extreme-heat days projected 7→16/yr by 2055 (HVAC capex compounding) — expect insurance premiums to compound above CPI over the hold.
Questions for the listing agent
- What do current leases actually rent for vs. the listed asking? Can we see a recent rent roll and the last 12 months of T-12 income?
- It's been on market 35 days. Have you received any prior offers? Is the seller open to a 17% concession, seller financing, or rate buy-down credit?
- Built in 1966 — when were the roof, HVAC, electrical panel, plumbing, and water heater last replaced?
- Is there a deadline driving the sale (1031 exchange, divorce, estate, relocation)? That informs how much negotiation room exists.
- Crime grade is F in this area — have there been break-ins, vandalism, or insurance claims at this property in the last 3 years? What carrier currently insures it and at what premium?
- The area grade is low — what's the realistic commute time and amenity access for the typical tenant pool here? Any planned neighborhood developments (good or bad) we should know about?
- What's the average days-on-market for RENTAL listings here right now (not sales)? A rising rental-DOM trend means longer vacancies and softer asking-rent achievability than the comps imply.
- What's the recent tenant-quality profile in this submarket — average credit score on applications, eviction rate, late-payment / NSF rate, and stable-employment percentage? A property-management company in the area should have these aggregated.
- How much new for-sale + rental construction is in the pipeline within 1–3 miles? Heavy new supply typically softens prices + rents 12–24 months out; constrained supply supports both.
Investment metrics
- 1% rule
- 0.83% ✗
- Cap rate
- 6.26%
- Cash-on-cash
- -0.11%
- DSCR
- 1.00
- GRM
- 10.0
CMA / ARV
- ARV (on-the-fly)
- $188,265
- Comps found
- 7
Show comp detail 7 sales within ~0.75 mi
| Address | Dist | Beds/Ba | Sqft | Sold | Price | $/sf | Match |
|---|---|---|---|---|---|---|---|
| 221 Lansdowne Rd | 0.69mi | 3/2.0 | 1,145 (-1%) | 2mo | $178,000 | $155 | 65 |
| 120 Old Gate Rd | 0.24mi | 3/2.0 | 1,225 (+6%) | 17mo | $185,900 | $152 | 64 |
| 403 Lotus Dr | 0.23mi | 3/2.0 | 1,277 (+11%) | 16mo | $208,465 | $163 | 59 |
| 5615 Nix Rd | 0.60mi | 3/2.0 | 1,191 (+3%) | 16mo | $235,000 | $197 | 54 |
| 341 Lynhurst Dr | 0.74mi | 3/2.0 | 1,044 (-10%) | 2mo | $193,000 | $185 | 48 |
| 235 Lansdowne Rd | 0.72mi | 3/1.5 | 1,262 (+9%) | 13mo | $182,500 | $145 | 38 |
| 5324 Sierra Ct | 0.74mi | 3/2.0 | 1,318 (+14%) | 8mo | $220,000 | $167 | 36 |
Match score weights: distance 35% · size 25% · config 20% · recency 20%. Top-matched comps best support the ARV.
Projected returns pro-forma
-3.0% appreciation · 3.11% rent growth · sell at horizon
- IRR
- -16.4%
- Equity multiple
- 0.42×
- Total profit
- $-29,309
- Equity at exit
- $26,839
- IRR
- -7.9%
- Equity multiple
- 0.50×
- Total profit
- $-25,267
- Equity at exit
- $15,563
Cash invested: $50,400 (down + closing). Projections, not guarantees.
Landlord ↔ Tenant lean methodology
- Overall (STATE)
- 85 Strongly Landlord-Friendly
- State North Carolina
- 85 Strongly Landlord-Friendly · R+3
- County
- — inherits STATE
- City
- — inherits STATE
ZIP-level market 28314
- Home prices YoY
- -15.7%
- Rents YoY
- 3.1%
- Active inventory
- 429
- Price-to-rent
- 10.0×
Monthly cashflow live
- Estimated rent
- $1,498 high interval (Pro) →
- Mortgage (P&I)
- −$944
- Tax from tax record
- −$169 /mo · $2,027/yr
- Insurance
- −$75
- HOA
- −$0
- Vacancy / Maint / Mgmt
- −$315
- Net cashflow
- $-5
Break-even live
UW: 25.0% down · 7.5% · 30yr · 1.5% tax · 5.0% vac · 8.0% maint · 8.0% mgmt
Financing live
Cash to close
- Down payment
- $45,000
- Closing costs
- $5,400
- Reserves months
- —
- Total cash needed
- —
Loan-product check · same deal, 3 products live
Conventional
25% down · 7.5% · 30yr
- Down + closing
- —
- Monthly P&I
- —
- Monthly cashflow
- —
- DSCR
- —
- Eligible?
- —
Personal DTI + credit; lowest rate.
DSCR
20% down · 8.5% · 30yr
- Down + closing
- —
- Monthly P&I
- —
- Monthly cashflow
- —
- DSCR
- —
- Eligible?
- —
No personal income docs; deal must DSCR.
Hard money
10% down · 12.0% · 12mo
- Down + closing
- —
- Monthly P&I
- —
- Monthly cashflow
- —
- DSCR
- —
- Eligible?
- —
Short-term bridge; refi at stabilization.
Rent comps 37 comps
| Address | Beds | Baths | Sqft | Rent | $/sqft | DOM | Units | Dist |
|---|---|---|---|---|---|---|---|---|
| 5200 Mawood St Fayetteville, NC | 3.0 | 2.0 | 1300 | $1,500 | $1.15 | 13d | 1 | 0.18mi |
| 295 Warton Ln Fayetteville, NC | 3.0 | 2.0 | 1307 | $1,325 | $1.01 | 13d | 1 | 0.27mi |
| 349 Waterdown Dr #5 Fayetteville, NC | 3.0 | 2.0 | 1307 | $1,350 | $1.03 | 23d | 1 | 0.35mi |
| 267 Waterdown Dr Fayetteville, NC | 3.0 | 2.0 | 1307 | $1,325 | $1.01 | 23d | 1 | 0.36mi |
| 513 Lumberly Ln Fayetteville, NC | 2.0 | 2.0 | 1124 | $1,295 | $1.15 | 23d | 1 | 0.48mi |
| 3311 Woodhill Ln Fayetteville, NC | 1.0–3.0 | 1.0–2.0 | 1195 | $1,730 | $1.45 | 13d | 42 | 0.52mi |
| 5591 Bellflower St Fayetteville, NC | 3.0 | 2.0 | 1273 | $1,575 | $1.24 | 13d | 1 | 0.54mi |
| 5508 Faith Dr Fayetteville, NC | 1.0–3.0 | 1.5–3.0 | 1106 | $1,439 | $1.30 | 13d | 10 | 0.56mi |
| 5508 Faith Dr Fayetteville, NC | 1.0–3.0 | 1.5–3.0 | 1106 | $1,439 | $1.30 | 21d | 16 | 0.56mi |
| 230 Sawtooth Dr Fayetteville, NC | 1.0–3.0 | 1.0–2.0 | 1040 | $1,550 | $1.49 | 13d | 14 | 0.59mi |
| 246 Partners Way Fayetteville, NC | 2.0 | 2.0 | 1100 | $1,295 | $1.18 | 23d | 1 | 0.63mi |
| 5725 Ivanhoe Ct Fayetteville, NC | 1.0–3.0 | 1.0–2.0 | 962 | $1,300 | $1.35 | 13d | 6 | 0.64mi |
| 5650 Netherfield Pl Fayetteville, NC | 1.0–3.0 | 1.0–2.0 | 1025 | $1,410 | $1.37 | 13d | 38 | 0.78mi |
| 425 Windermere Dr Fayetteville, NC | 2.0 | 1.0 | 900 | $950 | $1.06 | 23d | 1 | 0.91mi |
| 5414 Plateau Rd Fayetteville, NC | 3.0 | 2.0 | 1116 | $1,595 | $1.43 | 23d | 1 | 0.96mi |
| 5410 Laramie Ct Fayetteville, NC | 3.0 | 2.0 | 1446 | $1,600 | $1.11 | 13d | 1 | 1.01mi |
| 622 Dashland Dr Unit B Fayetteville, NC | 2.0 | 1.5 | 750 | $940 | $1.25 | 13d | 1 | 1.04mi |
| 3374 Starboard Way Fayetteville, NC | 3.0 | 2.5 | 1481 | $2,150 | $1.45 | 13d | 1 | 1.11mi |
| 2056 Wheeling St Fayetteville, NC | 3.0 | 2.5 | 1401 | $1,595 | $1.14 | 23d | 1 | 1.12mi |
| 3330 Harbour Pointe Pl #12 Fayetteville, NC | 3.0 | 2.0 | 1401 | $1,700 | $1.21 | 13d | 1 | 1.14mi |
| 425 Woodstream Trl Fayetteville, NC | 1.0–2.0 | 1.0–1.5 | 810 | $1,330 | $1.64 | 23d | 12 | 1.23mi |
| 301 Barcelona Dr Fayetteville, NC | 1.0–2.0 | 1.0–2.0 | 845 | $1,326 | $1.57 | 13d | 58 | 1.26mi |
| 4981 Galveston Dr Fayetteville, NC | 2.0 | 1.5 | 750 | $1,050 | $1.40 | 23d | 1 | 1.26mi |
| 4627 Keg Ct Fayetteville, NC | 3.0 | 1.5 | 1272 | $1,300 | $1.02 | 23d | 1 | 1.31mi |
| 5713 Waterwood Dr Fayetteville, NC | 3.0 | 2.0 | 1440 | $1,650 | $1.15 | 21d | 1 | 1.31mi |
| 1000 Antietam Crk Dr Fayetteville, NC | 3.0 | 1.0–2.0 | 1059 | $1,700 | $1.61 | 23d | 14 | 1.31mi |
| 4916 Schmidt St Fayetteville, NC | 2.0 | 1.0 | 801 | $945 | $1.18 | 23d | 1 | 1.36mi |
| 5761 Waterwood Dr Fayetteville, NC | 3.0 | 2.0 | 1452 | $1,600 | $1.10 | 21d | 1 | 1.36mi |
| 1981 Wheeling St Fayetteville, NC | 3.0 | 2.0 | 1400 | $1,500 | $1.07 | 23d | 1 | 1.36mi |
| 421 Squirrel St Unit A Fayetteville, NC | 2.0 | 1.0 | 780 | $900 | $1.15 | 23d | 1 | 1.38mi |
| 409 Tradewinds Dr Fayetteville, NC | 1.0–2.0 | 1.0–2.0 | 867 | $1,195 | $1.38 | 13d | 16 | 1.40mi |
| 6033 Santa Fe Dr Fayetteville, NC | 3.0 | 1.5 | 1325 | $1,500 | $1.13 | 23d | 1 | 1.42mi |
| 812 Crescent Commons Way Fayetteville, NC | 1.0–2.0 | 1.0–2.0 | 963 | $1,385 | $1.44 | 13d | 10 | 1.45mi |
| 600 Scotia Ln Fayetteville, NC | 1.0–3.0 | 1.0–2.0 | 1070 | $1,380 | $1.29 | 13d | 29 | 1.46mi |
| 4547 Chambersburg Rd Fayetteville, NC | 3.0 | 1.5 | 1198 | $1,500 | $1.25 | 23d | 1 | 1.48mi |
| 5831 Waters Edge Dr Fayetteville, NC | 3.0 | 2.0 | 1344 | $1,545 | $1.15 | 23d | 1 | 1.49mi |
| 1160 Windham Ct Fayetteville, NC | 2.0 | 2.5 | 1200 | $1,250 | $1.04 | 23d | 1 | 1.50mi |
Listing history 23 events
-
2026-06-18days on market $180,000 Active 35 DOM
-
2026-06-17days on market $180,000 Active 34 DOM
-
2026-06-16days on market $180,000 Active 33 DOM
-
2026-06-15days on market $180,000 Active 32 DOM
-
2026-06-14days on market $180,000 Active 30 DOM
-
2026-06-13days on market $180,000 Active 29 DOM
-
2026-06-10days on market $180,000 Active 27 DOM
-
2026-06-09days on market $180,000 Active 26 DOM
-
2026-06-08days on market $180,000 Active 25 DOM
-
2026-06-07days on market $180,000 Active 24 DOM
-
2026-06-03days on market $180,000 Active 20 DOM
-
2026-06-02days on market $180,000 Active 19 DOM
-
2026-06-01days on market $180,000 Active 18 DOM
-
2026-05-31days on market $180,000 Active 17 DOM
-
2026-05-30days on market $180,000 Active 16 DOM
-
2026-05-14$180,000 Active
-
2025-10-13$210,000 Active
-
2019-04-22$71,000
-
2019-04-22$71,000
-
2019-04-19$71,000
-
2019-02-28historical
-
2018-04-24$71,000
-
2018-04-24$71,000
ⓘ Source: listings_history table (triggers on properties + properties_extension) + one-shot
backfill from property_details.listing_events for pre-trigger history.
Tax reassessment forecast NC · Resets to sale price
- Current annual tax
- $2,027 · $169/mo
- Projected year-2 tax
- $2,027 · $169/mo
- Expected delta
- $0/yr ($0/mo · 0.0%)
ⓘ Screening estimate from a state-policy table — verify with the county assessor before closing.
Climate risk First Street
- Flood 1/10 Low FEMA zone X (unshaded) · 0% chance over 30 yrs
- Wildfire 1/10 Low
- Heat 7/10 Severe 7 d/yr ≥107°F today · 16 d/yr by 30 yrs out
- Wind 6/10 Major 73% chance of damaging wind over 30 yrs
- Air quality 2/10 Low 0 unhealthy d/yr today · 1 by 30 yrs out
Nearby sold comps map
Loading sold comps map…
Walkable amenities ~0.75 mi
Loading nearby amenities…
Taxation est. · year 1
- Rental income
- $17,972
- − Mortgage interest
- −$10,083
- − Property taxes
- −$2,027
- − Insurance
- −$900
- − Repairs & maintenance
- −$1,438
- − Management
- −$1,438
- − Depreciation
- −$5,236
- Taxable loss
- −$3,149
- Est. tax savings @ 24.0%
- +$756
- After-tax cash flow
- $700/yr
For passive investors: Depreciation is non-cash, so a rental often shows a tax loss while cash-flowing — sheltering income. Rental losses are passive: they offset passive income freely, and up to $25,000/yr can offset ordinary (W-2) income if you actively participate and your MAGI is under $100k (phasing out to $0 by $150k); unused losses carry forward. On sale, claimed depreciation is recaptured at up to 25%, and gains may owe capital-gains tax (a 1031 exchange can defer both). Figures are a year-1 estimate at your 24.0% rate — not tax advice; consult a CPA.
Schools (NCES district)
- District
- Cumberland County Schools
- NCES district ID
- 3700011
- Math proficiency
- 32% ▼ -2.00%
- Reading proficiency
- 41% ▼ -1.00%
- Median HH income
- $44,168
- Composite
- 31.0/100
- National rank
- #6096
- State rank
- #126 of 178 in NC
Livability — Fayetteville
- Score
- 75/100
- State rank
- #45
- US rank
- #4031
Category grades
Schools grade is shown separately in the Schools card above.
Census & demographics
- Census place
- Fayetteville, NC
- County
- Cumberland County · 265,314 people
- City population
- 226,118
- Metro
- Fayetteville, NC
- Population (ZIP)
- 55,834
- Household income
- $62,249
- Rent vs Own
- Severe rent burden
- 2511.0
Population outlook (Cumberland County) Hauer SSP2
- Today (2025)
- 330,855 people
- By 2030
- 333,523 · +0.8%
- By 2040
- 335,583 · +1.4%
- By 2050
- 335,325 · +1.4%
- By 2075
- 342,853 · +3.6%
- By 2100
- 340,698 · +3.0%
Race, ethnicity, and origin ACS 2023
- Neighborhood character
- Diverse neighborhood (Simpson 0.67)
- Race & ethnicity
- Black 49% White 25% Hispanic / Latino 16% Two or more races 11% Asian 3%
- Hispanic origin (detail)
- Mexican 5% Puerto Rican 6% Dominican 1%
- Common ancestry
- Slovak 1% Romanian 1% Lithuanian 1%
- Foreign-born
- 9% · Canada, South Korea
- Languages at home
- 84% English-only · Spanish 10% Korean 1% Other Asian/Pacific 1%
Political lean MEDSL · Cumberland
- 2024 margin
- D (+13.4) · D 56.1% · R 42.7% · Other 1.2%
- 2008→2024 swing
- -4.3pp toward R · 2008: 17.7pp · 2024: 13.4pp
- All cycles
- 2024: D+13.4 2020: D+16.6 2016: D+16.0 2012: D+19.7 2008: D+17.7
Not yet ingested
- Civics
- —
Market trends
- HPI YoY
- ▼ -43.20%
- Current HPI
- 231.873
- Rent YoY
- ▲ 3.11%
- Metro
- Fayetteville, NC
- State GDP YoY
- ▲ 3.28%
- F500 in state
- 26
Industry mix (Fortune 500 HQ in NC)
| Industry | F500 HQs | Revenue |
|---|---|---|
| Financial Services | 2 | $213B |
|
||
| Retail | 2 | $95B |
|
||
| Industrial Conglomerate | 1 | $38B |
|
||
| Metals / Steel | 1 | $35B |
|
||
| Utilities | 1 | $30B |
|
||
| Industrial Machinery | 1 | $19B |
|
||
Price history
+153.5% since first listed8 events — show timeline
- 2026-05-14 Listed $180,000 LPRMLS
- 2025-10-13 Listed $210,000 LPRMLS
- 2019-04-22 Listed $71,000 LPRMLS
- 2019-04-22 Listed $71,000 LPRMLS
- 2019-04-19 Listed $71,000 LPRMLS
- 2019-02-28 Listing Removed — TMLS
- 2018-04-24 Listed $71,000 LPRMLS
- 2018-04-24 Listed $71,000 TMLS
Property tax history
+4.9%/yrLatest (2025): $2,027 · +30.5% YoY. Source: county tax records.
Cash-flow waterfall
monthlySold comps — $/sqft
last 12 mo · ≤1 miLoading sold comps…