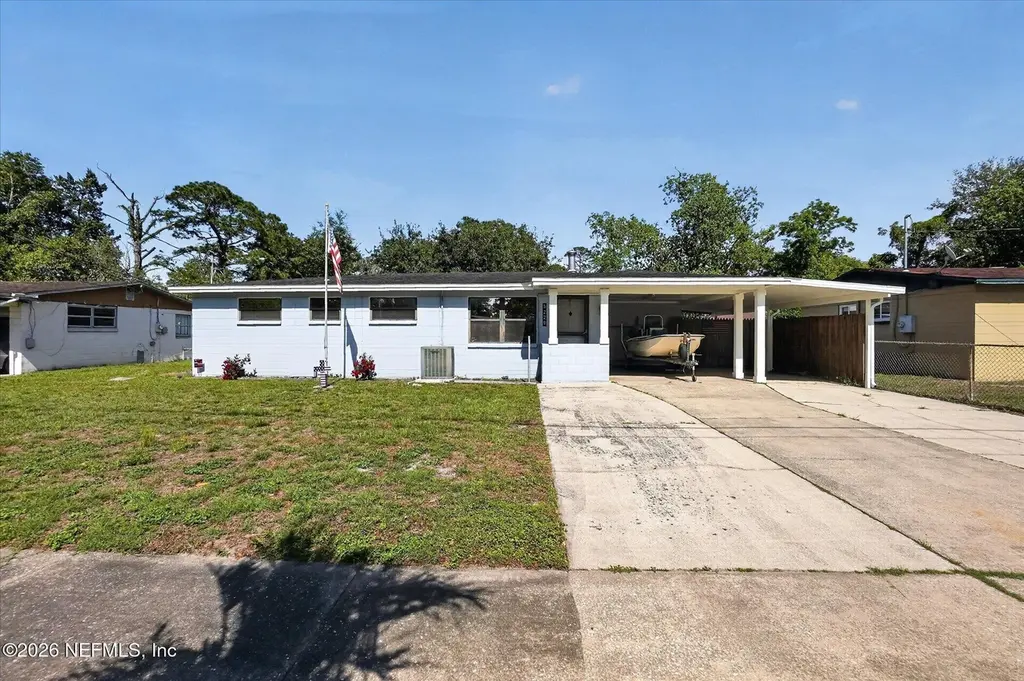
5229 Saginaw Ave · Jacksonville, FL
Flood risk 1/10 · Minimal
- FEMA flood zone
- X (unshaded)
- Chance of flooding over 30 yrs
- 0.0%
- Est. flood insurance / yr
- $507 – $1,088
Fire risk 2/10 · Minimal
- Est. fire insurance / yr
- $947 – $1,759
Heat risk 9/10 · Severe
- Hot days now (above 107°F)
- 7 days/yr
- Hot days in 30 yrs
- 21 days/yr
Wind risk 10/10 · Severe
- Chance of severe wind over 30 yrs
- 99.0%
Air-quality risk 3/10 · Minor
- Unhealthy air days now
- 3 days/yr
- Unhealthy air days in 30 yrs
- 3 days/yr
Risk factors via First Street. Map © Google.
Why this score? — see what drove the D grade
The composite is a weighted blend of 9 inputs, each scored 0–100. Each bar is that input's sub-score; the figure is the points it added to the 100-point composite (weight × sub-score).
- Cash flow +14.9/30.0
- ARV discount +6.9/15.0
- DSCR +4.6/10.0
- Livability +4.2/5.0
- Schools +3.9/10.0
- Rent growth +3.0/5.0
- 1% rule +2.9/10.0
- Condition / age +2.5/5.0
- Appreciation +0.0/10.0
$219,000
🖨 Deal sheet (PDF) 📄 Offer letter ✓ Due diligence
Listing remarks
Back on the market due to buyer financing falling through no fault of the sellers! This one is just plain cute. .. and packed with upgrades! This 4 bedroom 2 bath home has been refreshed from top to bottom with brand new flooring, fresh interior and exterior paint, upgraded bathrooms and plumbing, plus updated light fixtures and outlets throughout, along with new appliances. It's the kind of home that feels easy the second you walk in. But wait until you step outside. .. The detached garage is a dream setup with AC and an overhead crane hoist, perfect for a workshop, hobbies, or extra storage. The fully fenced backyard gives you space to spread out, and the large entertainment pavilion wit
Key facts
- Detached garage
- 2 garage spots
- Built 1966
Tags
Property features AI
Exterior
- Parking: Attached garage; Detached garage; 2 garage spaces; 2 carport spaces; Carport
- Security: Smoke detectors; Carbon monoxide detector
- Utilities: Cable available
- Home design: Single-family residence; One story
- Construction: Brick construction; Shingle roof
- Exterior features: Covered rear porch; Back yard fencing; Shed(s); Workshop; Asphalt road frontage
Interior
- Kitchen: Dishwasher; Electric oven; Microwave; Refrigerator
- Bedrooms: 4 bedrooms (single-level)
- Flooring: Vinyl
- Bathrooms: 2 full bathrooms
- Heating & cooling: Central heat; Central air conditioning
- Interior features: Breakfast nook; Ceiling fans; Pantry; Wood-burning fireplace
- Laundry & utility: In-unit laundry
Neighborhood map
What this means for you Summary
Snapshot
- This is a 4-bed/2.0-bath single-family listed at $219k.
Deal economics
- At list price, monthly cash flow is $64 ($771/yr) — positive.
- The deal already cash-flows at list — no discount required.
- To meet the 1% rule (rent ≥ 1% of price), the offer needs to be $172k (21.4% below list).
- Recommended offer: $172k (21.4% below list) — sets the bar for 1% rule.
- Cap rate 6.6% vs local median 3.9% in Jacksonville — top-decile yield for the area; either an underpriced asset or a hidden risk that comps aren't pricing in. Stress-test before assuming the spread holds.
Location & tenants
- Location reads 83/100 on livability (#50 in FL, #911 nationally) — a professional / high-income tenant draw. Strengths: amenities A+, commute A+, housing A+.
- Duval (urban): math 46% / reading 45% proficiency, ranked #48 of 73 in FL (top 66%) — families likely to look elsewhere, expect single-tenant / working-renter base with shorter leases.
- Zoned schools: Timucuan Elementary School (math 34% / reading 22%, grade F, #1,951 of 2,144 statewide, top 91%, 491 students, 77% FRL); Joseph Stilwell Middle School (math 31% / reading 33%, grade F, #448 of 571 statewide, top 79%, 612 students, 68% FRL); Westside High School (math 26% / reading 19%, grade F, #539 of 667 statewide, top 81%, 1,583 students, 63% FRL) — zoned schools average 70% FRL vs 49% district-wide (20 pts higher); higher-poverty schools than district average — tighter screening recommended.
- Zoned-school proficiency averages 28% at this address vs 46% district-wide (-18 pts) — the specific schools serving this property underperform the Duval average; the district grade overstates school quality for this exact location.
- Market conditions: Rents rising (+2.1%/yr); 441 active listings in the ZIP; 33 comparable units currently listed for rent nearby; rentals leasing fast (median 13d on market — plan ~1-2 weeks tenant-placement turnaround); 6,503 units permitted in Duval County in 2024 (1,131 in 5+ unit buildings).
- This rent runs 34% of the median local income ($61k/yr) — at the standard rent-burdened threshold; future hikes will face affordability resistance.
Forward outlook
- Local home prices are declining (-3.0%/yr); year-one equity from $2k of loan paydown is wiped out by about $7k of value loss. Plan a longer hold.
- Duval County population projected at +19% by 2050 — long-run rental-demand tailwind backs the buy-and-hold thesis.
Negotiation context
- It's been on market 28 days — a 2% lower offer ($216k) is reasonable based on typical stale-listing flexibility.
Risks & watch-outs
- Climate carrying-cost: severe wind risk, 99% chance of damaging wind over 30y; extreme-heat days projected 7→21/yr by 2055 (HVAC capex compounding) — expect insurance premiums to compound above CPI over the hold.
Questions for the listing agent
- Built in 1966 — when were the roof, HVAC, electrical panel, plumbing, and water heater last replaced?
- Is there a deadline driving the sale (1031 exchange, divorce, estate, relocation)? That informs how much negotiation room exists.
- Schools are B-rated — typically a magnet for longer-tenancy family renters. What's the average tenant stay here, and is there a school-zone premium baked into asking?
- The area grade is low — what's the realistic commute time and amenity access for the typical tenant pool here? Any planned neighborhood developments (good or bad) we should know about?
- What's the average days-on-market for RENTAL listings here right now (not sales)? A rising rental-DOM trend means longer vacancies and softer asking-rent achievability than the comps imply.
- What's the recent tenant-quality profile in this submarket — average credit score on applications, eviction rate, late-payment / NSF rate, and stable-employment percentage? A property-management company in the area should have these aggregated.
- How much new for-sale + rental construction is in the pipeline within 1–3 miles? Heavy new supply typically softens prices + rents 12–24 months out; constrained supply supports both.
Investment metrics
- 1% rule
- 0.79% ✗
- Cap rate
- 6.64%
- Cash-on-cash
- 1.26%
- DSCR
- 1.06
- GRM
- 10.6
CMA / ARV
- ARV (on-the-fly)
- $216,216
- Comps found
- 12
Show comp detail 12 sales within ~0.75 mi
| Address | Dist | Beds/Ba | Sqft | Sold | Price | $/sf | Match |
|---|---|---|---|---|---|---|---|
| 5243 Seaboard Ave | 0.06mi | 4/2.0 | 1,008 (-8%) | 1mo | $225,000 | $223 | 84 |
| 5105 Seaboard Ave | 0.16mi | 3/1.5 (-1) | 1,104 (+1%) | 0mo | $165,000 | $149 | 83 |
| 5257 Acoma Ave | 0.12mi | 3/2.0 (-1) | 1,104 (+1%) | 5mo | $218,000 | $197 | 83 |
| 5163 Seaboard Ave | 0.09mi | 3/2.0 (-1) | 1,144 (+5%) | 3mo | $227,000 | $198 | 81 |
| 5216 Timawatha Ave | 0.03mi | 3/1.5 (-1) | 1,203 (+10%) | 4mo | $199,990 | $166 | 72 |
| 5639 Minocqua St | 0.09mi | 4/2.0 | 1,183 (+8%) | 17mo | $229,000 | $194 | 68 |
| 5325 Seaboard Ave | 0.09mi | 3/2.0 (-1) | 1,008 (-8%) | 19mo | $215,000 | $213 | 62 |
| 5819 110th St | 0.64mi | 3/1.0 (-1) | 1,150 (+5%) | 7mo | $175,000 | $152 | 46 |
| 5174 Acre Estates Dr | 0.60mi | 3/2.0 (-1) | 1,180 (+8%) | 13mo | $260,000 | $220 | 43 |
| 6043 Transylvania Ave | 0.67mi | 3/2.0 (-1) | 1,209 (+11%) | 15mo | $249,900 | $207 | 34 |
| 6048 Transylvania Ave | 0.68mi | 3/2.0 (-1) | 943 (-14%) | 16mo | $201,000 | $213 | 27 |
| 5967 Oaklane Dr | 0.71mi | 3/1.0 (-1) | 932 (-15%) | 21mo | $150,000 | $161 | 16 |
Match score weights: distance 35% · size 25% · config 20% · recency 20%. Top-matched comps best support the ARV.
Projected returns pro-forma
-3.0% appreciation · 2.11% rent growth · sell at horizon
- IRR
- -15.2%
- Equity multiple
- 0.46×
- Total profit
- $-33,033
- Equity at exit
- $32,654
- IRR
- -8.1%
- Equity multiple
- 0.51×
- Total profit
- $-30,095
- Equity at exit
- $18,935
Cash invested: $61,320 (down + closing). Projections, not guarantees.
Landlord ↔ Tenant lean methodology
- Overall (STATE)
- 87 Strongly Landlord-Friendly
- State Florida
- 87 Strongly Landlord-Friendly · R+3
- County
- — inherits STATE
- City
- — inherits STATE
ZIP-level market 32210
- Rents YoY
- 2.1%
- Active inventory
- 441
- Price-to-rent
- 10.6×
Monthly cashflow live
- Estimated rent
- $1,721 high interval (Pro) →
- Mortgage (P&I)
- −$1,148
- Tax from tax record
- −$56 /mo · $667/yr
- Insurance
- −$91
- HOA
- −$0
- Vacancy / Maint / Mgmt
- −$361
- Net cashflow
- $64
Break-even live
Sensitivity live
| Price | -10% $188 | -5% $126 | +0% $64 | +5% $2 | +10% $-60 |
|---|---|---|---|---|---|
| Rent | -10% $-72 | -5% $-4 | +0% $64 | +5% $132 | +10% $200 |
| Rate | -1.0pp $175 | -0.5pp $120 | base $64 | +0.5pp $7 | +1.0pp $-50 |
UW: 25.0% down · 7.5% · 30yr · 1.5% tax · 5.0% vac · 8.0% maint · 8.0% mgmt
Financing live
Cash to close
- Down payment
- $54,750
- Closing costs
- $6,570
- Reserves months
- —
- Total cash needed
- —
Loan-product check · same deal, 3 products live
Conventional
25% down · 7.5% · 30yr
- Down + closing
- —
- Monthly P&I
- —
- Monthly cashflow
- —
- DSCR
- —
- Eligible?
- —
Personal DTI + credit; lowest rate.
DSCR
20% down · 8.5% · 30yr
- Down + closing
- —
- Monthly P&I
- —
- Monthly cashflow
- —
- DSCR
- —
- Eligible?
- —
No personal income docs; deal must DSCR.
Hard money
10% down · 12.0% · 12mo
- Down + closing
- —
- Monthly P&I
- —
- Monthly cashflow
- —
- DSCR
- —
- Eligible?
- —
Short-term bridge; refi at stabilization.
Rent comps 33 comps
| Address | Beds | Baths | Sqft | Rent | $/sqft | DOM | Units | Dist |
|---|---|---|---|---|---|---|---|---|
| 5664 Minocqua St Jacksonville, FL | 4.0 | 1.5 | 1023 | $1,545 | $1.51 | 5d | 1 | 0.12mi |
| 5958 Creekside Crossing Dr Jacksonville, FL | 3.0 | 2.5 | 1404 | $1,895 | $1.35 | 12d | 1 | 0.43mi |
| 5984 Creekside Crossing Dr Jacksonville, FL | 3.0 | 2.5 | 1404 | $1,695 | $1.21 | 16d | 1 | 0.45mi |
| 5988 Creekside Crossing Dr Jacksonville, FL | 3.0 | 2.5 | 1404 | $1,850 | $1.32 | 16d | 1 | 0.45mi |
| 5058 Acre Estates Dr W Jacksonville, FL | 3.0 | 2.0 | 1402 | $1,825 | $1.30 | 4d | 1 | 0.51mi |
| 4800 Ortega Farms Blvd Jacksonville, FL | 1.0–3.0 | 1.0 | 880 | $1,465 | $1.66 | 12d | 9 | 0.62mi |
| 4800 Ortega Farms Blvd Jacksonville, FL | 1.0–3.0 | 1.0 | 880 | $1,435 | $1.63 | 4d | 10 | 0.62mi |
| 5327 Timuquana Rd Jacksonville, FL | 1.0–3.0 | 1.0–2.0 | 950 | $1,599 | $1.68 | 3d | 27 | 0.63mi |
| 4455 Confederate Point Rd Jacksonville, FL | 1.0–3.0 | 1.0–2.5 | 1045 | $1,599 | $1.53 | 3d | 19 | 0.81mi |
| 4375 Confederate Point Rd Jacksonville, FL | 1.0–3.0 | 1.0–2.5 | 1125 | $1,536 | $1.37 | 4d | 22 | 0.92mi |
| 4804 Ducheneau Dr Unit 26 Jacksonville, FL | 3.0 | 2.0 | 1182 | $1,635 | $1.38 | 25d | 1 | 0.94mi |
| 6325 Delacy Rd Jacksonville, FL | 4.0 | 2.0 | 1286 | $1,680 | $1.31 | 6d | 1 | 0.98mi |
| 5983 Ortega Lake Dr Unit 1 Jacksonville, FL | 3.0 | 2.5 | 1400 | $1,950 | $1.39 | 25d | 1 | 1.01mi |
| 4301 Confederate Point Rd Jacksonville, FL | 3.0 | 1.0–2.0 | 1042 | $1,606 | $1.54 | 4d | 39 | 1.01mi |
| 6379 Delacy Rd Jacksonville, FL | 3.0 | 1.0 | 1296 | $1,495 | $1.15 | 25d | 1 | 1.04mi |
| 6136 Blanding Blvd Jacksonville, FL | 1.0–3.0 | 1.0–2.0 | 1030 | $2,020 | $1.96 | 3d | 9 | 1.07mi |
| 5939 Pueblo Ct Jacksonville, FL | 4.0 | 2.0 | 1288 | $1,495 | $1.16 | 9d | 1 | 1.09mi |
| 5933 Jammes Rd Jacksonville, FL | 3.0 | 3.0 | 1071 | $1,900 | $1.77 | 25d | 1 | 1.18mi |
| 6511 Burgundy Rd S Jacksonville, FL | 3.0 | 2.0 | 1361 | $1,685 | $1.24 | 5d | 1 | 1.21mi |
| 5931 Wilmar Rd Jacksonville, FL | 4.0 | 1.0 | 706 | $1,095 | $1.55 | 25d | 1 | 1.23mi |
| 6236 Autlan Dr Jacksonville, FL | 3.0 | 2.0 | 1299 | $1,555 | $1.20 | 6d | 1 | 1.29mi |
| 6221 Alfredo Dr W Jacksonville, FL | 3.0 | 2.0 | 1133 | $1,710 | $1.51 | 5d | 1 | 1.30mi |
| 4102 Angol Pl Jacksonville, FL | 3.0 | 2.0 | 1470 | $1,650 | $1.12 | 6d | 1 | 1.31mi |
| 4610 Cedarwood Rd Jacksonville, FL | 3.0 | 1.0 | 1381 | $1,950 | $1.41 | 19d | 1 | 1.32mi |
| 4020 Angol Pl Jacksonville, FL | 3.0 | 1.0 | 1266 | $1,845 | $1.46 | 19d | 1 | 1.33mi |
| 6063 Maggies Cir #110 Jacksonville, FL | 3.0 | 2.0 | 1335 | $1,350 | $1.01 | 6d | 1 | 1.37mi |
| 6063 Maggies Cir Jacksonville, FL | 2.0–3.0 | 2.0 | 1121 | $1,350 | $1.20 | 18d | 2 | 1.37mi |
| 4503 Anvers Blvd Jacksonville, FL | 3.0 | 2.0 | 1084 | $1,595 | $1.47 | 25d | 1 | 1.39mi |
| 6051 Maggies Cir #107 Jacksonville, FL | 3.0 | 2.0 | 1335 | $1,400 | $1.05 | 23d | 1 | 1.40mi |
| 6112 Maggies Cir #108 Jacksonville, FL | 3.0 | 2.0 | 1335 | $1,375 | $1.03 | 25d | 1 | 1.44mi |
| 6111 Maggies Cir #107 Jacksonville, FL | 3.0 | 2.0 | 1335 | $1,350 | $1.01 | 25d | 1 | 1.45mi |
| 6560 Barmer Dr S Jacksonville, FL | 4.0 | 2.0 | 1370 | $1,750 | $1.28 | 3d | 1 | 1.46mi |
| 6094 Maggies Cir #107 Jacksonville, FL | 3.0 | 2.0 | 1335 | $1,425 | $1.07 | 16d | 1 | 1.47mi |
Listing history 11 events
-
2026-06-21days on market $219,000 Active 28 DOM
-
2026-06-18price $219,000 Active 25 DOM
-
2026-06-18days on market $229,000 Active 25 DOM
-
2026-06-17days on market $229,000 Active 24 DOM
-
2026-06-16days on market $229,000 Active 23 DOM
-
2026-06-15days on market $229,000 Active 22 DOM
-
2026-06-13days on market $229,000 Active 20 DOM
-
2026-06-13days on market $229,000 Active 19 DOM
-
2026-06-10status $229,000 Active 16 DOM
-
2026-05-20status Pending
-
2026-05-03$229,000 Active
ⓘ Source: listings_history table (triggers on properties + properties_extension) + one-shot
backfill from property_details.listing_events for pre-trigger history.
Tax reassessment forecast FL · Resets to sale price
- Current annual tax
- $667 · $56/mo
- Projected year-2 tax
- $1,818 · $151/mo
- Expected delta
- +$1,150/yr (+$96/mo · 172.4%)
ⓘ Screening estimate from a state-policy table — verify with the county assessor before closing.
Climate risk First Street
- Flood 1/10 Low FEMA zone X (unshaded) · 0% chance over 30 yrs
- Wildfire 2/10 Low
- Heat 9/10 Extreme 7 d/yr ≥107°F today · 21 d/yr by 30 yrs out
- Wind 10/10 Extreme 99% chance of damaging wind over 30 yrs
- Air quality 3/10 Moderate 3 unhealthy d/yr today · 3 by 30 yrs out
Nearby sold comps map
Loading sold comps map…
Walkable amenities ~0.75 mi
Loading nearby amenities…
Taxation est. · year 1
- Rental income
- $20,651
- − Mortgage interest
- −$12,267
- − Property taxes
- −$667
- − Insurance
- −$1,095
- − Repairs & maintenance
- −$1,652
- − Management
- −$1,652
- − Depreciation
- −$6,371
- Taxable loss
- −$3,054
- Est. tax savings @ 24.0%
- +$733
- After-tax cash flow
- $1,503/yr
For passive investors: Depreciation is non-cash, so a rental often shows a tax loss while cash-flowing — sheltering income. Rental losses are passive: they offset passive income freely, and up to $25,000/yr can offset ordinary (W-2) income if you actively participate and your MAGI is under $100k (phasing out to $0 by $150k); unused losses carry forward. On sale, claimed depreciation is recaptured at up to 25%, and gains may owe capital-gains tax (a 1031 exchange can defer both). Figures are a year-1 estimate at your 24.0% rate — not tax advice; consult a CPA.
Schools (NCES district)
- District
- Duval
- NCES district ID
- 1200480
- Math proficiency
- 46% ▼ -11.00%
- Reading proficiency
- 45% ▼ -4.00%
- Median HH income
- $48,987
- Composite
- 38.97/100
- National rank
- #4076
- State rank
- #48 of 73 in FL
Livability — Jacksonville
- Score
- 83/100
- State rank
- #50
- US rank
- #911
Category grades
Schools grade is shown separately in the Schools card above.
Census & demographics
- Census place
- Jacksonville, FL
- County
- Duval County · 1,015,274 people
- City population
- 979,034
- Metro
- Jacksonville, FL
- Population (ZIP)
- 65,729
- Household income
- $61,050
- Rent vs Own
- Severe rent burden
- 3605.0
Population outlook (Duval County) Hauer SSP2
- Today (2025)
- 1,013,010 people
- By 2030
- 1,059,228 · +4.6%
- By 2040
- 1,141,439 · +12.7%
- By 2050
- 1,205,258 · +19.0%
- By 2075
- 1,324,282 · +30.7%
- By 2100
- 1,319,620 · +30.3%
Race, ethnicity, and origin ACS 2023
- Neighborhood character
- Diverse neighborhood (Simpson 0.65)
- Race & ethnicity
- White 43% Black 38% Hispanic / Latino 10% Two or more races 7% Asian 3%
- Hispanic origin (detail)
- Mexican 3% Puerto Rican 3%
- Common ancestry
- Slovak 2% Hispanic 2% Italian 1%
- Foreign-born
- 10% · Canada, Vietnam, China
- Languages at home
- 86% English-only · Spanish 7% French/Haitian/Cajun 2% Tagalog/Filipino 1%
Political lean MEDSL · Duval
- 2024 margin
- Toss-up / Even · D 48.7% · R 50.1% · Other 1.2%
- 2008→2024 swing
- +0.4pp no change · 2008: -1.9pp · 2024: -1.5pp
- All cycles
- 2024: R+1.5 2020: D+3.8 2016: R+1.5 2012: R+3.6 2008: R+1.9
Not yet ingested
- Civics
- —
Market trends
- HPI YoY
- ▼ -314.81%
- Current HPI
- 281.2688
- Rent YoY
- ▲ 2.11%
- Metro
- Jacksonville, FL
- State GDP YoY
- ▲ 3.28%
- F500 in state
- 36
Industry mix (Fortune 500 HQ in FL)
| Industry | F500 HQs | Revenue |
|---|---|---|
| Industrial Technology | 2 | $29B |
|
||
| Insurance | 2 | $17B |
|
||
| Retail | 1 | $60B |
|
||
| Technology Distribution | 1 | $58B |
|
||
| Homebuilding | 1 | $35B |
|
||
| Technology Manufacturing | 1 | $35B |
|
||
Price history
2 events — show timeline
- 2026-05-20 Pending — realMLS
- 2026-05-03 Listed $229,000 realMLS
Property tax history
+5.9%/yrLatest (2025): $667 · +40.1% YoY. Source: county tax records.
Cash-flow waterfall
monthlySold comps — $/sqft
last 12 mo · ≤1 miLoading sold comps…