 Duplex
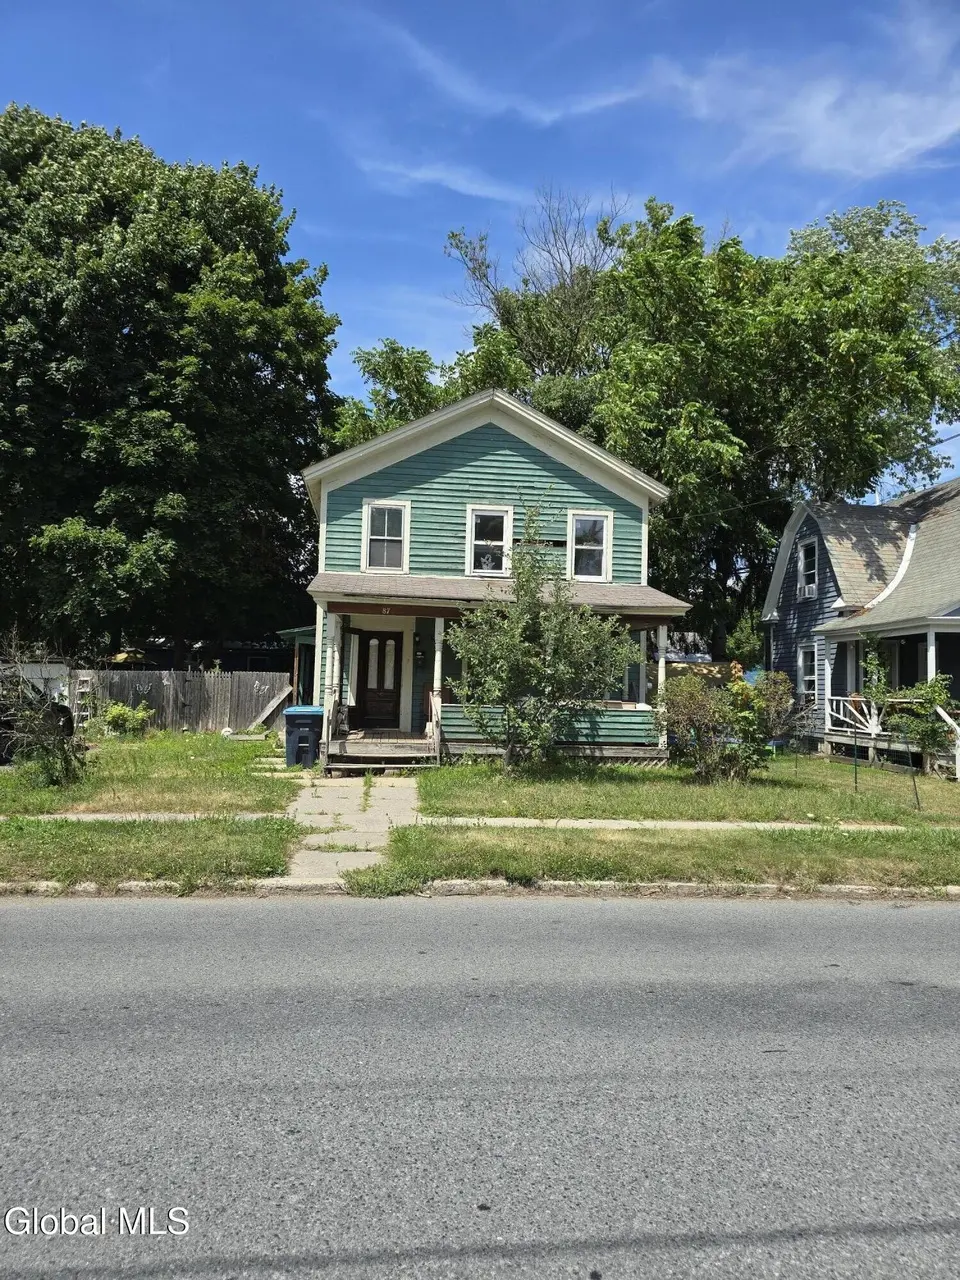
87 John St · Hudson Falls, NY
Flood risk 1/10 · Minimal
- FEMA flood zone
- —
- Chance of flooding over 30 yrs
- 0.0%
- Est. flood insurance / yr
- —
Fire risk 3/10 · Minor
- Est. fire insurance / yr
- $691 – $1,283
Heat risk 3/10 · Minor
- Hot days now (above 96°F)
- 7 days/yr
- Hot days in 30 yrs
- 16 days/yr
Wind risk 2/10 · Minimal
- Chance of severe wind over 30 yrs
- 3.0%
Air-quality risk 1/10 · Minimal
- Unhealthy air days now
- 0 days/yr
- Unhealthy air days in 30 yrs
- 0 days/yr
Risk factors via First Street. Map © Google.
Why this score? — see what drove the B+ grade
The composite is a weighted blend of 9 inputs, each scored 0–100. Each bar is that input's sub-score; the figure is the points it added to the 100-point composite (weight × sub-score).
- Cash flow +30.0/30.0
- 1% rule +10.0/10.0
- DSCR +10.0/10.0
- Appreciation +10.0/10.0
- ARV discount +7.5/15.0
- Schools +3.7/10.0
- Livability +3.5/5.0
- Rent growth +2.5/5.0
- Condition / age +2.5/5.0
$65,000
🖨 Deal sheet 📄 Offer letter ✓ Due diligence
Multi-family units
County records classify this as Multi-Family (2-4 Unit). Listing-text estimate: 2 units. confirmed
Listing remarks MLS
Welcome To 87 John St! This Duplex Is Located In The Heart Of Hudson Falls, Ny. This Parcel Features: - The Top Unit Having One Bedroom And One Bath. - The Bottom Unit Having Two Bedroom And One Bath. - Ample Storage Space Throughout, In Both The Unit's. - Front And Backyard. As Is. Vacant.
Key facts
- Ample storage space
- Front and backyard
- Duplex
Tags
Neighborhood map
What this means for you Summary
Snapshot
- This is a 1×1bd/1ba + 1×2bd/1ba units multifamily listed at $65k.
Deal economics
- At list price, monthly cash flow is $1k ($14k/yr) — positive. Per door: $600/mo.
- The deal already cash-flows at list — no discount required.
- Meets the 1% rule at list price ($2k rent vs $65k).
- Recommended offer: $57k (12.0% below list) — sets the bar for market timing.
- Cap rate 28.5% vs local median 4.3% in Hudson Falls — top-decile yield for the area; either an underpriced asset or a hidden risk that comps aren't pricing in. Stress-test before assuming the spread holds.
Location & tenants
- Location reads 69/100 on livability (#481 in NY) — a middle-class / working-renter tenant base. Strengths: housing A+, health & safety A+, cost of living A-; Watch: schools C-, crime D, employment D.
- Hudson Falls Central School District (suburban): math 39% / reading 47% proficiency, ranked #486 of 590 in NY (top 82%) — families likely to look elsewhere, expect single-tenant / working-renter base with shorter leases.
- Market conditions: 55 active listings in the ZIP; 106 units permitted in Washington County in 2024 (0 in 5+ unit buildings).
Forward outlook
- In year one you build about $7k of equity ($449 loan paydown + $6k appreciation (10.0% local appreciation)).
- Washington County population projected at -20% by 2050 — secular population decline; favor cash flow + early exit over multi-decade hold.
- At projected returns (10.0% appreciation + 3.0% rent growth), your $18k cash investment doubles in ~1 year — after that, you're playing with house money.
- By year 5, paydown + projected appreciation supports a ~$32k cash-out refi (75% LTV) — recoverable capital for the next deal without selling this one.
Negotiation context
- It's been on market 331 days — a 12% lower offer ($57k) is reasonable based on typical stale-listing flexibility.
- 5 sale attempts since 29y ago; this cycle's ask has dropped $15k (19%) from the opening price — seller is motivated, your offer sets the floor, not the list.
Risks & watch-outs
- Watch-outs: property tax is 4.6% of price; built in 1930 — expect roof / HVAC / electrical / plumbing capex.
Questions for the listing agent
- It's been on market 331 days. Have you received any prior offers? Is the seller open to a 12% concession, seller financing, or rate buy-down credit?
- Can we see the unit-by-unit rent roll, current vacancy, and any below-market leases? What's the average tenancy length?
- What capital expenditures (roof, boiler, parking lot, exteriors) have been made in the last 5 years, and what's planned in the next 2?
- Built in 1930 — when were the roof, HVAC, electrical panel, plumbing, and water heater last replaced?
- Property tax is high relative to price — has the assessment been appealed recently, and will the sale trigger a re-assessment?
- Why hasn't it sold? Are there any deal-killer items the seller is aware of (foundation, flood, title, zoning, code violations)?
- Is there a deadline driving the sale (1031 exchange, divorce, estate, relocation)? That informs how much negotiation room exists.
- Crime grade is D in this area — have there been break-ins, vandalism, or insurance claims at this property in the last 3 years? What carrier currently insures it and at what premium?
- What's the average days-on-market for RENTAL listings here right now (not sales)? A rising rental-DOM trend means longer vacancies and softer asking-rent achievability than the comps imply.
- What's the recent tenant-quality profile in this submarket — average credit score on applications, eviction rate, late-payment / NSF rate, and stable-employment percentage? A property-management company in the area should have these aggregated.
- How much new apartment / multifamily construction is in the pipeline within 1–3 miles? Heavy new supply (>2% of stock underway) typically softens rents 12–24 months out; light construction supports rent growth.
Investment metrics
- 1% rule
- 3.54% ✓
- Cap rate
- 28.45%
- Cash-on-cash
- 79.15%
- DSCR
- 4.52
- GRM
- 2.4
CMA / ARV
- ARV (median comp)
- $334,599
- List price
- $65,000
- Delta
- -80.57%
- Verdict
- UNDERPRICED
- Comps
- 20 within 1.0 mi
Show comp detail 2 sales within ~0.75 mi
| Address | Dist | Beds/Ba | Sqft | Sold | Price | $/sf | Match |
|---|---|---|---|---|---|---|---|
| 542 Lower Oak St | 0.36mi | 4/1.0 (+1) | 1,712 (+8%) | 7mo | $289,000 | $169 | 55 |
| 430 Lower Main St | 0.30mi | 4/2.0 (+1) | 1,813 (+14%) | 22mo | $160,000 | $88 | 39 |
Match score weights: distance 35% · size 25% · config 20% · recency 20%. Top-matched comps best support the ARV.
Projected returns pro-forma
10.0% appreciation · 3.0% rent growth · sell at horizon
- IRR
- 89.2%
- Equity multiple
- 7.15×
- Total profit
- $111,994
- Equity at exit
- $58,557
- IRR
- 84.0%
- Equity multiple
- 15.83×
- Total profit
- $269,954
- Equity at exit
- $126,281
Cash invested: $18,200 (down + closing). Projections, not guarantees.
Landlord ↔ Tenant lean methodology
- Overall (STATE)
- 15 Strongly Tenant-Friendly
- State New York
- 15 Strongly Tenant-Friendly · D+10
- County
- — inherits STATE
- City
- — inherits STATE
ZIP-level market 12839
- Home prices YoY
- 8.5%
- Active inventory
- 55
- Price-to-rent
- 4.7×
Monthly cashflow live
- Estimated rent
- $2,300 medium interval (Pro) →
- Mortgage (P&I)
- −$341
- Tax from tax record
- −$249 /mo · $2,983/yr
- Insurance
- −$27
- HOA
- −$0
- Vacancy / Maint / Mgmt
- −$483
- Net cashflow
- $1,200
Break-even live
2-unit breakdown (identical units grouped — click to expand)
| Units | Beds | Baths | Est. rent |
|---|---|---|---|
| 1× unit | 1 | 1 | $1,150 |
| 1× unit | 2 | 1 | $1,150 |
| Total (2 units) | $2,300 | ||
UW: 25.0% down · 7.5% · 30yr · 1.5% tax · 5.0% vac · 8.0% maint · 8.0% mgmt
Financing live
Cash to close
- Down payment
- $16,250
- Closing costs
- $1,950
- Reserves months
- —
- Total cash needed
- —
Loan-product check · same deal, 3 products live
Conventional
25% down · 7.5% · 30yr
- Down + closing
- —
- Monthly P&I
- —
- Monthly cashflow
- —
- DSCR
- —
- Eligible?
- —
Personal DTI + credit; lowest rate.
DSCR
20% down · 8.5% · 30yr
- Down + closing
- —
- Monthly P&I
- —
- Monthly cashflow
- —
- DSCR
- —
- Eligible?
- —
No personal income docs; deal must DSCR.
Hard money
10% down · 12.0% · 12mo
- Down + closing
- —
- Monthly P&I
- —
- Monthly cashflow
- —
- DSCR
- —
- Eligible?
- —
Short-term bridge; refi at stabilization.
Listing history 29 events
-
2026-06-18days on market $65,000 Active 331 DOM
-
2026-06-17days on market $65,000 Active 330 DOM
-
2026-06-16days on market $65,000 Active 329 DOM
-
2026-06-15days on market $65,000 Active 328 DOM
-
2026-06-14days on market $65,000 Active 326 DOM
-
2026-06-13days on market $65,000 Active 325 DOM
-
2026-06-10days on market $65,000 Active 323 DOM
-
2026-06-09days on market $65,000 Active 322 DOM
-
2026-06-08days on market $65,000 Active 321 DOM
-
2026-06-07days on market $65,000 Active 320 DOM
-
2026-06-03days on market $65,000 Active 316 DOM
-
2026-06-02days on market $65,000 Active 315 DOM
-
2026-06-01days on market $65,000 Active 314 DOM
-
2026-05-31days on market $65,000 Active 313 DOM
-
2026-05-31days on market $65,000 Active 312 DOM
-
2026-04-23price $65,000 312-char remark
Show marketing remark (312 chars)
Welcome To 87 John St! This Duplex Is Located In The Heart Of Hudson Falls, Ny. This Parcel Features: - The Top Unit Having One Bedroom And One Bath. - The Bottom Unit Having Two Bedroom And One Bath. - Ample Storage Space Throughout, In Both The Unit's. - Front And Backyard. As Is. Vacant.
-
2026-01-20price $69,900 312-char remark
Show marketing remark (312 chars)
Welcome To 87 John St! This Duplex Is Located In The Heart Of Hudson Falls, Ny. This Parcel Features: - The Top Unit Having One Bedroom And One Bath. - The Bottom Unit Having Two Bedroom And One Bath. - Ample Storage Space Throughout, In Both The Unit's. - Front And Backyard. As Is. Vacant.
-
2025-07-23$79,900 Active 312-char remark
Show marketing remark (312 chars)
Welcome To 87 John St! This Duplex Is Located In The Heart Of Hudson Falls, Ny. This Parcel Features: - The Top Unit Having One Bedroom And One Bath. - The Bottom Unit Having Two Bedroom And One Bath. - Ample Storage Space Throughout, In Both The Unit's. - Front And Backyard. As Is. Vacant.
-
2005-09-21soldstatus $57,500
-
2003-06-01historical
-
2002-08-26$49,000
-
2002-06-01historical
-
2001-10-25$48,850
-
1999-08-18soldstatus $52,000
-
1999-07-28soldstatus $52,000
-
1999-04-09$62,000
-
1998-11-27soldstatus $21,000
-
1998-11-13historical
-
1997-11-13$44,921
ⓘ Source: listings_history table (triggers on properties + properties_extension) + one-shot
backfill from property_details.listing_events for pre-trigger history.
Tax reassessment forecast NY · Partial reset (capped growth)
- Current annual tax
- $2,983 · $249/mo
- Projected year-2 tax
- $2,983 · $249/mo
- Expected delta
- $0/yr ($0/mo · 0.0%)
ⓘ Screening estimate from a state-policy table — verify with the county assessor before closing.
Climate risk First Street
- Flood 1/10 Low 0% chance over 30 yrs
- Wildfire 3/10 Moderate
- Heat 3/10 Moderate 7 d/yr ≥96°F today · 16 d/yr by 30 yrs out
- Wind 2/10 Low 3% chance of damaging wind over 30 yrs
- Air quality 1/10 Low 0 unhealthy d/yr today · 0 by 30 yrs out
Nearby sold comps map
Loading sold comps map…
Walkable amenities ~0.75 mi
Loading nearby amenities…
Taxation est. · year 1
- Rental income
- $27,600
- − Mortgage interest
- −$3,641
- − Property taxes
- −$2,983
- − Insurance
- −$325
- − Repairs & maintenance
- −$2,208
- − Management
- −$2,208
- − Depreciation
- −$1,891
- Taxable income
- $14,344
- Est. tax owed @ 24.0%
- −$3,442
- After-tax cash flow
- $10,963/yr
For passive investors: Depreciation is non-cash, so a rental often shows a tax loss while cash-flowing — sheltering income. Rental losses are passive: they offset passive income freely, and up to $25,000/yr can offset ordinary (W-2) income if you actively participate and your MAGI is under $100k (phasing out to $0 by $150k); unused losses carry forward. On sale, claimed depreciation is recaptured at up to 25%, and gains may owe capital-gains tax (a 1031 exchange can defer both). Figures are a year-1 estimate at your 24.0% rate — not tax advice; consult a CPA.
Schools (NCES district)
- District
- Hudson Falls Central School District
- NCES district ID
- 3614970
- Math proficiency
- 39% ▼ -8.00%
- Reading proficiency
- 47% ▲ 6.00%
- Median HH income
- $46,019
- Composite
- 36.57/100
- National rank
- #4635
- State rank
- #486 of 590 in NY
Livability — Hudson Falls
- Score
- 69/100
- State rank
- #481
- US rank
- #8482
Category grades
Schools grade is shown separately in the Schools card above.
Census & demographics
- Census place
- Hudson Falls, NY
- Population (ZIP)
- 13,618
Population outlook (Washington County) Hauer SSP2
- Today (2025)
- 59,576 people
- By 2030
- 57,618 · -3.3%
- By 2040
- 52,751 · -11.5%
- By 2050
- 47,514 · -20.2%
- By 2075
- 35,690 · -40.1%
- By 2100
- 24,807 · -58.4%
Race, ethnicity, and origin ACS 2023
- Neighborhood character
- Predominantly White (89%)
- Race & ethnicity
- White 89% Hispanic / Latino 4% Two or more races 4%
- Common ancestry
- Lithuanian 8% Slovak 5% Estonian 3%
- Foreign-born
- 5% · Canada, Guatemala
- Languages at home
- 92% English-only · Spanish 4% Other Indo-European 2% German/W. Germanic 2%
Political lean MEDSL · Washington
- 2024 margin
- Strong R (+21.2) · D 39.4% · R 60.6%
- 2008→2024 swing
- -22.0pp toward R · 2008: 0.8pp · 2024: -21.2pp
- All cycles
- 2024: R+21.2 2020: R+15.6 2016: R+20.2 2012: D+1.6 2008: D+0.8
Not yet ingested
- Civics
- —
Market trends
- HPI YoY
- ▲ 25.92%
- Current HPI
- 331.6315
- Rent YoY
- —
- Metro
- —
- State GDP YoY
- ▲ 2.60%
- F500 in state
- 92
Industry mix (Fortune 500 HQ in NY)
| Industry | F500 HQs | Revenue |
|---|---|---|
| Financial Services | 10 | $950B |
|
||
| Consumer Goods | 9 | $162B |
|
||
| Insurance | 4 | $225B |
|
||
| Telecommunications | 2 | $144B |
|
||
| Pharmaceuticals | 2 | $112B |
|
||
| Media / Entertainment | 2 | $69B |
|
||
Price history
+44.7% since first listed14 events — show timeline
- 2026-04-23 Price Changed $65,000 Global MLS
- 2026-01-20 Price Changed $69,900 Global MLS
- 2025-07-23 Listed $79,900 Global MLS
- 2005-09-21 Sold (Public Records) $57,500 Public Records
- 2003-06-01 Listing Removed — Global MLS
- 2002-08-26 Listed $49,000 Global MLS
- 2002-06-01 Listing Removed — Global MLS
- 2001-10-25 Listed $48,850 Global MLS
- 1999-08-18 Sold (Public Records) $52,000 Public Records
- 1999-07-28 Sold (MLS) $52,000 Global MLS
- 1999-04-09 Listed $62,000 Global MLS
- 1998-11-27 Sold (Public Records) $21,000 Public Records
- 1998-11-13 Listing Removed — Global MLS
- 1997-11-13 Listed $44,921 Global MLS
Property tax history
+4.5%/yrLatest (2025): $2,983 · +6.3% YoY. Source: county tax records.
Cash-flow waterfall
monthlySold comps — $/sqft
last 12 mo · ≤1 miLoading sold comps…