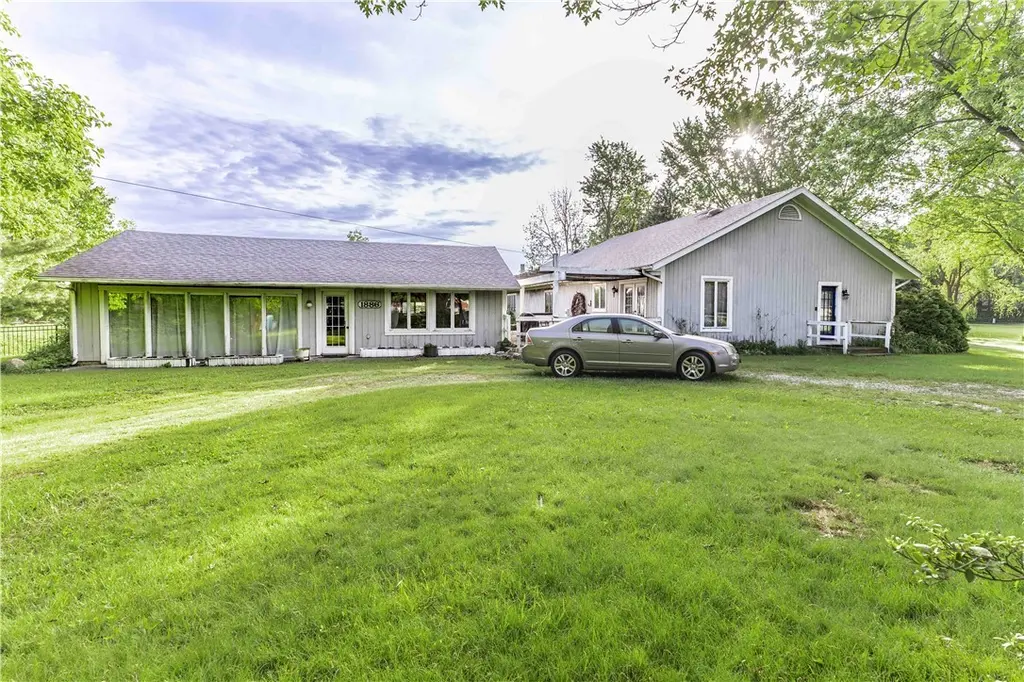
1886 Hanes Rd · Beavercreek, OH
Flood risk 1/10 · Minimal
- FEMA flood zone
- X (unshaded)
- Chance of flooding over 30 yrs
- 0.0%
- Est. flood insurance / yr
- $507 – $1,088
Fire risk 1/10 · Minimal
- Est. fire insurance / yr
- $713 – $1,323
Heat risk 3/10 · Minor
- Hot days now (above 103°F)
- 7 days/yr
- Hot days in 30 yrs
- 18 days/yr
Wind risk 2/10 · Minimal
- Chance of severe wind over 30 yrs
- 1.0%
Air-quality risk 3/10 · Minor
- Unhealthy air days now
- 3 days/yr
- Unhealthy air days in 30 yrs
- 4 days/yr
Risk factors via First Street. Map © Google.
Why this score? — see what drove the B grade
The composite is a weighted blend of 9 inputs, each scored 0–100. Each bar is that input's sub-score; the figure is the points it added to the 100-point composite (weight × sub-score).
- Cash flow +30.0/30.0
- 1% rule +10.0/10.0
- DSCR +10.0/10.0
- ARV discount +7.5/15.0
- Schools +6.6/10.0
- Livability +4.4/5.0
- Rent growth +2.5/5.0
- Condition / age +2.5/5.0
- Appreciation +0.0/10.0
$150,000
🖨 Deal sheet 📄 Offer letter ✓ Due diligence
Listing remarks
Opportunity with endless potential at 1886 Hanes Rd! This unique property is a major project but offers a rare setup with what was reportedly previously considered a grandfathered two-dwelling configuration. Buyers to perform their own due diligence regarding zoning, permitted use, and future possibilities. The main house features 4 bedrooms with plumbing in place for 3 full bathrooms. The large primary suite includes a walk-in closet, oversized en suite bath, and private access to a spacious covered deck. Two additional bedrooms also feature their own private deck access. On the opposite side of the home, another large deck provides additional entertaining space. Previous owner had plans t
Key facts
- 0.69 acre lot
- Built 1948
Tags
Property features AI
Finance
- Financial info: Offered for sale
Exterior
- Parking: No garage
- Utilities: Has heating; Has cooling
- Home design: Single-story; Frame construction with wood siding
- Construction: Frame construction; Wood siding
- Exterior features: Deck; Residential zoning
Interior
- Bathrooms: Three full bathrooms (all on the main level)
- Heating & cooling: Baseboard heating; Window air conditioning units
- Interior features: High-speed internet; Walk-in closet(s)
- Laundry & utility: Electric water heater
Neighborhood map
What this means for you Summary
Snapshot
- This is a 3-bed/1.0-bath single-family listed at $150k.
Deal economics
- At list price, monthly cash flow is $564 ($7k/yr) — positive.
- The deal already cash-flows at list — no discount required.
- Meets the 1% rule at list price ($2k rent vs $150k).
- Cap rate 10.8% vs local median 3.3% in Beavercreek — top-decile yield for the area; either an underpriced asset or a hidden risk that comps aren't pricing in. Stress-test before assuming the spread holds.
Location & tenants
- Location reads 88/100 on livability (#26 in OH, #239 nationally) — a professional / high-income tenant draw. Strengths: schools A+, employment A+, cost of living A+; Watch: commute F.
- Beavercreek City (suburban): math 70% / reading 78% proficiency, ranked #79 of 656 in OH (top 12%) — strong family-tenant draw, lease renewals of 3-5y typical; only 10% free/reduced lunch — higher-income household profile.
- Market conditions: 45 active listings in the ZIP; 3 comparable units currently listed for rent nearby; rentals at typical pace (median 24d on market — plan ~3-4 weeks tenant-placement turnaround); solid renter incomes; 797 units permitted in Greene County in 2024 (148 in 5+ unit buildings).
- This rent runs 33% of the median local income ($83k/yr) — at the standard rent-burdened threshold; future hikes will face affordability resistance.
Forward outlook
- Local home prices are declining (-3.0%/yr); year-one equity from $1k of loan paydown is wiped out by about $4k of value loss. Plan a longer hold.
- At projected returns (-3.0% appreciation + 3.0% rent growth), your $42k cash investment doubles in ~8 years — after that, you're playing with house money.
Negotiation context
- Only 1 days on market — expect competitive offers; lowballing is unlikely to land.
- Current owner paid $35k; list at $150k implies a 329% gain — meaningful room to come down on a strong offer.
Risks & watch-outs
- Watch-outs: property tax is 3.0% of price; built in 1948 — expect roof / HVAC / electrical / plumbing capex.
Questions for the listing agent
- Built in 1948 — when were the roof, HVAC, electrical panel, plumbing, and water heater last replaced?
- Property tax is high relative to price — has the assessment been appealed recently, and will the sale trigger a re-assessment?
- Is there a deadline driving the sale (1031 exchange, divorce, estate, relocation)? That informs how much negotiation room exists.
- Schools are A-rated — typically a magnet for longer-tenancy family renters. What's the average tenant stay here, and is there a school-zone premium baked into asking?
- What's the average days-on-market for RENTAL listings here right now (not sales)? A rising rental-DOM trend means longer vacancies and softer asking-rent achievability than the comps imply.
- What's the recent tenant-quality profile in this submarket — average credit score on applications, eviction rate, late-payment / NSF rate, and stable-employment percentage? A property-management company in the area should have these aggregated.
- How much new for-sale + rental construction is in the pipeline within 1–3 miles? Heavy new supply typically softens prices + rents 12–24 months out; constrained supply supports both.
Investment metrics
- 1% rule
- 1.51% ✓
- Cap rate
- 10.81%
- Cash-on-cash
- 16.12%
- DSCR
- 1.72
- GRM
- 5.5
CMA / ARV
- ARV (on-the-fly)
- $331,916
- Comps found
- 12
Show comp detail 12 sales within ~0.75 mi
| Address | Dist | Beds/Ba | Sqft | Sold | Price | $/sf | Match |
|---|---|---|---|---|---|---|---|
| 1886 Hanes Rd | 0.00mi | 4/3.0 (+1) | 1,964 (0%) | 0mo | $179,000 | $91 | 87 |
| 3081 Claydor Dr | 0.32mi | 3/2.0 | 1,932 (-2%) | 12mo | $270,000 | $140 | 68 |
| 3009 Highlander Dr | 0.24mi | 3/2.5 | 2,130 (+8%) | 3mo | $359,900 | $169 | 66 |
| 2100 Crab Tree Dr | 0.56mi | 4/2.0 (+1) | 2,095 (+7%) | 1mo | $349,250 | $167 | 53 |
| 2159 Prudence Dr | 0.71mi | 3/2.0 | 2,031 (+3%) | 5mo | $345,000 | $170 | 53 |
| 2826 Greenridge Cir | 0.52mi | 3/2.0 | 1,804 (-8%) | 9mo | $395,000 | $219 | 50 |
| 3193 Meadowlark Pl | 0.39mi | 4/2.5 (+1) | 2,256 (+15%) | 2mo | $425,000 | $188 | 45 |
| 1651 N Laddie Ct | 0.48mi | 4/2.5 (+1) | 2,232 (+14%) | 1mo | $359,900 | $161 | 43 |
| 3069 Windmill Dr | 0.74mi | 4/2.0 (+1) | 2,002 (+2%) | 13mo | $360,000 | $180 | 43 |
| 2725 Terraceview Cir | 0.70mi | 3/2.0 | 1,770 (-10%) | 8mo | $412,000 | $233 | 41 |
| 3189 Claydor Dr | 0.51mi | 4/2.5 (+1) | 2,184 (+11%) | 8mo | $333,000 | $152 | 40 |
| 1520 Hillside Dr | 0.69mi | 4/3.0 (+1) | 2,167 (+10%) | 3mo | $364,000 | $168 | 35 |
Match score weights: distance 35% · size 25% · config 20% · recency 20%. Top-matched comps best support the ARV.
Projected returns pro-forma
-3.0% appreciation · 3.0% rent growth · sell at horizon
- IRR
- 7.2%
- Equity multiple
- 1.28×
- Total profit
- $11,770
- Equity at exit
- $22,365
- IRR
- 16.5%
- Equity multiple
- 2.36×
- Total profit
- $57,123
- Equity at exit
- $12,969
Cash invested: $42,000 (down + closing). Projections, not guarantees.
Landlord ↔ Tenant lean methodology
- Overall (STATE)
- 73 Landlord-Friendly
- State Ohio
- 73 Landlord-Friendly · R+6
- County
- — inherits STATE
- City
- — inherits STATE
ZIP-level market 45432
- Active inventory
- 45
- Price-to-rent
- 5.5×
Monthly cashflow live
- Estimated rent
- $2,268 medium interval (Pro) →
- Mortgage (P&I)
- −$787
- Tax from tax record
- −$378 /mo · $4,541/yr
- Insurance
- −$62
- HOA
- −$0
- Vacancy / Maint / Mgmt
- −$476
- Net cashflow
- $564
Break-even live
UW: 25.0% down · 7.5% · 30yr · 1.5% tax · 5.0% vac · 8.0% maint · 8.0% mgmt
Financing live
Cash to close
- Down payment
- $37,500
- Closing costs
- $4,500
- Reserves months
- —
- Total cash needed
- —
Loan-product check · same deal, 3 products live
Conventional
25% down · 7.5% · 30yr
- Down + closing
- —
- Monthly P&I
- —
- Monthly cashflow
- —
- DSCR
- —
- Eligible?
- —
Personal DTI + credit; lowest rate.
DSCR
20% down · 8.5% · 30yr
- Down + closing
- —
- Monthly P&I
- —
- Monthly cashflow
- —
- DSCR
- —
- Eligible?
- —
No personal income docs; deal must DSCR.
Hard money
10% down · 12.0% · 12mo
- Down + closing
- —
- Monthly P&I
- —
- Monthly cashflow
- —
- DSCR
- —
- Eligible?
- —
Short-term bridge; refi at stabilization.
Rent comps 3 comps
| Address | Beds | Baths | Sqft | Rent | $/sqft | DOM | Units | Dist |
|---|---|---|---|---|---|---|---|---|
| 3033 Stardust Dr Beavercreek, OH | 3.0 | 2.0 | 1620 | $2,295 | $1.42 | 3d | 1 | 0.21mi |
| 1605 N Fairfield Rd Unit Na Dayton, OH | 3.0 | 3.5 | 1600 | $1,950 | $1.22 | 43d | 1 | 0.90mi |
| 2188 Pine Knott Dr Beavercreek, OH | 4.0 | 2.0 | 1803 | $2,450 | $1.36 | 23d | 1 | 0.92mi |
Listing history 3 events
-
2026-05-19status Pending
-
2026-05-18$150,000 Active
-
1977-05-12soldstatus $35,000
ⓘ Source: listings_history table (triggers on properties + properties_extension) + one-shot
backfill from property_details.listing_events for pre-trigger history.
Tax reassessment forecast OH · Partial reset (capped growth)
- Current annual tax
- $4,541 · $378/mo
- Projected year-2 tax
- $4,541 · $378/mo
- Expected delta
- $0/yr ($0/mo · 0.0%)
ⓘ Screening estimate from a state-policy table — verify with the county assessor before closing.
Climate risk First Street
- Flood 1/10 Low FEMA zone X (unshaded) · 0% chance over 30 yrs
- Wildfire 1/10 Low
- Heat 3/10 Moderate 7 d/yr ≥103°F today · 18 d/yr by 30 yrs out
- Wind 2/10 Low 100% chance of damaging wind over 30 yrs
- Air quality 3/10 Moderate 3 unhealthy d/yr today · 4 by 30 yrs out
Nearby sold comps map
Loading sold comps map…
Walkable amenities ~0.75 mi
Loading nearby amenities…
Taxation est. · year 1
- Rental income
- $27,214
- − Mortgage interest
- −$8,402
- − Property taxes
- −$4,541
- − Insurance
- −$750
- − Repairs & maintenance
- −$2,177
- − Management
- −$2,177
- − Depreciation
- −$4,364
- Taxable income
- $4,803
- Est. tax owed @ 24.0%
- −$1,153
- After-tax cash flow
- $5,616/yr
For passive investors: Depreciation is non-cash, so a rental often shows a tax loss while cash-flowing — sheltering income. Rental losses are passive: they offset passive income freely, and up to $25,000/yr can offset ordinary (W-2) income if you actively participate and your MAGI is under $100k (phasing out to $0 by $150k); unused losses carry forward. On sale, claimed depreciation is recaptured at up to 25%, and gains may owe capital-gains tax (a 1031 exchange can defer both). Figures are a year-1 estimate at your 24.0% rate — not tax advice; consult a CPA.
Schools (NCES district)
- District
- Beavercreek City
- NCES district ID
- 3904724
- Math proficiency
- 70% ▼ -9.00%
- Reading proficiency
- 78% ▼ -1.00%
- Median HH income
- $80,251
- Composite
- 65.55/100
- National rank
- #469
- State rank
- #79 of 656 in OH
Livability — Beavercreek
- Score
- 88/100
- State rank
- #26
- US rank
- #239
Category grades
Schools grade is shown separately in the Schools card above.
Census & demographics
- Census place
- Beavercreek, OH
- County
- Greene · 199,376 people
- City population
- 27,951
- Metro
- Dayton-Kettering-Beavercreek, OH
- Population (ZIP)
- 14,988
- Household income
- $83,323
- Rent vs Own
- Severe rent burden
- 9.8
Population outlook (Greene County) Hauer SSP2
- Today (2025)
- 170,301 people
- By 2030
- 171,840 · +0.9%
- By 2040
- 171,408 · +0.7%
- By 2050
- 167,806 · -1.5%
- By 2075
- 154,430 · -9.3%
- By 2100
- 138,669 · -18.6%
Race, ethnicity, and origin ACS 2023
- Neighborhood character
- Predominantly White (84%)
- Race & ethnicity
- White 84% Two or more races 7% Asian 3% Black 3% Hispanic / Latino 3%
- Common ancestry
- Romanian 4% Slovak 3% Italian 2%
- Foreign-born
- 4% · Canada, India
- Languages at home
- 94% English-only · Spanish 2% Other Indo-European 2% German/W. Germanic 1%
Political lean MEDSL · Greene
- 2024 margin
- R (+19.8) · D 39.5% · R 59.3% · Other 1.2%
- 2008→2024 swing
- -1.4pp toward R · 2008: -18.4pp · 2024: -19.8pp
- All cycles
- 2024: R+19.8 2020: R+19.5 2016: R+24.5 2012: R+21.8 2008: R+18.4
Not yet ingested
- Civics
- —
Market trends
- HPI YoY
- ▼ -187.81%
- Current HPI
- 290.3859
- Rent YoY
- —
- Metro
- —
- State GDP YoY
- ▲ 1.98%
- F500 in state
- 48
Industry mix (Fortune 500 HQ in OH)
| Industry | F500 HQs | Revenue |
|---|---|---|
| Insurance | 3 | $145B |
|
||
| Industrial Machinery | 3 | $49B |
|
||
| Financial Services | 3 | $24B |
|
||
| Consumer Goods | 2 | $93B |
|
||
| Aerospace / Defense | 2 | $47B |
|
||
| Utilities | 2 | $33B |
|
||
Price history
+328.6% since first listed3 events — show timeline
- 2026-05-19 Pending — Dayton MLS
- 2026-05-18 Listed $150,000 Dayton MLS
- 1977-05-12 Sold (Public Records) $35,000 Public Records
Property tax history
+4.6%/yrLatest (2025): $4,541 · +0.5% YoY. Source: county tax records.
Cash-flow waterfall
monthlySold comps — $/sqft
last 12 mo · ≤1 miLoading sold comps…