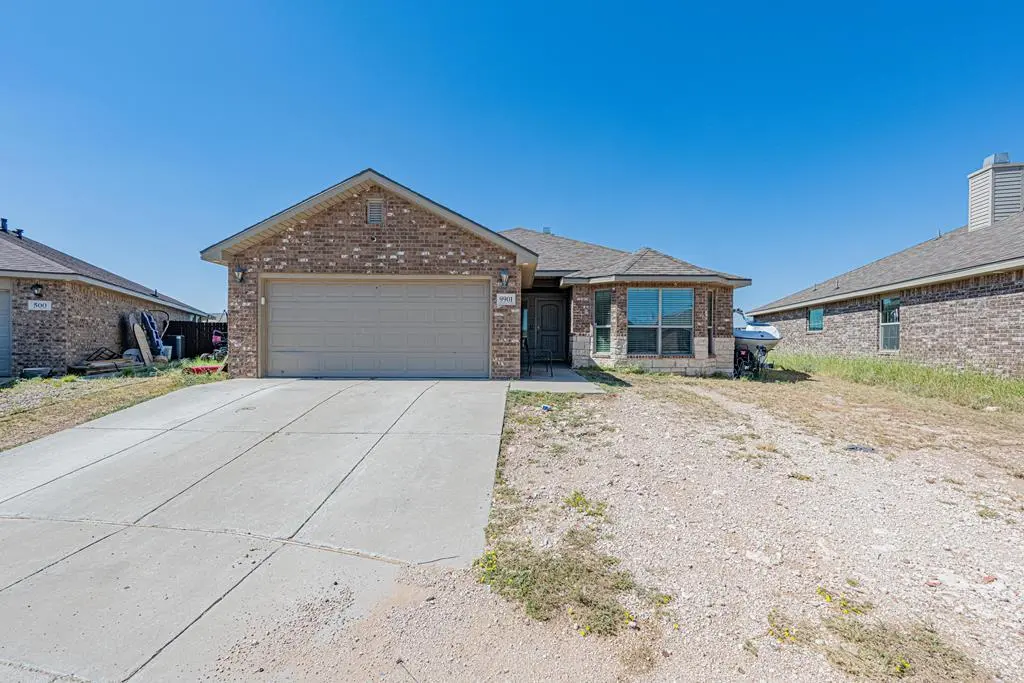
9901 Mccraw Dr · Odessa, TX
Flood risk 1/10 · Minimal
- FEMA flood zone
- X (unshaded)
- Chance of flooding over 30 yrs
- 0.0%
- Est. flood insurance / yr
- $507 – $1,088
Fire risk 7/10 · Major
- Est. fire insurance / yr
- $1,222 – $2,270
Heat risk 6/10 · Moderate
- Hot days now (above 101°F)
- 7 days/yr
- Hot days in 30 yrs
- 22 days/yr
Wind risk 2/10 · Minimal
- Chance of severe wind over 30 yrs
- 3.0%
Air-quality risk 1/10 · Minimal
- Unhealthy air days now
- 0 days/yr
- Unhealthy air days in 30 yrs
- 0 days/yr
Risk factors via First Street. Map © Google.
Why this score? — see what drove the D grade
The composite is a weighted blend of 9 inputs, each scored 0–100. Each bar is that input's sub-score; the figure is the points it added to the 100-point composite (weight × sub-score).
- Cash flow +17.1/30.0
- DSCR +5.3/10.0
- 1% rule +4.3/10.0
- Livability +3.8/5.0
- ARV discount +3.6/15.0
- Rent growth +2.6/5.0
- Condition / age +2.5/5.0
- Schools +2.2/10.0
- Appreciation +0.0/10.0
$269,900
🖨 Deal sheet (PDF) 📄 Offer letter ✓ Due diligence
Listing remarks MLS
Beautiful 3B/2B home! This home comes with all Granite countertops in kitchen and Bathrooms, FLOORING throughout!! The Master Bedroom has his and hers walking closet. All Bedrooms are good sizes. Schedule your showing today
Key facts
- Wood flooring
- Walking closet
- Granite countertops
Tags
Neighborhood map
What this means for you Summary
Snapshot
- This is a 3-bed/2.0-bath single-family listed at $270k.
Deal economics
- At list price, monthly cash flow is $188 ($2k/yr) — positive.
- The deal already cash-flows at list — no discount required.
- To meet the 1% rule (rent ≥ 1% of price), the offer needs to be $251k (6.9% below list).
- Recommended offer: $238k (12.0% below list) — sets the bar for market timing.
Location & tenants
- Location reads 75/100 on livability (#132 in TX, #3,928 nationally) — a middle-class / working-renter tenant base. Strengths: cost of living A+, housing A+, health & safety A+; Watch: commute D+, amenities D.
- Ector County ISD (urban): math 22% / reading 27% proficiency, ranked #707 of 826 in TX (top 86%) — low school quality limits family demand, transient renter base, plan for 1-2y turnover.
- Zoned schools: Barbara Jordan El (math 33% / reading 42%, grade F, #1,744 of 4,322 statewide, top 41%, 854 students, 51% FRL); Wilson & Young Medal of Honor Middle (math 14% / reading 31%, grade F, #1,341 of 1,662 statewide, top 82%, 1,245 students, 56% FRL); Permian H S (math 19% / reading 29%, grade F, #1,333 of 1,632 statewide, top 82%, 3,978 students, 51% FRL) — zoned schools at 53% FRL track the district average.
- Market conditions: Rents flat; 433 active listings in the ZIP; 40 comparable units currently listed for rent nearby; rentals lingering (median 46d on market — plan ~5-8 weeks vacancy on turnover, expect pricing pressure); 55% of comp listings sitting > 30 days — soft ceiling on asking rent; solid renter incomes; 1,004 units permitted in Ector County in 2024 (0 in 5+ unit buildings).
Forward outlook
- Local home prices are declining (-3.0%/yr); year-one equity from $2k of loan paydown is wiped out by about $8k of value loss. Plan a longer hold.
- Ector County population projected at +78% by 2050 — long-run rental-demand tailwind backs the buy-and-hold thesis.
Negotiation context
- It's been on market 264 days — a 12% lower offer ($238k) is reasonable based on typical stale-listing flexibility.
- 2 sale attempts with the ask held roughly flat each time — persistent listings suggest the price (not the market) is what's stuck; bring a comps-based counter.
Risks & watch-outs
- Climate carrying-cost: major wildfire risk; extreme-heat days projected 7→22/yr by 2055 (HVAC capex compounding) — expect insurance premiums to compound above CPI over the hold.
Questions for the listing agent
- It's been on market 264 days. Have you received any prior offers? Is the seller open to a 12% concession, seller financing, or rate buy-down credit?
- Why hasn't it sold? Are there any deal-killer items the seller is aware of (foundation, flood, title, zoning, code violations)?
- Is there a deadline driving the sale (1031 exchange, divorce, estate, relocation)? That informs how much negotiation room exists.
- Schools are F-rated, which usually means shorter tenancies and higher turnover. Who's the typical renter profile here, and what's been the actual vacancy rate?
- The area grade is low — what's the realistic commute time and amenity access for the typical tenant pool here? Any planned neighborhood developments (good or bad) we should know about?
- What's the average days-on-market for RENTAL listings here right now (not sales)? A rising rental-DOM trend means longer vacancies and softer asking-rent achievability than the comps imply.
- What's the recent tenant-quality profile in this submarket — average credit score on applications, eviction rate, late-payment / NSF rate, and stable-employment percentage? A property-management company in the area should have these aggregated.
- How much new for-sale + rental construction is in the pipeline within 1–3 miles? Heavy new supply typically softens prices + rents 12–24 months out; constrained supply supports both.
Investment metrics
- 1% rule
- 0.93% ✗
- Cap rate
- 7.13%
- Cash-on-cash
- 2.98%
- DSCR
- 1.13
- GRM
- 8.9
CMA / ARV
- ARV (median comp)
- $248,573
- List price
- $269,900
- Delta
- 8.58%
- Verdict
- FAIR
- Comps
- 2 within 2.0 mi
Projected returns pro-forma
-3.0% appreciation · 0.54% rent growth · sell at horizon
- IRR
- -14.3%
- Equity multiple
- 0.50×
- Total profit
- $-37,842
- Equity at exit
- $40,243
- IRR
- -10.0%
- Equity multiple
- 0.45×
- Total profit
- $-41,273
- Equity at exit
- $23,336
Cash invested: $75,572 (down + closing). Projections, not guarantees.
Landlord ↔ Tenant lean methodology
- Overall (STATE)
- 87 Strongly Landlord-Friendly
- State Texas
- 87 Strongly Landlord-Friendly · R+5
- County
- — inherits STATE
- City
- — inherits STATE
ZIP-level market 79765
- Home prices YoY
- -28.7%
- Rents YoY
- 0.5%
- Active inventory
- 433
- Price-to-rent
- 8.9×
Monthly cashflow live
- Estimated rent
- $2,514 high interval (Pro) →
- Mortgage (P&I)
- −$1,415
- Tax from tax record
- −$270 /mo · $3,239/yr
- Insurance
- −$112
- HOA
- −$0
- Vacancy / Maint / Mgmt
- −$528
- Net cashflow
- $188
Break-even live
Sensitivity live
| Price | -10% $341 | -5% $264 | +0% $188 | +5% $112 | +10% $35 |
|---|---|---|---|---|---|
| Rent | -10% $-11 | -5% $89 | +0% $188 | +5% $287 | +10% $387 |
| Rate | -1.0pp $324 | -0.5pp $257 | base $188 | +0.5pp $118 | +1.0pp $47 |
UW: 25.0% down · 7.5% · 30yr · 1.5% tax · 5.0% vac · 8.0% maint · 8.0% mgmt
Financing live
Cash to close
- Down payment
- $67,475
- Closing costs
- $8,097
- Reserves months
- —
- Total cash needed
- —
Loan-product check · same deal, 3 products live
Conventional
25% down · 7.5% · 30yr
- Down + closing
- —
- Monthly P&I
- —
- Monthly cashflow
- —
- DSCR
- —
- Eligible?
- —
Personal DTI + credit; lowest rate.
DSCR
20% down · 8.5% · 30yr
- Down + closing
- —
- Monthly P&I
- —
- Monthly cashflow
- —
- DSCR
- —
- Eligible?
- —
No personal income docs; deal must DSCR.
Hard money
10% down · 12.0% · 12mo
- Down + closing
- —
- Monthly P&I
- —
- Monthly cashflow
- —
- DSCR
- —
- Eligible?
- —
Short-term bridge; refi at stabilization.
Rent comps 40 comps
| Address | Beds | Baths | Sqft | Rent | $/sqft | DOM | Units | Dist |
|---|---|---|---|---|---|---|---|---|
| 9914 Rainbow Dr Odessa, TX | 4.0 | 2.0 | 2069 | $3,200 | $1.55 | 45d | 1 | 0.09mi |
| 618 Juniper Ct Odessa, TX | 3.0 | 2.0 | 1606 | $2,700 | $1.68 | 15d | 1 | 0.15mi |
| 320 Panhandle Dr Odessa, TX | 3.0 | 2.0 | 1595 | $2,500 | $1.57 | 45d | 1 | 0.20mi |
| 9918 Lamar Ave Odessa, TX | 3.0 | 2.0 | 1596 | $2,400 | $1.50 | 15d | 1 | 0.21mi |
| 713 E 96th St Odessa, TX | 3.0 | 2.0 | 1564 | $2,500 | $1.60 | 45d | 1 | 0.26mi |
| 10310 Creek St Odessa, TX | 3.0 | 2.0 | 1238 | $2,300 | $1.86 | 15d | 1 | 0.28mi |
| 301 Panhandle Dr Odessa, TX | 4.0 | 2.0 | 2050 | $2,950 | $1.44 | 45d | 1 | 0.29mi |
| 10306 Sheriff St Odessa, TX | 3.0 | 2.0 | 1240 | $2,050 | $1.65 | 15d | 1 | 0.29mi |
| 310 E 95th St Odessa, TX | 3.0 | 2.0 | 1390 | $2,300 | $1.65 | 23d | 1 | 0.31mi |
| 819 E 97th Ct Odessa, TX | 3.0 | 2.0 | 1635 | $2,350 | $1.44 | 15d | 1 | 0.35mi |
| 808 E 96th St Odessa, TX | 3.0 | 2.0 | 1474 | $2,350 | $1.59 | 45d | 1 | 0.37mi |
| 401 Farmstead Ln Odessa, TX | 3.0 | 2.0 | 1390 | $2,500 | $1.80 | 45d | 1 | 0.39mi |
| 900 E 96th St Odessa, TX | 3.0 | 2.0 | 1644 | $2,300 | $1.40 | 45d | 1 | 0.43mi |
| 9219 Holiday Dr Odessa, TX | 3.0 | 2.5 | 2118 | $2,800 | $1.32 | 45d | 1 | 0.47mi |
| 404 Pratt Dr Odessa, TX | 4.0 | 2.0 | 1700 | $2,800 | $1.65 | 45d | 1 | 0.47mi |
| 800 E 92nd St Odessa, TX | 3.0 | 2.0 | 2005 | $2,550 | $1.27 | 45d | 1 | 0.56mi |
| 1306 E 94th St Odessa, TX | 3.0 | 2.0 | 1488 | $2,350 | $1.58 | 23d | 1 | 0.71mi |
| 1109 Wagon Way Odessa, TX | 3.0 | 2.0 | 1515 | $2,400 | $1.58 | 15d | 1 | 0.73mi |
| 1303 Terra Cotta St Odessa, TX | 3.0 | 2.0 | 1377 | $1,999 | $1.45 | 45d | 1 | 0.74mi |
| 216 E 91st St Odessa, TX | 3.0 | 3.0 | 1602 | $2,500 | $1.56 | 15d | 1 | 0.80mi |
| 9017 Pepper Grass Ave Odessa, TX | 3.0 | 2.0 | 1778 | $2,500 | $1.41 | 45d | 1 | 0.85mi |
| 1025 Pine Leaf Pl Odessa, TX | 3.0 | 2.0 | 1411 | $2,200 | $1.56 | 45d | 1 | 0.88mi |
| 1226 E 92nd St Odessa, TX | 3.0 | 2.0 | 1526 | $2,250 | $1.47 | 15d | 1 | 0.94mi |
| 9031 Antelope Ave Odessa, TX | 3.0 | 2.0 | 1923 | $2,500 | $1.30 | 45d | 1 | 0.97mi |
| 1023 E 90th St Odessa, TX | 3.0 | 2.0 | 1760 | $2,500 | $1.42 | 15d | 1 | 1.09mi |
| 1028 E 90th St Odessa, TX | 3.0 | 2.0 | 1461 | $2,145 | $1.47 | 15d | 1 | 1.11mi |
| 8732 Rainbow Dr Odessa, TX | 3.0 | 2.0 | 1573 | $2,400 | $1.53 | 45d | 1 | 1.14mi |
| 1210 E 89th St Odessa, TX | 3.0 | 2.0 | 1582 | $2,600 | $1.64 | 45d | 1 | 1.20mi |
| 1218 E 89th St Odessa, TX | 3.0 | 2.0 | 1667 | $2,400 | $1.44 | 23d | 1 | 1.23mi |
| 915 Canal St Odessa, TX | 4.0 | 2.0 | 2080 | $3,100 | $1.49 | 23d | 1 | 1.26mi |
| 1320 E 89th St Odessa, TX | 3.0 | 2.0 | 1450 | $2,800 | $1.93 | 45d | 1 | 1.31mi |
| 8623 Holiday Dr Odessa, TX | 3.0 | 2.0 | 1231 | $1,800 | $1.46 | 45d | 1 | 1.31mi |
| 1115 Canal St Odessa, TX | 3.0 | 2.0 | 1833 | $2,400 | $1.31 | 45d | 1 | 1.32mi |
| 1102 Canal St Odessa, TX | 4.0 | 2.0 | 2095 | $2,600 | $1.24 | 23d | 1 | 1.33mi |
| 8633 Yale Ave Odessa, TX | 3.0 | 2.0 | 1371 | $2,500 | $1.82 | 15d | 1 | 1.36mi |
| 8633 Yale Ave Odessa, TX | 3.0 | 2.0 | 1390 | $2,500 | $1.80 | 23d | 1 | 1.36mi |
| 8610 Lamar Ave Unit NA Odessa, TX | 3.0 | 2.0 | 1700 | $2,200 | $1.29 | 15d | 1 | 1.36mi |
| 1327 Masquerade Blvd Odessa, TX | 3.0 | 2.0 | 1377 | $2,700 | $1.96 | 46d | 1 | 1.40mi |
| 908 Purdue St Odessa, TX | 3.0 | 2.0 | 1480 | $2,500 | $1.69 | 45d | 1 | 1.43mi |
| 912 Purdue St Odessa, TX | 3.0 | 2.0 | 1773 | $2,400 | $1.35 | 45d | 1 | 1.44mi |
Listing history 18 events
-
2026-06-21days on market $269,900 Active 264 DOM
-
2026-06-19days on market $269,900 Active 262 DOM
-
2026-06-18days on market $269,900 Active 261 DOM
-
2026-06-17days on market $269,900 Active 260 DOM
-
2026-06-16days on market $269,900 Active 259 DOM
-
2026-06-15days on market $269,900 Active 258 DOM
-
2026-06-14days on market $269,900 Active 256 DOM
-
2026-06-13days on market $269,900 Active 255 DOM
-
2026-06-10days on market $269,900 Active 253 DOM
-
2026-06-09days on market $269,900 Active 252 DOM
-
2026-06-08days on market $269,900 Active 251 DOM
-
2026-06-07days on market $269,900 Active 250 DOM
-
2026-06-03days on market $269,900 Active 245 DOM
-
2026-06-01days on market $269,900 Active 244 DOM
-
2026-05-31days on market $269,900 Active 243 DOM
-
2026-05-30days on market $269,900 Active 242 DOM
-
2025-10-01$269,000 Active 223-char remark
Show marketing remark (223 chars)
Beautiful 3B/2B home! This home comes with all Granite countertops in kitchen and Bathrooms, FLOORING throughout!! The Master Bedroom has his and hers walking closet. All Bedrooms are good sizes. Schedule your showing today
-
2025-09-30$269,900 Active 223-char remark
Show marketing remark (223 chars)
Beautiful 3B/2B home! This home comes with all Granite countertops in kitchen and Bathrooms, FLOORING throughout!! The Master Bedroom has his and hers walking closet. All Bedrooms are good sizes. Schedule your showing today
ⓘ Source: listings_history table (triggers on properties + properties_extension) + one-shot
backfill from property_details.listing_events for pre-trigger history.
Tax reassessment forecast TX · Resets to sale price
- Current annual tax
- $3,239 · $270/mo
- Projected year-2 tax
- $4,939 · $412/mo
- Expected delta
- +$1,700/yr (+$142/mo · 52.5%)
ⓘ Screening estimate from a state-policy table — verify with the county assessor before closing.
Climate risk First Street
- Flood 1/10 Low FEMA zone X (unshaded) · 0% chance over 30 yrs
- Wildfire 7/10 Severe
- Heat 6/10 Major 7 d/yr ≥101°F today · 22 d/yr by 30 yrs out
- Wind 2/10 Low 3% chance of damaging wind over 30 yrs
- Air quality 1/10 Low 0 unhealthy d/yr today · 0 by 30 yrs out
Nearby sold comps map
Loading sold comps map…
Walkable amenities ~0.75 mi
Loading nearby amenities…
Taxation est. · year 1
- Rental income
- $30,163
- − Mortgage interest
- −$15,119
- − Property taxes
- −$3,239
- − Insurance
- −$1,350
- − Repairs & maintenance
- −$2,413
- − Management
- −$2,413
- − Depreciation
- −$7,852
- Taxable loss
- −$2,222
- Est. tax savings @ 24.0%
- +$533
- After-tax cash flow
- $2,789/yr
For passive investors: Depreciation is non-cash, so a rental often shows a tax loss while cash-flowing — sheltering income. Rental losses are passive: they offset passive income freely, and up to $25,000/yr can offset ordinary (W-2) income if you actively participate and your MAGI is under $100k (phasing out to $0 by $150k); unused losses carry forward. On sale, claimed depreciation is recaptured at up to 25%, and gains may owe capital-gains tax (a 1031 exchange can defer both). Figures are a year-1 estimate at your 24.0% rate — not tax advice; consult a CPA.
Schools (NCES district)
- District
- Ector County ISD
- NCES district ID
- 4818000
- Math proficiency
- 22% ▼ -9.00%
- Reading proficiency
- 27% ▼ -4.00%
- Median HH income
- $52,740
- Composite
- 21.89/100
- National rank
- #8233
- State rank
- #707 of 826 in TX
Livability — Odessa
- Score
- 75/100
- State rank
- #132
- US rank
- #3928
Category grades
Schools grade is shown separately in the Schools card above.
Census & demographics
- Census place
- Odessa, TX
- County
- Ector County · 131,169 people
- City population
- 131,169
- Metro
- Odessa, TX
- Population (ZIP)
- 25,904
- Household income
- $104,965
- Rent vs Own
- Severe rent burden
- 884.0
Population outlook (Ector County) Hauer SSP2
- Today (2025)
- 212,765 people
- By 2030
- 241,962 · +13.7%
- By 2040
- 306,582 · +44.1%
- By 2050
- 379,755 · +78.5%
- By 2075
- 568,991 · +167.4%
- By 2100
- 709,829 · +233.6%
Race, ethnicity, and origin ACS 2023
- Neighborhood character
- Diverse neighborhood (Simpson 0.59)
- Race & ethnicity
- Hispanic / Latino 49% White 41% Two or more races 15% Black 5% Asian 3% Native American 1%
- Hispanic origin (detail)
- Mexican 45%
- Common ancestry
- Romanian 1% Slovak 1% Lithuanian 1%
- Foreign-born
- 10% · Canada, China, South Korea
- Languages at home
- 63% English-only · Spanish 31% German/W. Germanic 1% Tagalog/Filipino 1%
Political lean MEDSL · Ector
- 2024 margin
- Solid R (+52.9) · D 23.2% · R 76.1%
- 2008→2024 swing
- -4.9pp toward R · 2008: -48.0pp · 2024: -52.9pp
- All cycles
- 2024: R+52.9 2020: R+47.8 2016: R+40.6 2012: R+48.9 2008: R+48.0
Not yet ingested
- Civics
- —
Market trends
- HPI YoY
- ▼ -69.68%
- Current HPI
- 173.4252
- Rent YoY
- ▲ 0.54%
- Metro
- Odessa, TX
- State GDP YoY
- ▲ 3.95%
- F500 in state
- 110
Industry mix (Fortune 500 HQ in TX)
| Industry | F500 HQs | Revenue |
|---|---|---|
| Energy | 16 | $1,198B |
|
||
| Technology | 5 | $198B |
|
||
| Engineering / Construction | 4 | $72B |
|
||
| Energy Services | 3 | $60B |
|
||
| Utilities | 3 | $41B |
|
||
| Healthcare | 2 | $330B |
|
||
Price history
-0.3% since first listed2 events — show timeline
- 2025-10-01 Listed $269,000 PBBOR
- 2025-09-30 Listed $269,900 ODMLS
Property tax history
-2.6%/yrLatest (2025): $3,239 · -23.9% YoY. Source: county tax records.
Cash-flow waterfall
monthlySold comps — $/sqft
last 12 mo · ≤1 miLoading sold comps…