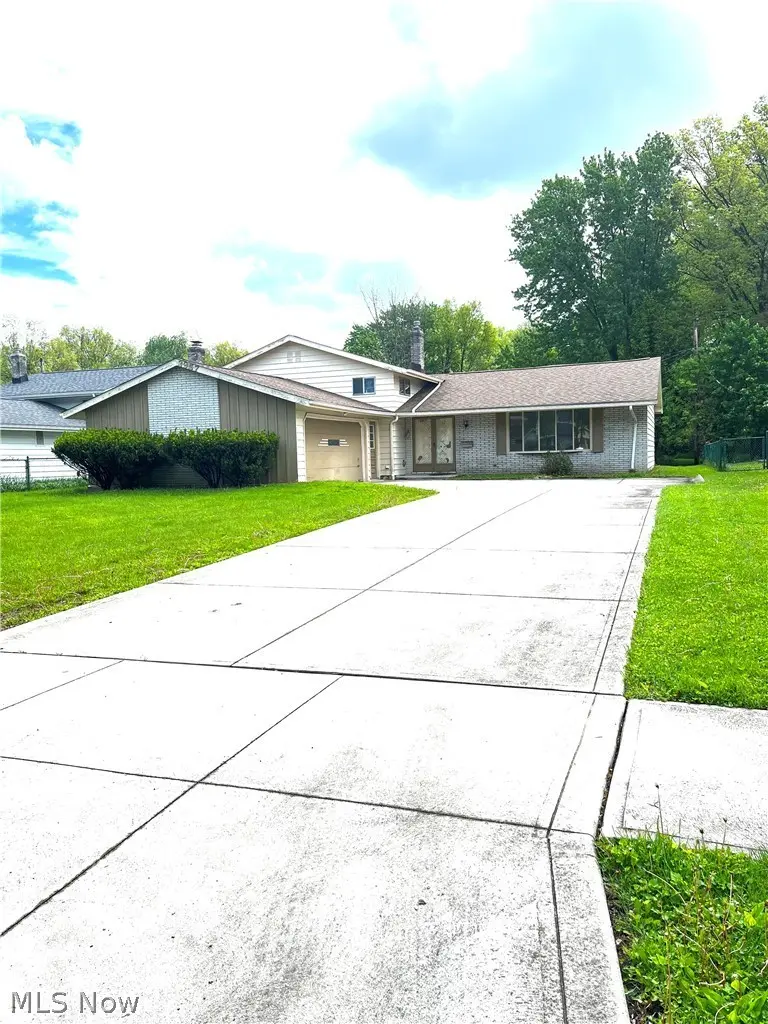
3957 Woodpark Ln · North Olmsted, OH
Flood risk 1/10 · Minimal
- FEMA flood zone
- X (unshaded)
- Chance of flooding over 30 yrs
- 0.0%
- Est. flood insurance / yr
- $507 – $1,088
Fire risk 1/10 · Minimal
- Est. fire insurance / yr
- $713 – $1,323
Heat risk 3/10 · Minor
- Hot days now (above 95°F)
- 7 days/yr
- Hot days in 30 yrs
- 17 days/yr
Wind risk 1/10 · Minimal
- Chance of severe wind over 30 yrs
- —
Air-quality risk 2/10 · Minimal
- Unhealthy air days now
- 1 days/yr
- Unhealthy air days in 30 yrs
- 3 days/yr
Risk factors via First Street. Map © Google.
Why this score? — see what drove the C- grade
The composite is a weighted blend of 9 inputs, each scored 0–100. Each bar is that input's sub-score; the figure is the points it added to the 100-point composite (weight × sub-score).
- ARV discount +15.0/15.0
- Cash flow +12.4/30.0
- Schools +4.7/10.0
- 1% rule +4.6/10.0
- Livability +4.3/5.0
- DSCR +3.7/10.0
- Rent growth +3.0/5.0
- Condition / age +2.5/5.0
- Appreciation +0.0/10.0
$279,900
🖨 Deal sheet 📄 Offer letter ✓ Due diligence
Listing remarks MLS
Spacious L-Shaped Split in quiet development area priced to sell!!Newer Furn, Central Air, h20 tank!!Woodburning fireplace in the family rm!!4 bedrooms!!2 full and one half bath!!Huge utility rm/storage room off garage!!Kitchen appliances stay!!Large utilty/storage room area!!
Key facts
- 0.25 acre lot
- 2 garage spots
- Built 1971
Neighborhood map
What this means for you Summary
Snapshot
- This is a 4-bed/2.5-bath single-family listed at $280k.
Deal economics
- At list price, monthly cash flow is $-48 ($-571/yr) — negative.
- To cash-flow at today's rent, offer at most $271k (3.0% below list).
- To meet the 1% rule (rent ≥ 1% of price), the offer needs to be $269k (3.7% below list).
- Recommended offer: $269k (3.7% below list) — sets the bar for 1% rule.
- Cap rate 6.1% vs local median 4.0% in North Olmsted — top-decile yield for the area; either an underpriced asset or a hidden risk that comps aren't pricing in. Stress-test before assuming the spread holds.
Location & tenants
- Location reads 86/100 on livability (#38 in OH, #372 nationally) — a professional / high-income tenant draw. Strengths: crime A+, amenities A+, employment A+; Watch: commute F.
- North Olmsted City (suburban): math 51% / reading 57% proficiency, ranked #368 of 656 in OH (top 56%) — acceptable for families but not a draw, mixed tenant base, ~2y average lease.
- Market conditions: Rents rising (+1.9%/yr); 159 active listings in the ZIP; 2 comparable units currently listed for rent nearby; solid renter incomes; 1,441 units permitted in Cuyahoga County in 2024 (700 in 5+ unit buildings).
- This rent runs 38% of the median local income ($84k/yr) — at the standard rent-burdened threshold; future hikes will face affordability resistance.
Forward outlook
- Local home prices are declining (-3.0%/yr); year-one equity from $2k of loan paydown is wiped out by about $8k of value loss. Plan a longer hold.
- Cuyahoga County population projected to shrink 8% by 2050 — rents likely to lag national; underwrite the cash flow, not the appreciation.
Negotiation context
- It's been on market 44 days — a 3% lower offer ($272k) is reasonable based on typical stale-listing flexibility.
- 2 sale attempts since 16y ago with the ask held roughly flat each time — persistent listings suggest the price (not the market) is what's stuck; bring a comps-based counter.
- Current owner paid $115k; list at $280k implies a 143% gain — meaningful room to come down on a strong offer.
Risks & watch-outs
- Watch-outs: property tax is 2.5% of price.
Questions for the listing agent
- What do current leases actually rent for vs. the listed asking? Can we see a recent rent roll and the last 12 months of T-12 income?
- It's been on market 44 days. Have you received any prior offers? Is the seller open to a 4% concession, seller financing, or rate buy-down credit?
- Built in 1971 — when were the roof, HVAC, electrical panel, plumbing, and water heater last replaced?
- Property tax is high relative to price — has the assessment been appealed recently, and will the sale trigger a re-assessment?
- Is there a deadline driving the sale (1031 exchange, divorce, estate, relocation)? That informs how much negotiation room exists.
- Schools are B-rated — typically a magnet for longer-tenancy family renters. What's the average tenant stay here, and is there a school-zone premium baked into asking?
- What's the average days-on-market for RENTAL listings here right now (not sales)? A rising rental-DOM trend means longer vacancies and softer asking-rent achievability than the comps imply.
- What's the recent tenant-quality profile in this submarket — average credit score on applications, eviction rate, late-payment / NSF rate, and stable-employment percentage? A property-management company in the area should have these aggregated.
- How much new for-sale + rental construction is in the pipeline within 1–3 miles? Heavy new supply typically softens prices + rents 12–24 months out; constrained supply supports both.
Investment metrics
- 1% rule
- 0.96% ✗
- Cap rate
- 6.09%
- Cash-on-cash
- -0.73%
- DSCR
- 0.97
- GRM
- 8.7
CMA / ARV
- ARV (median comp)
- $407,406
- List price
- $279,900
- Delta
- -31.30%
- Verdict
- UNDERPRICED
- Comps
- 20 within 1.0 mi
Show comp detail 12 sales within ~0.75 mi
| Address | Dist | Beds/Ba | Sqft | Sold | Price | $/sf | Match |
|---|---|---|---|---|---|---|---|
| 28065 Edgepark Dr | 0.10mi | 4/2.5 | 2,584 (-2%) | 9mo | $405,000 | $157 | 85 |
| 29053 W Brockway Dr | 0.39mi | 4/2.5 | 2,524 (-4%) | 6mo | $445,000 | $176 | 69 |
| 27504 Cottonwood Trl | 0.45mi | 5/3.0 (+1) | 2,580 (-2%) | 4mo | $370,000 | $143 | 65 |
| 4580 Andorra Dr | 0.62mi | 4/2.5 | 2,665 (+1%) | 7mo | $375,000 | $141 | 64 |
| 27111 Newton Cir | 0.59mi | 4/2.5 | 2,454 (-7%) | 1mo | $340,000 | $139 | 60 |
| 26888 Driscoll Ln | 0.74mi | 4/2.5 | 2,637 (-0%) | 8mo | $355,000 | $135 | 59 |
| 4345 Martin Dr | 0.46mi | 4/2.5 | 2,321 (-12%) | 4mo | $292,000 | $126 | 55 |
| 27625 Laurell Ln | 0.39mi | 4/2.5 | 2,311 (-13%) | 8mo | $380,000 | $164 | 54 |
| 26928 Fairfax Ln | 0.60mi | 4/2.5 | 2,372 (-10%) | 1mo | $403,000 | $170 | 54 |
| 27008 Sweetbriar Dr | 0.58mi | 4/2.5 | 2,424 (-8%) | 7mo | $350,000 | $144 | 54 |
| 27411 Pineview Dr | 0.61mi | 4/2.5 | 2,472 (-6%) | 8mo | $452,000 | $183 | 54 |
| 3732 Greenbriar Cir | 0.71mi | 4/4.5 | 2,991 (+13%) | 7mo | $668,000 | $223 | 31 |
Match score weights: distance 35% · size 25% · config 20% · recency 20%. Top-matched comps best support the ARV.
Projected returns pro-forma
-3.0% appreciation · 1.85% rent growth · sell at horizon
- IRR
- -18.9%
- Equity multiple
- 0.35×
- Total profit
- $-51,279
- Equity at exit
- $41,734
- IRR
- -14.1%
- Equity multiple
- 0.23×
- Total profit
- $-60,144
- Equity at exit
- $24,201
Cash invested: $78,372 (down + closing). Projections, not guarantees.
Landlord ↔ Tenant lean methodology
- Overall (STATE)
- 73 Landlord-Friendly
- State Ohio
- 73 Landlord-Friendly · R+6
- County
- — inherits STATE
- City
- — inherits STATE
ZIP-level market 44070
- Rents YoY
- 1.9%
- Active inventory
- 159
- Price-to-rent
- 8.7×
Monthly cashflow live
- Estimated rent
- $2,694 medium interval (Pro) →
- Mortgage (P&I)
- −$1,468
- Tax from tax record
- −$592 /mo · $7,101/yr
- Insurance
- −$117
- HOA
- −$0
- Vacancy / Maint / Mgmt
- −$566
- Net cashflow
- $-48
Break-even live
UW: 25.0% down · 7.5% · 30yr · 1.5% tax · 5.0% vac · 8.0% maint · 8.0% mgmt
Financing live
Cash to close
- Down payment
- $69,975
- Closing costs
- $8,397
- Reserves months
- —
- Total cash needed
- —
Loan-product check · same deal, 3 products live
Conventional
25% down · 7.5% · 30yr
- Down + closing
- —
- Monthly P&I
- —
- Monthly cashflow
- —
- DSCR
- —
- Eligible?
- —
Personal DTI + credit; lowest rate.
DSCR
20% down · 8.5% · 30yr
- Down + closing
- —
- Monthly P&I
- —
- Monthly cashflow
- —
- DSCR
- —
- Eligible?
- —
No personal income docs; deal must DSCR.
Hard money
10% down · 12.0% · 12mo
- Down + closing
- —
- Monthly P&I
- —
- Monthly cashflow
- —
- DSCR
- —
- Eligible?
- —
Short-term bridge; refi at stabilization.
Rent comps 2 comps
| Address | Beds | Baths | Sqft | Rent | $/sqft | DOM | Units | Dist |
|---|---|---|---|---|---|---|---|---|
| 29395 Hummingbird Cir Westlake, OH | 3.0 | 2.0 | 1846 | $3,200 | $1.73 | 10d | 1 | 0.65mi |
| 28310 Center Ridge Rd Westlake, OH | 3.0 | 2.0 | 2120 | $2,300 | $1.08 | 1d | 1 | 0.72mi |
Listing history 18 events
-
2026-06-18days on market $279,900 Active 44 DOM
-
2026-06-17days on market $279,900 Active 43 DOM
-
2026-06-16days on market $279,900 Active 42 DOM
-
2026-06-15days on market $279,900 Active 41 DOM
-
2026-06-13days on market $279,900 Active 39 DOM
-
2026-06-09days on market $279,900 Active 35 DOM
-
2026-06-08days on market $279,900 Active 34 DOM
-
2026-06-07days on market $279,900 Active 33 DOM
-
2026-06-05days on market $279,900 Active 30 DOM
-
2026-06-03days on market $279,900 Active 29 DOM
-
2026-06-02days on market $279,900 Active 28 DOM
-
2026-06-01days on market $279,900 Active 27 DOM
-
2026-05-31days on market $279,900 Active 26 DOM
-
2026-05-05$279,900 Active 338-char remark
-
2011-03-01soldstatus $115,000 277-char remark
Show marketing remark (277 chars)
Spacious L-Shaped Split in quiet development area priced to sell!!Newer Furn, Central Air, h20 tank!!Woodburning fireplace in the family rm!!4 bedrooms!!2 full and one half bath!!Huge utility rm/storage room off garage!!Kitchen appliances stay!!Large utilty/storage room area!!
-
2011-02-25soldstatus $115,000
-
2010-07-23$140,000 277-char remark
Show marketing remark (277 chars)
Spacious L-Shaped Split in quiet development area priced to sell!!Newer Furn, Central Air, h20 tank!!Woodburning fireplace in the family rm!!4 bedrooms!!2 full and one half bath!!Huge utility rm/storage room off garage!!Kitchen appliances stay!!Large utilty/storage room area!!
-
1977-11-01soldstatus $76,500
ⓘ Source: listings_history table (triggers on properties + properties_extension) + one-shot
backfill from property_details.listing_events for pre-trigger history.
Tax reassessment forecast OH · Partial reset (capped growth)
- Current annual tax
- $7,101 · $592/mo
- Projected year-2 tax
- $7,101 · $592/mo
- Expected delta
- $0/yr ($0/mo · 0.0%)
ⓘ Screening estimate from a state-policy table — verify with the county assessor before closing.
Climate risk First Street
- Flood 1/10 Low FEMA zone X (unshaded) · 0% chance over 30 yrs
- Wildfire 1/10 Low
- Heat 3/10 Moderate 7 d/yr ≥95°F today · 17 d/yr by 30 yrs out
- Wind 1/10 Low
- Air quality 2/10 Low 1 unhealthy d/yr today · 3 by 30 yrs out
Nearby sold comps map
Loading sold comps map…
Walkable amenities ~0.75 mi
Loading nearby amenities…
Taxation est. · year 1
- Rental income
- $32,333
- − Mortgage interest
- −$15,679
- − Property taxes
- −$7,101
- − Insurance
- −$1,400
- − Repairs & maintenance
- −$2,587
- − Management
- −$2,587
- − Depreciation
- −$8,143
- Taxable loss
- −$5,162
- Est. tax savings @ 24.0%
- +$1,239
- After-tax cash flow
- $668/yr
For passive investors: Depreciation is non-cash, so a rental often shows a tax loss while cash-flowing — sheltering income. Rental losses are passive: they offset passive income freely, and up to $25,000/yr can offset ordinary (W-2) income if you actively participate and your MAGI is under $100k (phasing out to $0 by $150k); unused losses carry forward. On sale, claimed depreciation is recaptured at up to 25%, and gains may owe capital-gains tax (a 1031 exchange can defer both). Figures are a year-1 estimate at your 24.0% rate — not tax advice; consult a CPA.
Schools (NCES district)
- District
- North Olmsted City
- NCES district ID
- 3904452
- Math proficiency
- 51% ▼ -17.00%
- Reading proficiency
- 57% ▼ -7.00%
- Median HH income
- $59,338
- Composite
- 46.98/100
- National rank
- #2353
- State rank
- #368 of 656 in OH
Livability — North Olmsted
- Score
- 86/100
- State rank
- #38
- US rank
- #372
Category grades
Schools grade is shown separately in the Schools card above.
Census & demographics
- Census place
- North Olmsted, OH
- County
- Cuyahoga County · 1,090,369 people
- City population
- 31,924
- Metro
- Cleveland-Elyria, OH
- Population (ZIP)
- 31,924
- Household income
- $84,363
- Rent vs Own
- Severe rent burden
- 667.0
Population outlook (Cuyahoga County) Hauer SSP2
- Today (2025)
- 1,244,621 people
- By 2030
- 1,230,093 · -1.2%
- By 2040
- 1,189,108 · -4.5%
- By 2050
- 1,145,706 · -7.9%
- By 2075
- 1,076,557 · -13.5%
- By 2100
- 978,987 · -21.3%
Race, ethnicity, and origin ACS 2023
- Neighborhood character
- Predominantly White (85%)
- Race & ethnicity
- White 85% Hispanic / Latino 7% Two or more races 6% Asian 3% Black 2%
- Hispanic origin (detail)
- Mexican 3% Puerto Rican 3%
- Common ancestry
- Romanian 9% Slovak 2% Lithuanian 1%
- Foreign-born
- 8% · Canada
- Languages at home
- 88% English-only · Spanish 3% Other Indo-European 3% Arabic 3%
Political lean MEDSL · Cuyahoga
- 2024 margin
- Solid D (+31.5) · D 65.4% · R 33.9%
- 2008→2024 swing
- -7.4pp toward R · 2008: 38.9pp · 2024: 31.5pp
- All cycles
- 2024: D+31.5 2020: D+34.1 2016: D+35.0 2012: D+38.7 2008: D+38.9
Not yet ingested
- Civics
- —
Market trends
- HPI YoY
- ▼ -243.21%
- Current HPI
- 214.2257
- Rent YoY
- ▲ 1.85%
- Metro
- Cleveland-Elyria, OH
- State GDP YoY
- ▲ 1.98%
- F500 in state
- 48
Industry mix (Fortune 500 HQ in OH)
| Industry | F500 HQs | Revenue |
|---|---|---|
| Insurance | 3 | $145B |
|
||
| Industrial Machinery | 3 | $49B |
|
||
| Financial Services | 3 | $24B |
|
||
| Consumer Goods | 2 | $93B |
|
||
| Aerospace / Defense | 2 | $47B |
|
||
| Utilities | 2 | $33B |
|
||
Price history
+265.9% since first listed5 events — show timeline
- 2026-05-05 Listed $279,900 MLSNOW
- 2011-03-01 Sold (MLS) $115,000 MLSNOW
- 2011-02-25 Sold (Public Records) $115,000 Public Records
- 2010-07-23 Listed $140,000 MLSNOW
- 1977-11-01 Sold (Public Records) $76,500 Public Records
Property tax history
+4.1%/yrLatest (2025): $7,101 · -1.1% YoY. Source: county tax records.
Cash-flow waterfall
monthlySold comps — $/sqft
last 12 mo · ≤1 miLoading sold comps…