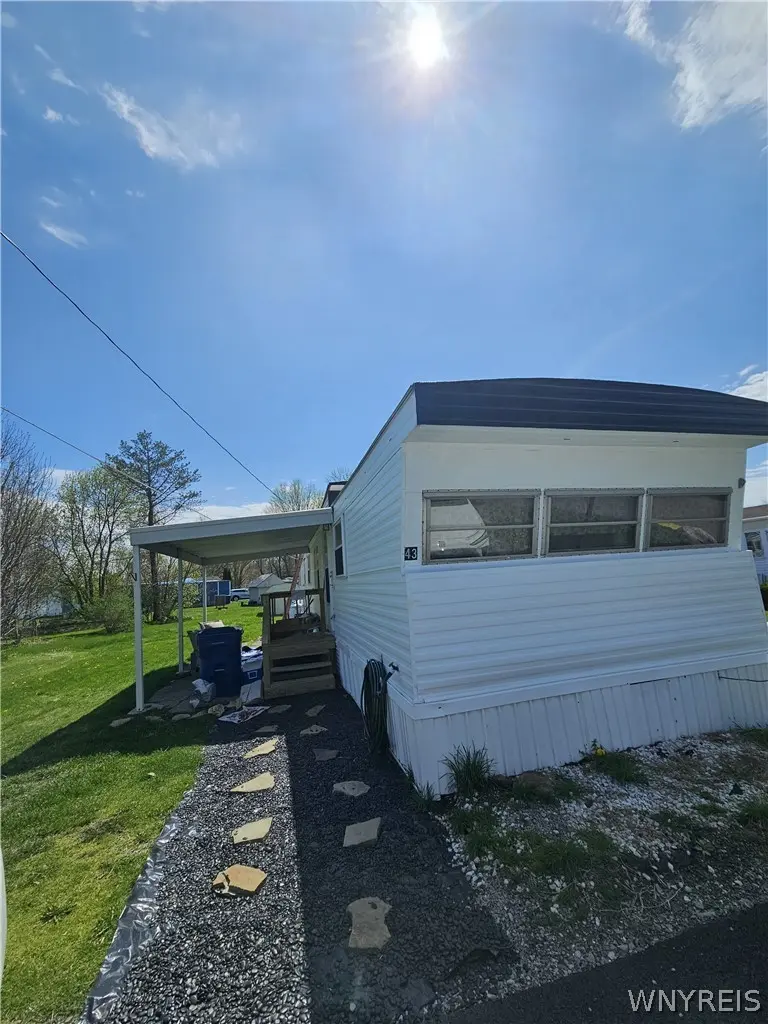
43 Rainbow Park · Ransomville, NY
Flood risk No data
- FEMA flood zone
- —
- Chance of flooding over 30 yrs
- —
- Est. flood insurance / yr
- —
Fire risk No data
- Est. fire insurance / yr
- —
Heat risk No data
- Hot days now (above threshold)
- —
- Hot days in 30 yrs
- —
Wind risk No data
- Chance of severe wind over 30 yrs
- —
Air-quality risk No data
- Unhealthy air days now
- —
- Unhealthy air days in 30 yrs
- —
Risk factors via First Street. Map © Google.
Why this score? — see what drove the B+ grade
The composite is a weighted blend of 9 inputs, each scored 0–100. Each bar is that input's sub-score; the figure is the points it added to the 100-point composite (weight × sub-score).
- Cash flow +30.0/30.0
- 1% rule +10.0/10.0
- DSCR +10.0/10.0
- Appreciation +10.0/10.0
- ARV discount +7.5/15.0
- Schools +4.6/10.0
- Livability +3.4/5.0
- Rent growth +2.5/5.0
- Condition / age +1.0/5.0
$42,000
🖨 Deal sheet (PDF) 📄 Offer letter ✓ Due diligence
Listing remarks
Welcome to peaceful country living in Ransomville! Nestled in a quiet area, this mobile home offers the perfect blend of tranquility and convenience. Enjoy being just minutes from Bond Lake Park, where you can explore nature, trails, and outdoor activities. Located in the highly regarded Wilson Central School District, this home is ideal for those seeking a serene setting while still being close to everyday amenities.
Key facts
- Bond lake park
- Built 1980
- Listed 55 days
Tags
Property features AI
Finance
- HOA & community: Land lease: $530/month
Exterior
- Parking: No garage
- Utilities: Water connected (public); Septic tank
- Home design: Single-wide mobile home (Windsor); 1 story; Resale property
- Construction: Existing construction
- Exterior features: Blacktop driveway; Leased propane tank; Shed(s) and storage
Interior
- Kitchen: Gas cooktop; Microwave; Refrigerator; Electric water heater
- Bedrooms: 2 main-level bedrooms
- Flooring: Varied flooring; Vinyl flooring
- Bathrooms: 1 full bathroom (main level)
- Heating & cooling: Propane forced-air heating; Window cooling unit(s)
- Interior features: Kitchen and family room combined; Bedroom on main level
- Laundry & utility: Main-level laundry; Washer; Dryer
Neighborhood map
What this means for you Summary
Snapshot
- This is a 2-bed/1.0-bath manufactured listed at $42k. Condition is rated poor.
Deal economics
- At list price, monthly cash flow is $444 ($5k/yr) — positive.
- The deal already cash-flows at list — no discount required.
- Meets the 1% rule at list price ($930 rent vs $42k).
- Recommended offer: $41k (3.0% below list) — sets the bar for market timing.
- Cap rate 19.0% vs local median 2.6% in Ransomville — top-decile yield for the area; either an underpriced asset or a hidden risk that comps aren't pricing in. Stress-test before assuming the spread holds.
Location & tenants
- Location reads 68/100 on livability (#548 in NY) — a middle-class / working-renter tenant base. Strengths: employment A+, housing A+, crime A; Watch: schools F, amenities F, commute F.
- Wilson Central School District (town): math 52% / reading 55% proficiency, ranked #319 of 590 in NY (top 54%) — acceptable for families but not a draw, mixed tenant base, ~2y average lease.
- Market conditions: 32 active listings in the ZIP; 167 units permitted in Niagara County in 2024 (0 in 5+ unit buildings).
Forward outlook
- In year one you build about $4k of equity ($290 loan paydown + $4k appreciation (10.0% local appreciation)).
- Niagara County population projected at -19% by 2050 — secular population decline; favor cash flow + early exit over multi-decade hold.
- At projected returns (10.0% appreciation + 3.0% rent growth), your $12k cash investment doubles in ~2 years — after that, you're playing with house money.
- By year 7, paydown + projected appreciation supports a ~$32k cash-out refi (75% LTV) — recoverable capital for the next deal without selling this one.
Negotiation context
- It's been on market 56 days — a 3% lower offer ($41k) is reasonable based on typical stale-listing flexibility.
Questions for the listing agent
- It's been on market 56 days. Have you received any prior offers? Is the seller open to a 3% concession, seller financing, or rate buy-down credit?
- Have any recent inspections been done? Can we get a copy of the seller's disclosures and any deferred-maintenance estimates?
- Is there a deadline driving the sale (1031 exchange, divorce, estate, relocation)? That informs how much negotiation room exists.
- Schools are F-rated, which usually means shorter tenancies and higher turnover. Who's the typical renter profile here, and what's been the actual vacancy rate?
- What's the average days-on-market for RENTAL listings here right now (not sales)? A rising rental-DOM trend means longer vacancies and softer asking-rent achievability than the comps imply.
- What's the recent tenant-quality profile in this submarket — average credit score on applications, eviction rate, late-payment / NSF rate, and stable-employment percentage? A property-management company in the area should have these aggregated.
- How much new for-sale + rental construction is in the pipeline within 1–3 miles? Heavy new supply typically softens prices + rents 12–24 months out; constrained supply supports both.
Investment metrics
- 1% rule
- 2.21% ✓
- Cap rate
- 18.98%
- Cash-on-cash
- 45.32%
- DSCR
- 3.02
- GRM
- 3.8
CMA / ARV
- ARV (median comp)
- $17,000
- List price
- $42,000
- Delta
- 147.06%
- Verdict
- OVERPRICED
- Comps
- 1 within 2.0 mi
Projected returns pro-forma
10.0% appreciation · 3.0% rent growth · sell at horizon
- IRR
- 59.7%
- Equity multiple
- 5.35×
- Total profit
- $51,173
- Equity at exit
- $37,837
- IRR
- 53.2%
- Equity multiple
- 11.93×
- Total profit
- $128,482
- Equity at exit
- $81,597
Cash invested: $11,760 (down + closing). Projections, not guarantees.
Landlord ↔ Tenant lean methodology
- Overall (STATE)
- 15 Strongly Tenant-Friendly
- State New York
- 15 Strongly Tenant-Friendly · D+10
- County
- — inherits STATE
- City
- — inherits STATE
ZIP-level market 14131
- Home prices YoY
- 7.8%
- Active inventory
- 32
- Price-to-rent
- 3.8×
Monthly cashflow live
- Estimated rent
- $930 medium interval (Pro) →
- Mortgage (P&I)
- −$220
- Tax est. 1.5%
- −$52 /mo · $630/yr
- Insurance
- −$18
- HOA
- −$0
- Vacancy / Maint / Mgmt
- −$195
- Net cashflow
- $444
Break-even live
Sensitivity live
| Price | -10% $473 | -5% $459 | +0% $444 | +5% $430 | +10% $415 |
|---|---|---|---|---|---|
| Rent | -10% $371 | -5% $407 | +0% $444 | +5% $481 | +10% $518 |
| Rate | -1.0pp $465 | -0.5pp $455 | base $444 | +0.5pp $433 | +1.0pp $422 |
UW: 25.0% down · 7.5% · 30yr · 1.5% tax · 5.0% vac · 8.0% maint · 8.0% mgmt
Financing live
Cash to close
- Down payment
- $10,500
- Closing costs
- $1,260
- Reserves months
- —
- Total cash needed
- —
Loan-product check · same deal, 3 products live
Conventional
25% down · 7.5% · 30yr
- Down + closing
- —
- Monthly P&I
- —
- Monthly cashflow
- —
- DSCR
- —
- Eligible?
- —
Personal DTI + credit; lowest rate.
DSCR
20% down · 8.5% · 30yr
- Down + closing
- —
- Monthly P&I
- —
- Monthly cashflow
- —
- DSCR
- —
- Eligible?
- —
No personal income docs; deal must DSCR.
Hard money
10% down · 12.0% · 12mo
- Down + closing
- —
- Monthly P&I
- —
- Monthly cashflow
- —
- DSCR
- —
- Eligible?
- —
Short-term bridge; refi at stabilization.
Listing history 16 events
-
2026-06-21days on market $42,000 Active 56 DOM
-
2026-06-18days on market $42,000 Active 53 DOM
-
2026-06-17days on market $42,000 Active 52 DOM
-
2026-06-16days on market $42,000 Active 51 DOM
-
2026-06-15days on market $42,000 Active 50 DOM
-
2026-06-13days on market $42,000 Active 48 DOM
-
2026-06-13days on market $42,000 Active 47 DOM
-
2026-06-10days on market $42,000 Active 45 DOM
-
2026-06-09days on market $42,000 Active 44 DOM
-
2026-06-08days on market $42,000 Active 43 DOM
-
2026-06-07days on market $42,000 Active 42 DOM
-
2026-06-03days on market $42,000 Active 38 DOM
-
2026-06-02days on market $42,000 Active 37 DOM
-
2026-06-01days on market $42,000 Active 36 DOM
-
2026-05-31days on market $42,000 Active 35 DOM
-
2026-04-26$49,900 Active 421-char remark
ⓘ Source: listings_history table (triggers on properties + properties_extension) + one-shot
backfill from property_details.listing_events for pre-trigger history.
Nearby sold comps map
Loading sold comps map…
Walkable amenities ~0.75 mi
Loading nearby amenities…
Taxation est. · year 1
- Rental income
- $11,155
- − Mortgage interest
- −$2,353
- − Property taxes
- −$630
- − Insurance
- −$210
- − Repairs & maintenance
- −$892
- − Management
- −$892
- − Depreciation
- −$1,222
- Taxable income
- $4,955
- Est. tax owed @ 24.0%
- −$1,189
- After-tax cash flow
- $4,140/yr
For passive investors: Depreciation is non-cash, so a rental often shows a tax loss while cash-flowing — sheltering income. Rental losses are passive: they offset passive income freely, and up to $25,000/yr can offset ordinary (W-2) income if you actively participate and your MAGI is under $100k (phasing out to $0 by $150k); unused losses carry forward. On sale, claimed depreciation is recaptured at up to 25%, and gains may owe capital-gains tax (a 1031 exchange can defer both). Figures are a year-1 estimate at your 24.0% rate — not tax advice; consult a CPA.
Condition & rehab AI · 1 photo
This manufactured home requires extensive repairs and updates to its roof, exterior, flooring, interior, bathrooms, kitchen, HVAC, windows, and landscaping. Significant investment is needed to bring it up to a livable condition.
Repairs flagged
- Major roof — No visible roof in the satellite image.
- Major exterior — No visible siding or paint in the satellite image.
- Major flooring — No visible flooring in the satellite image.
- Major interior walls/paint — No visible interior walls or paint in the satellite image.
- Major bathrooms — No visible bathrooms in the satellite image.
- Major kitchen — No visible kitchen in the satellite image.
- Major systems — No visible HVAC or mechanical systems in the satellite image.
- Major windows — No visible windows in the satellite image.
- Major foundation/structure — No visible foundation or structure in the satellite image.
- Major landscaping/curb appeal — No visible landscaping or curb appeal in the satellite image.
Value-add opportunities
- Both roof replacement — A new roof would significantly improve the home's appearance and functionality.
- Both exterior painting — Painting the exterior would enhance curb appeal and protect the siding.
- Both flooring replacement — New flooring would improve the home's aesthetic and functionality.
- Both interior painting — Painting the interior walls would refresh the home's appearance and protect the surfaces.
- Both bathroom renovation — Updating bathrooms would improve functionality and aesthetics.
- Both kitchen renovation — Updating the kitchen would improve functionality and aesthetics.
- Both HVAC replacement — A new HVAC system would improve comfort and energy efficiency.
- Both window replacement — New windows would improve energy efficiency and curb appeal.
- Both landscaping — Landscaping would enhance curb appeal and create a more inviting environment.
Renovation cost estimate screening
| Repair item | Severity | Est. cost |
|---|---|---|
| roof · No visible roof in the satellite image. | Major | $15,000–50,000 |
| exterior · No visible siding or paint in the satellite image. | Major | $15,000–50,000 |
| flooring · No visible flooring in the satellite image. | Major | $15,000–50,000 |
| interior walls/paint · No visible interior walls or paint in the satellite image. | Major | $15,000–50,000 |
| bathrooms · No visible bathrooms in the satellite image. | Major | $15,000–50,000 |
| kitchen · No visible kitchen in the satellite image. | Major | $15,000–50,000 |
| systems · No visible HVAC or mechanical systems in the satellite image. | Major | $15,000–50,000 |
| windows · No visible windows in the satellite image. | Major | $15,000–50,000 |
| foundation/structure · No visible foundation or structure in the satellite image. | Major | $15,000–50,000 |
| landscaping/curb appeal · No visible landscaping or curb appeal in the satellite image. | Major | $15,000–50,000 |
| Total estimated repair cost · 10 items | $150,000–500,000 |
Value-add ROI direction
- Both roof replacement — A new roof would significantly improve the home's appearance and functionality. ↑
- Both exterior painting — Painting the exterior would enhance curb appeal and protect the siding. ↑
- Both flooring replacement — New flooring would improve the home's aesthetic and functionality. ↑
- Both interior painting — Painting the interior walls would refresh the home's appearance and protect the surfaces. ↑
- Both bathroom renovation — Updating bathrooms would improve functionality and aesthetics. ↑
- Both kitchen renovation — Updating the kitchen would improve functionality and aesthetics. ↑
- Both HVAC replacement — A new HVAC system would improve comfort and energy efficiency. ↑
- Both window replacement — New windows would improve energy efficiency and curb appeal. ↑
- Both landscaping — Landscaping would enhance curb appeal and create a more inviting environment. ↑
ⓘ Cost ranges are severity-bucket heuristics (US national rule-of-thumb). Get contractor quotes + a written scope before underwriting a rehab budget.
Schools (NCES district)
- District
- Wilson Central School District
- NCES district ID
- 3631560
- Math proficiency
- 52% ▼ -7.00%
- Reading proficiency
- 55% ▲ 3.00%
- Median HH income
- $57,181
- Composite
- 46.37/100
- National rank
- #2462
- State rank
- #319 of 590 in NY
Livability — Ransomville
- Score
- 68/100
- State rank
- #548
- US rank
- #9859
Category grades
Schools grade is shown separately in the Schools card above.
Census & demographics
- City population
- 5,339
- Population (ZIP)
- 5,339
Population outlook (Niagara County) Hauer SSP2
- Today (2025)
- 204,149 people
- By 2030
- 197,900 · -3.1%
- By 2040
- 182,239 · -10.7%
- By 2050
- 165,198 · -19.1%
- By 2075
- 129,416 · -36.6%
- By 2100
- 96,222 · -52.9%
Race, ethnicity, and origin ACS 2023
- Neighborhood character
- Predominantly White (94%)
- Race & ethnicity
- White 94% Two or more races 4% Hispanic / Latino 3% Black 2%
- Common ancestry
- Romanian 14% Slovak 4% Lithuanian 2%
- Foreign-born
- 2% · Canada
- Languages at home
- 98% English-only · Spanish 1%
Political lean MEDSL · Niagara
- 2024 margin
- R (+14.9) · D 42.5% · R 57.5%
- 2008→2024 swing
- -15.9pp toward R · 2008: 1.0pp · 2024: -14.9pp
- All cycles
- 2024: R+14.9 2020: R+9.7 2016: R+19.0 2012: D+0.6 2008: D+1.0
Not yet ingested
- Civics
- —
Market trends
- HPI YoY
- ▲ 21.41%
- Current HPI
- 297.4314
- Rent YoY
- —
- Metro
- —
- State GDP YoY
- ▲ 2.60%
- F500 in state
- 92
Industry mix (Fortune 500 HQ in NY)
| Industry | F500 HQs | Revenue |
|---|---|---|
| Financial Services | 10 | $950B |
|
||
| Consumer Goods | 9 | $162B |
|
||
| Insurance | 4 | $225B |
|
||
| Telecommunications | 2 | $144B |
|
||
| Pharmaceuticals | 2 | $112B |
|
||
| Media / Entertainment | 2 | $69B |
|
||
Price history
-15.8% since first listed2 events — show timeline
- 2026-05-26 Price Changed $42,000 WNYREIS
- 2026-04-26 Listed $49,900 WNYREIS
Cash-flow waterfall
monthlySold comps — $/sqft
last 12 mo · ≤1 miLoading sold comps…