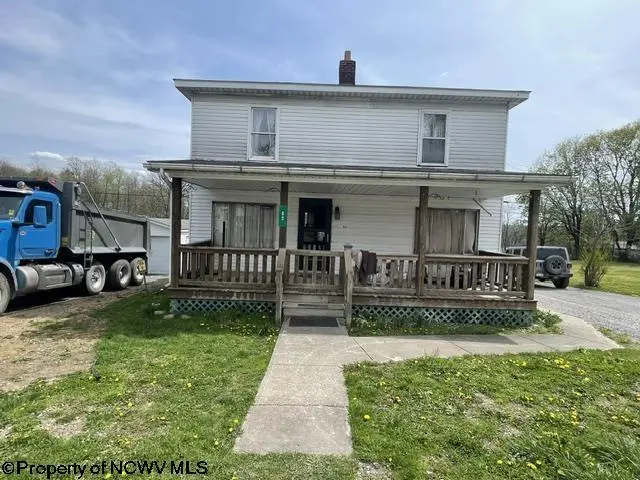
83 3rd St · Masontown, WV
Flood risk No data
- FEMA flood zone
- —
- Chance of flooding over 30 yrs
- —
- Est. flood insurance / yr
- —
Fire risk No data
- Est. fire insurance / yr
- —
Heat risk No data
- Hot days now (above threshold)
- —
- Hot days in 30 yrs
- —
Wind risk No data
- Chance of severe wind over 30 yrs
- —
Air-quality risk No data
- Unhealthy air days now
- —
- Unhealthy air days in 30 yrs
- —
Risk factors via First Street. Map © Google.
Why this score? — see what drove the C- grade
The composite is a weighted blend of 9 inputs, each scored 0–100. Each bar is that input's sub-score; the figure is the points it added to the 100-point composite (weight × sub-score).
- ARV discount +14.9/15.0
- Cash flow +14.5/30.0
- Appreciation +5.0/10.0
- DSCR +4.4/10.0
- Livability +3.2/5.0
- 1% rule +2.8/10.0
- Rent growth +2.5/5.0
- Condition / age +2.5/5.0
- Schools +2.4/10.0
$169,000
🖨 Deal sheet (PDF) 📄 Offer letter ✓ Due diligence
Listing remarks
This home has every man's dream garage. Home will need some TLC and is being sold "as-is". 4 bedroom/2 bath on a basement with a 30 X 50 garage with 20' ceilings. The home sits on . 85 acres. It has both a front and back porch. Garage has electric and water and is plumbed for a bathroom. Short commute to Morgantown and Kingwood.
Key facts
- Front porch
- Back porch
- 0.85 acre lot
Tags
Property features AI
Exterior
- Parking: Off-street parking; On-street parking; Other parking
- Utilities: Public water; Public sewer; Cable available
- Home design: Single-family detached residence; 2 stories
- Construction: Block, frame and vinyl siding construction; Shingle roof; Concrete basement (unfinished) with walk-out access
- Exterior features: Porch; Level lot
Interior
- Kitchen: Dishwasher; Refrigerator; Range; Garbage disposal
- Bedrooms: 7 total rooms (includes bedrooms and living spaces)
- Flooring: Vinyl flooring; Wood flooring
- Bathrooms: 2 full bathrooms
- Heating & cooling: Ceiling fans; Window air conditioning units; Oil heating; Wood heating
- Interior features: Dishwasher; Refrigerator; Range; Disposal
Neighborhood map
What this means for you Summary
Snapshot
- This is a 4-bed/2.0-bath single-family listed at $169k.
Deal economics
- At list price, monthly cash flow is $37 ($443/yr) — positive.
- The deal already cash-flows at list — no discount required.
- To meet the 1% rule (rent ≥ 1% of price), the offer needs to be $132k (22.0% below list).
- Recommended offer: $132k (22.0% below list) — sets the bar for 1% rule.
Location & tenants
- Location reads 63/100 on livability (#166 in WV) — a middle-class / working-renter tenant base. Strengths: cost of living A+, housing A+, crime B; Watch: amenities F, commute F, employment F.
- Preston County Schools (rural): math 22% / reading 33% proficiency, ranked #39 of 55 in WV (top 71%) — low school quality limits family demand, transient renter base, plan for 1-2y turnover.
- Zoned schools: West Preston School (math 16% / reading 24%, grade F, #338 of 377 statewide, top 90%, 656 students, 0% FRL); Central Preston Middle School (math 19% / reading 42%, grade F, #57 of 109 statewide, top 52%, 322 students, 0% FRL); Preston High School (math 10% / reading 32%, grade F, #100 of 110 statewide, top 91%, 1,178 students, 0% FRL) — zoned schools average 0% FRL vs 43% district-wide (43 pts lower); this property's tenant base skews higher-income than the district average.
- Market conditions: 1 active listings in the ZIP; 2 units permitted in Preston County in 2024 (0 in 5+ unit buildings).
Forward outlook
- In year one you build about $6k of equity ($1k loan paydown + $5k appreciation (3.0% local appreciation)).
- Preston County population projected to shrink 5% by 2050 — rents likely to lag national; underwrite the cash flow, not the appreciation.
- At projected returns (3.0% appreciation + 3.0% rent growth), your $47k cash investment doubles in ~6 years — after that, you're playing with house money.
- By year 6, paydown + projected appreciation supports a ~$33k cash-out refi (75% LTV) — recoverable capital for the next deal without selling this one.
Negotiation context
- It's been on market 70 days — a 6% lower offer ($159k) is reasonable based on typical stale-listing flexibility.
- Current owner paid $80k; list at $169k implies a 111% gain — meaningful room to come down on a strong offer.
Risks & watch-outs
- Watch-outs: built in 1919 — expect roof / HVAC / electrical / plumbing capex.
Questions for the listing agent
- It's been on market 70 days. Have you received any prior offers? Is the seller open to a 22% concession, seller financing, or rate buy-down credit?
- Built in 1919 — when were the roof, HVAC, electrical panel, plumbing, and water heater last replaced?
- Why hasn't it sold? Are there any deal-killer items the seller is aware of (foundation, flood, title, zoning, code violations)?
- Is there a deadline driving the sale (1031 exchange, divorce, estate, relocation)? That informs how much negotiation room exists.
- Schools are F-rated, which usually means shorter tenancies and higher turnover. Who's the typical renter profile here, and what's been the actual vacancy rate?
- What's the average days-on-market for RENTAL listings here right now (not sales)? A rising rental-DOM trend means longer vacancies and softer asking-rent achievability than the comps imply.
- What's the recent tenant-quality profile in this submarket — average credit score on applications, eviction rate, late-payment / NSF rate, and stable-employment percentage? A property-management company in the area should have these aggregated.
- How much new for-sale + rental construction is in the pipeline within 1–3 miles? Heavy new supply typically softens prices + rents 12–24 months out; constrained supply supports both.
Investment metrics
- 1% rule
- 0.78% ✗
- Cap rate
- 6.55%
- Cash-on-cash
- 0.94%
- DSCR
- 1.04
- GRM
- 10.7
CMA / ARV
- ARV (on-the-fly)
- $202,272
- Comps found
- 8
Show comp detail 8 sales within ~0.75 mi
| Address | Dist | Beds/Ba | Sqft | Sold | Price | $/sf | Match |
|---|---|---|---|---|---|---|---|
| 4145 Mckinney Cave Rd | 0.15mi | 3/2.0 (-1) | 1,430 (-9%) | 8mo | $170,000 | $119 | 67 |
| 156 Chapel Brooke | 0.35mi | 3/2.0 (-1) | 1,588 (+1%) | 17mo | $220,000 | $139 | 62 |
| 39 Chapel Brooke | 0.34mi | 3/2.5 (-1) | 1,524 (-3%) | 20mo | $267,500 | $176 | 56 |
| 67 Gibson Ave | 0.67mi | 4/1.5 | 1,408 (-10%) | 3mo | $185,700 | $132 | 48 |
| 402 S Main St | 0.47mi | 4/2.0 | 1,736 (+11%) | 18mo | $196,000 | $113 | 45 |
| 107 Orchard St | 0.67mi | 3/2.0 (-1) | 1,684 (+7%) | 11mo | $165,000 | $98 | 42 |
| 155 Roosevelt Ave | 0.59mi | 4/2.0 | 1,388 (-12%) | 22mo | $150,000 | $108 | 34 |
| 105 Cherry St | 0.55mi | 3/2.0 (-1) | 1,723 (+10%) | 23mo | $223,000 | $129 | 34 |
Match score weights: distance 35% · size 25% · config 20% · recency 20%. Top-matched comps best support the ARV.
Projected returns pro-forma
3.0% appreciation · 3.0% rent growth · sell at horizon
- IRR
- 8.3%
- Equity multiple
- 1.48×
- Total profit
- $22,626
- Equity at exit
- $75,990
- IRR
- 10.9%
- Equity multiple
- 2.63×
- Total profit
- $77,171
- Equity at exit
- $117,109
Cash invested: $47,320 (down + closing). Projections, not guarantees.
Landlord ↔ Tenant lean methodology
- Overall (STATE)
- 83 Strongly Landlord-Friendly
- State West Virginia
- 83 Strongly Landlord-Friendly · R+22
- County
- — inherits STATE
- City
- — inherits STATE
ZIP-level market 26524
- Active inventory
- 1
- Price-to-rent
- 10.7×
Monthly cashflow live
- Estimated rent
- $1,318 medium interval (Pro) →
- Mortgage (P&I)
- −$886
- Tax from tax record
- −$47 /mo · $568/yr
- Insurance
- −$70
- HOA
- −$0
- Vacancy / Maint / Mgmt
- −$277
- Net cashflow
- $37
Break-even live
Sensitivity live
| Price | -10% $133 | -5% $85 | +0% $37 | +5% $-11 | +10% $-59 |
|---|---|---|---|---|---|
| Rent | -10% $-67 | -5% $-15 | +0% $37 | +5% $89 | +10% $141 |
| Rate | -1.0pp $122 | -0.5pp $80 | base $37 | +0.5pp $-7 | +1.0pp $-51 |
UW: 25.0% down · 7.5% · 30yr · 1.5% tax · 5.0% vac · 8.0% maint · 8.0% mgmt
Financing live
Cash to close
- Down payment
- $42,250
- Closing costs
- $5,070
- Reserves months
- —
- Total cash needed
- —
Loan-product check · same deal, 3 products live
Conventional
25% down · 7.5% · 30yr
- Down + closing
- —
- Monthly P&I
- —
- Monthly cashflow
- —
- DSCR
- —
- Eligible?
- —
Personal DTI + credit; lowest rate.
DSCR
20% down · 8.5% · 30yr
- Down + closing
- —
- Monthly P&I
- —
- Monthly cashflow
- —
- DSCR
- —
- Eligible?
- —
No personal income docs; deal must DSCR.
Hard money
10% down · 12.0% · 12mo
- Down + closing
- —
- Monthly P&I
- —
- Monthly cashflow
- —
- DSCR
- —
- Eligible?
- —
Short-term bridge; refi at stabilization.
Listing history 19 events
-
2026-06-22days on market $169,000 Active 70 DOM
-
2026-06-19days on market $169,000 Active 68 DOM
-
2026-06-18days on market $169,000 Active 67 DOM
-
2026-06-17days on market $169,000 Active 66 DOM
-
2026-06-16days on market $169,000 Active 65 DOM
-
2026-06-15days on market $169,000 Active 64 DOM
-
2026-06-14days on market $169,000 Active 62 DOM
-
2026-06-13days on market $169,000 Active 61 DOM
-
2026-06-10days on market $169,000 Active 59 DOM
-
2026-06-09days on market $169,000 Active 58 DOM
-
2026-06-08days on market $169,000 Active 57 DOM
-
2026-06-07days on market $169,000 Active 56 DOM
-
2026-06-03days on market $169,000 Active 52 DOM
-
2026-06-02days on market $169,000 Active 51 DOM
-
2026-06-01days on market $169,000 Active 50 DOM
-
2026-05-31days on market $169,000 Active 49 DOM
-
2026-05-30days on market $169,000 Active 48 DOM
-
2026-04-12$169,000 Active
-
2023-05-30soldstatus $80,000
ⓘ Source: listings_history table (triggers on properties + properties_extension) + one-shot
backfill from property_details.listing_events for pre-trigger history.
Tax reassessment forecast WV · Resets to sale price
- Current annual tax
- $568 · $47/mo
- Projected year-2 tax
- $997 · $83/mo
- Expected delta
- +$429/yr (+$36/mo · 75.7%)
ⓘ Screening estimate from a state-policy table — verify with the county assessor before closing.
Nearby sold comps map
Loading sold comps map…
Walkable amenities ~0.75 mi
Loading nearby amenities…
Taxation est. · year 1
- Rental income
- $15,810
- − Mortgage interest
- −$9,467
- − Property taxes
- −$568
- − Insurance
- −$845
- − Repairs & maintenance
- −$1,265
- − Management
- −$1,265
- − Depreciation
- −$4,916
- Taxable loss
- −$2,515
- Est. tax savings @ 24.0%
- +$604
- After-tax cash flow
- $1,046/yr
For passive investors: Depreciation is non-cash, so a rental often shows a tax loss while cash-flowing — sheltering income. Rental losses are passive: they offset passive income freely, and up to $25,000/yr can offset ordinary (W-2) income if you actively participate and your MAGI is under $100k (phasing out to $0 by $150k); unused losses carry forward. On sale, claimed depreciation is recaptured at up to 25%, and gains may owe capital-gains tax (a 1031 exchange can defer both). Figures are a year-1 estimate at your 24.0% rate — not tax advice; consult a CPA.
Schools (NCES district)
- District
- Preston County Schools
- NCES district ID
- 5401170
- Math proficiency
- 22% ▼ -8.00%
- Reading proficiency
- 33% ▼ -6.00%
- Median HH income
- $43,997
- Composite
- 23.51/100
- National rank
- #7869
- State rank
- #39 of 55 in WV
Livability — Masontown
- Score
- 63/100
- State rank
- #166
- US rank
- #15552
Category grades
Schools grade is shown separately in the Schools card above.
Census & demographics
- Population (ZIP)
- 135
Population outlook (Preston County) Hauer SSP2
- Today (2025)
- 33,786 people
- By 2030
- 33,618 · -0.5%
- By 2040
- 32,953 · -2.5%
- By 2050
- 32,131 · -4.9%
- By 2075
- 30,774 · -8.9%
- By 2100
- 27,037 · -20.0%
Race, ethnicity, and origin ACS 2023
- Neighborhood character
- Predominantly White (100%)
- Race & ethnicity
- White 100%
- Common ancestry
- Iranian 18%
Political lean MEDSL · Preston
- 2024 margin
- Solid R (+57.0) · D 20.5% · R 77.5% · Other 2.1%
- 2008→2024 swing
- -30.5pp toward R · 2008: -26.5pp · 2024: -57.0pp
- All cycles
- 2024: R+57.0 2020: R+55.1 2016: R+55.8 2012: R+44.4 2008: R+26.5
Not yet ingested
- Civics
- —
Market trends
- HPI YoY
- —
- Current HPI
- —
- Rent YoY
- —
- Metro
- —
- State GDP YoY
- —
- F500 in state
- 0
Price history
+111.2% since first listed2 events — show timeline
- 2026-04-12 Listed $169,000 NCWVREIN
- 2023-05-30 Sold (Public Records) $80,000 Public Records
Property tax history
+15.7%/yrLatest (2025): $568 · +21.3% YoY. Source: county tax records.
Cash-flow waterfall
monthlySold comps — $/sqft
last 12 mo · ≤1 miLoading sold comps…