 Multi-family
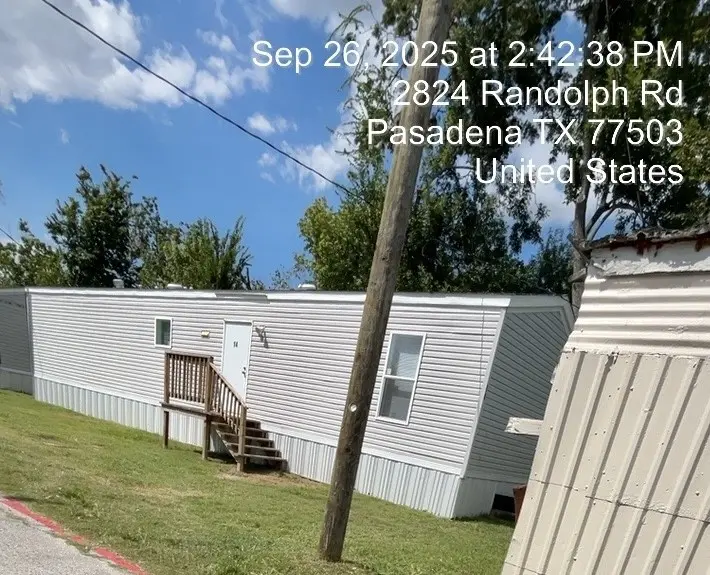
2824 Randolph Rd #14 · Pasadena, TX
Flood risk 4/10 · Minor
- FEMA flood zone
- X (unshaded)
- Chance of flooding over 30 yrs
- 0.22%
- Est. flood insurance / yr
- $507 – $1,088
Fire risk 1/10 · Minimal
- Est. fire insurance / yr
- $1,222 – $2,270
Heat risk 9/10 · Severe
- Hot days now (above 109°F)
- 7 days/yr
- Hot days in 30 yrs
- 24 days/yr
Wind risk 9/10 · Severe
- Chance of severe wind over 30 yrs
- 99.0%
Air-quality risk 2/10 · Minimal
- Unhealthy air days now
- 2 days/yr
- Unhealthy air days in 30 yrs
- 2 days/yr
Risk factors via First Street. Map © Google.
Why this score? — see what drove the B- grade
The composite is a weighted blend of 9 inputs, each scored 0–100. Each bar is that input's sub-score; the figure is the points it added to the 100-point composite (weight × sub-score).
- Cash flow +30.0/30.0
- 1% rule +10.0/10.0
- DSCR +10.0/10.0
- ARV discount +7.5/15.0
- Livability +3.3/5.0
- Schools +2.6/10.0
- Condition / age +2.5/5.0
- Rent growth +0.1/5.0
- Appreciation +0.0/10.0
$54,989
🖨 Deal sheet 📄 Offer letter ✓ Due diligence
Multi-family units
County records classify this as Multi-Family (5+ Unit). Listing-text estimate: 1 unit. estimate disagrees with records
5+ unit building — per-unit beds/baths from public records are typically unavailable; the breakdown below (if shown) is an estimate from the listing text.
Listing remarks
Welcome home to comfort and convenience! This manufactured home offers a warm and inviting layout and a space that feels both cozy and functional. Enjoy the ease of living in a well-maintained community. Whether you’re looking for a place to settle in or simply want something comfortable and affordable in a great location, this home offers a wonderful opportunity. Home is situated on a leased lot within a mobile home community; land is not included.
Key facts
- 0.95 acre lot
- Built 1956
- Listed 36 days
Property features AI
Exterior
- Utilities: Public sewer
- Home design: Residential property; Built in 1956
- Construction: Living area 840; Building area total 840
- Exterior features: Lot nearly 1 acre (0.95 acres); Lot features: Other
Interior
- Bedrooms: Primary bedroom (first floor); Additional bedrooms on the first floor
- Bathrooms: 2 full bathrooms
- Heating & cooling: Central heating (electric); Central air conditioning (electric)
- Interior features: 4 total rooms; Living room on the first floor
Neighborhood map
What this means for you Summary
Snapshot
- This is a 3-bed/2.0-bath multifamily listed at $55k.
Deal economics
- At list price, monthly cash flow is $685 ($8k/yr) — positive.
- The deal already cash-flows at list — no discount required.
- Meets the 1% rule at list price ($1k rent vs $55k).
- Recommended offer: $53k (3.0% below list) — sets the bar for market timing.
- Cap rate 21.2% vs local median 3.4% in Pasadena — top-decile yield for the area; either an underpriced asset or a hidden risk that comps aren't pricing in. Stress-test before assuming the spread holds.
Location & tenants
- Location reads 66/100 on livability (#600 in TX) — a middle-class / working-renter tenant base. Strengths: cost of living A+, housing A+; Watch: employment D+, crime F, amenities F.
- Pasadena ISD (suburban): math 29% / reading 32% proficiency, ranked #612 of 826 in TX (top 74%) — families likely to look elsewhere, expect single-tenant / working-renter base with shorter leases; 71% free/reduced lunch — lower-income household profile, screen leases tightly.
- Zoned schools: Golden Acres El (math 17% / reading 22%, grade F, #3,583 of 4,322 statewide, top 86%, 382 students, 90% FRL); Carter Lomax Middle (math 32% / reading 39%, grade F, #827 of 1,662 statewide, top 51%, 632 students, 74% FRL).
- Market conditions: Rents falling (-9.4%/yr); 77 active listings in the ZIP; 18 comparable units currently listed for rent nearby; rentals lingering (median 44d on market — plan ~5-8 weeks vacancy on turnover, expect pricing pressure); 56% of comp listings sitting > 30 days — soft ceiling on asking rent; 29,883 units permitted in Harris County in 2024 (8,621 in 5+ unit buildings).
Forward outlook
- Local home prices are declining (-3.0%/yr); year-one equity from $380 of loan paydown is wiped out by about $2k of value loss. Plan a longer hold.
- Harris County population projected at +47% by 2050 — long-run rental-demand tailwind backs the buy-and-hold thesis.
- At projected returns (-3.0% appreciation + 0.0% rent growth), your $15k cash investment doubles in ~3 years — after that, you're playing with house money.
Negotiation context
- It's been on market 36 days — a 3% lower offer ($53k) is reasonable based on typical stale-listing flexibility.
- 3 sale attempts with the ask held roughly flat each time — persistent listings suggest the price (not the market) is what's stuck; bring a comps-based counter.
Risks & watch-outs
- Watch-outs: built in 1956 — expect roof / HVAC / electrical / plumbing capex.
- Climate carrying-cost: severe wind risk, 99% chance of damaging wind over 30y; extreme-heat days projected 7→24/yr by 2055 (HVAC capex compounding) — expect insurance premiums to compound above CPI over the hold.
Questions for the listing agent
- It's been on market 36 days. Have you received any prior offers? Is the seller open to a 3% concession, seller financing, or rate buy-down credit?
- Built in 1956 — when were the roof, HVAC, electrical panel, plumbing, and water heater last replaced?
- Is there a deadline driving the sale (1031 exchange, divorce, estate, relocation)? That informs how much negotiation room exists.
- Schools are D-rated, which usually means shorter tenancies and higher turnover. Who's the typical renter profile here, and what's been the actual vacancy rate?
- Crime grade is F in this area — have there been break-ins, vandalism, or insurance claims at this property in the last 3 years? What carrier currently insures it and at what premium?
- What's the average days-on-market for RENTAL listings here right now (not sales)? A rising rental-DOM trend means longer vacancies and softer asking-rent achievability than the comps imply.
- What's the recent tenant-quality profile in this submarket — average credit score on applications, eviction rate, late-payment / NSF rate, and stable-employment percentage? A property-management company in the area should have these aggregated.
- How much new apartment / multifamily construction is in the pipeline within 1–3 miles? Heavy new supply (>2% of stock underway) typically softens rents 12–24 months out; light construction supports rent growth.
Investment metrics
- 1% rule
- 2.45% ✓
- Cap rate
- 21.24%
- Cash-on-cash
- 53.37%
- DSCR
- 3.37
- GRM
- 3.4
CMA / ARV
No comps found within radius.
Projected returns pro-forma
-3.0% appreciation · 0.0% rent growth · sell at horizon
- IRR
- 48.0%
- Equity multiple
- 3.00×
- Total profit
- $30,772
- Equity at exit
- $8,199
- IRR
- 52.4%
- Equity multiple
- 5.40×
- Total profit
- $67,771
- Equity at exit
- $4,754
Cash invested: $15,397 (down + closing). Projections, not guarantees.
Landlord ↔ Tenant lean methodology
- Overall (STATE)
- 87 Strongly Landlord-Friendly
- State Texas
- 87 Strongly Landlord-Friendly · R+5
- County
- — inherits STATE
- City
- — inherits STATE
ZIP-level market 77503
- Home prices YoY
- -13.7%
- Rents YoY
- -9.4%
- Active inventory
- 77
- Price-to-rent
- 3.4×
Monthly cashflow live
- Estimated rent
- $1,348 high interval (Pro) →
- Mortgage (P&I)
- −$288
- Tax est. 1.5%
- −$69 /mo · $825/yr
- Insurance
- −$23
- HOA
- −$0
- Vacancy / Maint / Mgmt
- −$283
- Net cashflow
- $685
Break-even live
UW: 25.0% down · 7.5% · 30yr · 1.5% tax · 5.0% vac · 8.0% maint · 8.0% mgmt
Financing live
Cash to close
- Down payment
- $13,747
- Closing costs
- $1,650
- Reserves months
- —
- Total cash needed
- —
Loan-product check · same deal, 3 products live
Conventional
25% down · 7.5% · 30yr
- Down + closing
- —
- Monthly P&I
- —
- Monthly cashflow
- —
- DSCR
- —
- Eligible?
- —
Personal DTI + credit; lowest rate.
DSCR
20% down · 8.5% · 30yr
- Down + closing
- —
- Monthly P&I
- —
- Monthly cashflow
- —
- DSCR
- —
- Eligible?
- —
No personal income docs; deal must DSCR.
Hard money
10% down · 12.0% · 12mo
- Down + closing
- —
- Monthly P&I
- —
- Monthly cashflow
- —
- DSCR
- —
- Eligible?
- —
Short-term bridge; refi at stabilization.
Rent comps 18 comps
| Address | Beds | Baths | Sqft | Rent | $/sqft | DOM | Units | Dist |
|---|---|---|---|---|---|---|---|---|
| 2824 Randolph Rd Unit 12 Pasadena, TX | 3.0 | 2.0 | 840 | $1,095 | $1.30 | 43d | 1 | 0.03mi |
| 6565 Spencer Hwy Unit 6622 Pasadena, TX | 2.0 | 2.0 | 858 | $1,087 | $1.27 | 2d | 1 | 0.54mi |
| 6565 Spencer Hwy Unit 6598 Pasadena, TX | 3.0 | 2.0 | 1200 | $1,602 | $1.33 | 2d | 1 | 0.54mi |
| 6565 Spencer Hwy Unit 2162 Pasadena, TX | 2.0 | 2.0 | 858 | $1,095 | $1.28 | 4d | 1 | 0.54mi |
| 6571 Spencer Hwy Pasadena, TX | 2.0 | 2.0 | 870 | $1,110 | $1.28 | 43d | 1 | 0.61mi |
| 4311 Glenwood Ave Deer Park, TX | 2.0 | 2.0 | 1028 | $1,001 | $0.97 | 43d | 1 | 0.88mi |
| 800 W Pasadena Blvd Deer Park, TX | 3.0 | 1.0–2.0 | 965 | $2,510 | $2.60 | 1d | 22 | 1.12mi |
| 7201 Spencer Hwy Pasadena, TX | 1.0–3.0 | 1.0–2.0 | 925 | $1,600 | $1.73 | 43d | 18 | 1.14mi |
| 7335 Carrie Ln Deer Park, TX | 2.0 | 1.0 | 870 | $900 | $1.03 | 43d | 1 | 1.19mi |
| 500 W Pasadena Blvd Deer Park, TX | 2.0–4.0 | 2.0–3.0 | 1300 | $2,030 | $1.56 | 1d | 25 | 1.34mi |
| 510 W Pasadena Blvd Deer Park, TX | 2.0 | 2.0 | 1125 | $1,476 | $1.31 | 43d | 1 | 1.35mi |
| 1516 Sam Houston Pkwy Pasadena, TX | 1.0–3.0 | 1.0–2.0 | 943 | $1,600 | $1.70 | 43d | 1 | 1.35mi |
| 407 McDermott St Deer Park, TX | 2.0 | 2.0 | 1025 | $1,220 | $1.19 | 43d | 1 | 1.36mi |
| 401 McDermott St Deer Park, TX | 1.0–2.0 | 1.0–2.0 | 940 | $1,585 | $1.69 | 5d | 13 | 1.38mi |
| 401 W Pasadena Blvd Deer Park, TX | 1.0–3.0 | 1.0–2.0 | 1038 | $2,090 | $2.01 | 1d | 21 | 1.42mi |
| 6066 Fairmont Pkwy Pasadena, TX | 2.0 | 2.0 | 1060 | $1,540 | $1.45 | 43d | 1 | 1.43mi |
| 3506 Red Bluff Rd Pasadena, TX | 2.0 | 1.0 | 936 | $976 | $1.04 | 43d | 1 | 1.44mi |
| 3500 Red Bluff Rd Pasadena, TX | 1.0–3.0 | 1.0–2.0 | 936 | $1,699 | $1.82 | 1d | 81 | 1.48mi |
Listing history 20 events
-
2026-06-18days on market $54,989 Active 36 DOM
-
2026-06-17days on market $54,989 Active 35 DOM
-
2026-06-16days on market $54,989 Active 34 DOM
-
2026-06-15days on market $54,989 Active 33 DOM
-
2026-06-13days on market $54,989 Active 31 DOM
-
2026-06-09days on market $54,989 Active 27 DOM
-
2026-06-08days on market $54,989 Active 26 DOM
-
2026-06-07days on market $54,989 Active 25 DOM
-
2026-06-04days on market $54,989 Active 22 DOM
-
2026-06-03days on market $54,989 Active 21 DOM
-
2026-06-02days on market $54,989 Active 20 DOM
-
2026-06-01days on market $54,989 Active 19 DOM
-
2026-05-31days on market $54,989 Active 18 DOM
-
2026-05-13$54,989 Active 459-char remark
-
2026-01-20$1,095
-
2026-01-15historical $450
-
2025-02-25$450
-
2023-11-03soldstatus
-
2015-12-04soldstatus
-
1988-01-02soldstatus
ⓘ Source: listings_history table (triggers on properties + properties_extension) + one-shot
backfill from property_details.listing_events for pre-trigger history.
Climate risk First Street
- Flood 4/10 Moderate FEMA zone X (unshaded) · 22% chance over 30 yrs
- Wildfire 1/10 Low
- Heat 9/10 Extreme 7 d/yr ≥109°F today · 24 d/yr by 30 yrs out
- Wind 9/10 Extreme 99% chance of damaging wind over 30 yrs
- Air quality 2/10 Low 2 unhealthy d/yr today · 2 by 30 yrs out
Nearby sold comps map
Loading sold comps map…
Walkable amenities ~0.75 mi
Loading nearby amenities…
Taxation est. · year 1
- Rental income
- $16,174
- − Mortgage interest
- −$3,080
- − Property taxes
- −$825
- − Insurance
- −$275
- − Repairs & maintenance
- −$1,294
- − Management
- −$1,294
- − Depreciation
- −$1,600
- Taxable income
- $7,806
- Est. tax owed @ 24.0%
- −$1,873
- After-tax cash flow
- $6,344/yr
For passive investors: Depreciation is non-cash, so a rental often shows a tax loss while cash-flowing — sheltering income. Rental losses are passive: they offset passive income freely, and up to $25,000/yr can offset ordinary (W-2) income if you actively participate and your MAGI is under $100k (phasing out to $0 by $150k); unused losses carry forward. On sale, claimed depreciation is recaptured at up to 25%, and gains may owe capital-gains tax (a 1031 exchange can defer both). Figures are a year-1 estimate at your 24.0% rate — not tax advice; consult a CPA.
Schools (NCES district)
- District
- Pasadena ISD
- NCES district ID
- 4834320
- Math proficiency
- 29% ▼ -17.00%
- Reading proficiency
- 32% ▼ -9.00%
- Median HH income
- $45,163
- Composite
- 26.15/100
- National rank
- #7275
- State rank
- #612 of 826 in TX
Livability — Pasadena
- Score
- 66/100
- State rank
- #600
- US rank
- #11438
Category grades
Schools grade is shown separately in the Schools card above.
Census & demographics
- Census place
- Pasadena, TX
- County
- Harris County · 4,702,590 people
- City population
- 109,190
- Metro
- Houston-The Woodlands-Sugar Land, TX
- Population (ZIP)
- 23,866
- Household income
- $66,797
- Rent vs Own
- Severe rent burden
- 1101.0
Population outlook (Harris County) Hauer SSP2
- Today (2025)
- 5,571,493 people
- By 2030
- 6,089,821 · +9.3%
- By 2040
- 7,142,806 · +28.2%
- By 2050
- 8,185,864 · +46.9%
- By 2075
- 10,574,329 · +89.8%
- By 2100
- 12,109,958 · +117.4%
Race, ethnicity, and origin ACS 2023
- Neighborhood character
- Predominantly Hispanic (75%)
- Race & ethnicity
- Hispanic / Latino 75% Two or more races 34% White 20% Native American 2% Black 2%
- Hispanic origin (detail)
- Mexican 62% Puerto Rican 3%
- Common ancestry
- Italian 3% Romanian 1% Lithuanian 1%
- Foreign-born
- 25% · Canada
- Languages at home
- 50% English-only · Spanish 49%
Political lean MEDSL · Harris
- 2024 margin
- Lean D (+5.5) · D 52.0% · R 46.4% · Other 1.6%
- 2008→2024 swing
- +3.9pp toward D · 2008: 1.6pp · 2024: 5.5pp
- All cycles
- 2024: D+5.5 2020: D+13.3 2016: D+12.4 2012: D+0.1 2008: D+1.6
Not yet ingested
- Civics
- —
Market trends
- HPI YoY
- ▼ -46.01%
- Current HPI
- 288.9079
- Rent YoY
- ▼ -9.41%
- Metro
- Houston-The Woodlands-Sugar Land, TX
- State GDP YoY
- ▲ 3.95%
- F500 in state
- 110
Industry mix (Fortune 500 HQ in TX)
| Industry | F500 HQs | Revenue |
|---|---|---|
| Energy | 16 | $1,198B |
|
||
| Technology | 5 | $198B |
|
||
| Engineering / Construction | 4 | $72B |
|
||
| Energy Services | 3 | $60B |
|
||
| Utilities | 3 | $41B |
|
||
| Healthcare | 2 | $330B |
|
||
Price history
+4921.8% since first listed7 events — show timeline
- 2026-05-13 Listed $54,989 HARMLS
- 2026-01-20 Listed for Rent $1,095 BUILDIUM
- 2026-01-15 Rental Removed $450 BUILDIUM
- 2025-02-25 Listed for Rent $450 BUILDIUM
- 2023-11-03 Sold (Public Records) — Public Records
- 2015-12-04 Sold (Public Records) — Public Records
- 1988-01-02 Sold (Public Records) — Public Records
Property tax history
+5.5%/yrLatest (2025): $7,022 · +3.2% YoY. Source: county tax records.
Cash-flow waterfall
monthlySold comps — $/sqft
last 12 mo · ≤1 miLoading sold comps…