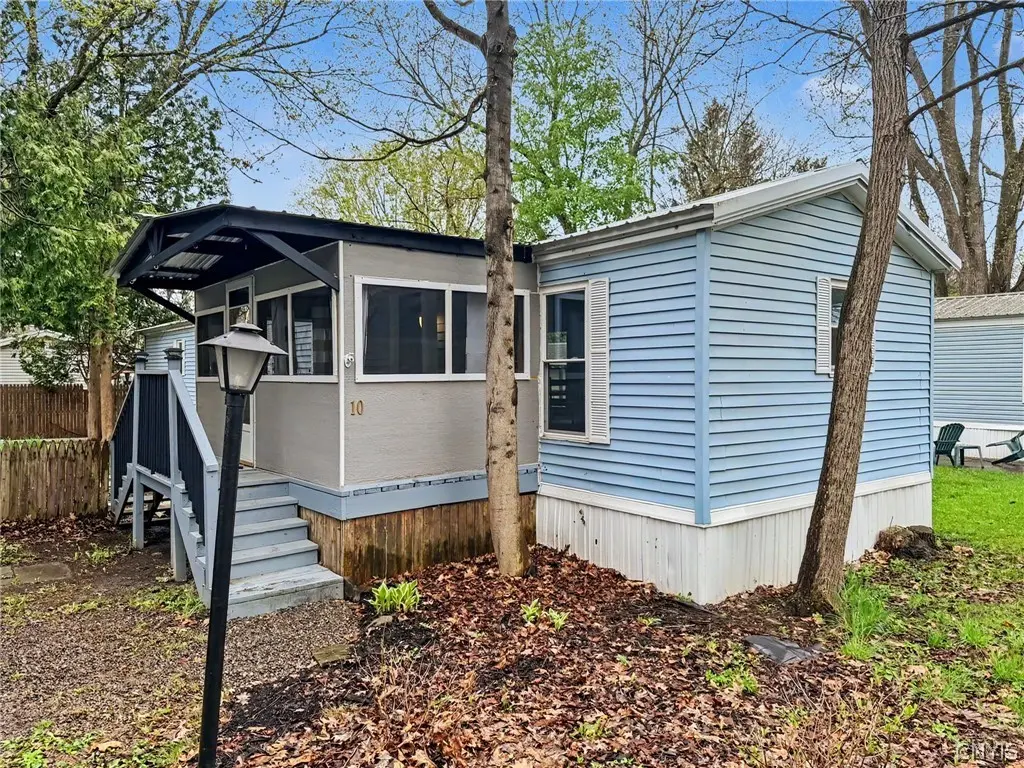
10 Fall Dr · Freeville, NY
Flood risk 1/10 · Minimal
- FEMA flood zone
- X
- Chance of flooding over 30 yrs
- 0.0%
- Est. flood insurance / yr
- $473 – $860
Fire risk 3/10 · Minor
- Est. fire insurance / yr
- $691 – $1,283
Heat risk 2/10 · Minimal
- Hot days now (above 92°F)
- 7 days/yr
- Hot days in 30 yrs
- 16 days/yr
Wind risk 2/10 · Minimal
- Chance of severe wind over 30 yrs
- 1.0%
Air-quality risk 2/10 · Minimal
- Unhealthy air days now
- 0 days/yr
- Unhealthy air days in 30 yrs
- 1 days/yr
Risk factors via First Street. Map © Google.
Why this score? — see what drove the B- grade
The composite is a weighted blend of 9 inputs, each scored 0–100. Each bar is that input's sub-score; the figure is the points it added to the 100-point composite (weight × sub-score).
- Cash flow +30.0/30.0
- 1% rule +10.0/10.0
- DSCR +10.0/10.0
- Schools +4.0/10.0
- Condition / age +4.0/5.0
- Livability +3.9/5.0
- Rent growth +3.8/5.0
- ARV discount +0.0/15.0
- Appreciation +0.0/10.0
$75,000
🖨 Deal sheet 📄 Offer letter ✓ Due diligence
Listing remarks
Move right in to this fully renovated 2-bedroom, 1-and-a-half-bath mobile home in a well-maintained park! This beautifully updated home offers a modern open layout, fresh finishes throughout, and included kitchen appliances: refrigerator, stove, and dishwasher. The spacious primary suite features its own full bath, while the second bedroom and additional bath provide comfortable space for guests, a home office, or hobbies. An enclosed porch adds extra living space to relax and enjoy, and the outdoor shed offers convenient storage. Located in a quiet community, this home provides affordable, low-maintenance living with comfort, style, and move-in-ready appeal. Don’t miss this opportuni
Key facts
- Fully renovated
- Modern open layout
- Outdoor shed
Tags
Property features AI
Exterior
- Parking: Driveway; No garage
- Utilities: Electricity connected; Public water connected; Sewer connected; Cable available; High-speed internet available
- Home design: Single-wide mobile home; Single-story; Existing construction
- Construction: Frame construction; Metal roof; Full basement
- Exterior features: Enclosed porch; Covered screened porch; Porch; Gravel driveway; Near public transit; Rectangular lot
Interior
- Kitchen: Dishwasher; Gas oven; Gas range; Refrigerator; Electric water heater
- Bedrooms: 2 main-level bedrooms
- Flooring: Laminate; Luxury vinyl; Varies
- Bathrooms: 2 full bathrooms (both on main level)
- Heating & cooling: Gas forced-air heating; Central air conditioning
- Interior features: Thermal windows; Kitchen/Family room combo; No stairs (accessible); Main level primary suite; Bedroom on main level
- Laundry & utility: Main level laundry
Neighborhood map
What this means for you Summary
Snapshot
- This is a 2-bed/2.0-bath manufactured listed at $75k. Condition is rated good.
Deal economics
- At list price, monthly cash flow is $832 ($10k/yr) — positive.
- The deal already cash-flows at list — no discount required.
- Meets the 1% rule at list price ($2k rent vs $75k).
- Recommended offer: $74k (1.5% below list) — sets the bar for market timing.
Location & tenants
- Location reads 77/100 on livability (#198 in NY, #3,035 nationally) — a middle-class / working-renter tenant base. Strengths: employment A+, housing A+, health & safety A+; Watch: crime D+, amenities F.
- Dryden Central School District (rural): math 38% / reading 53% proficiency, ranked #443 of 590 in NY (top 75%) — families likely to look elsewhere, expect single-tenant / working-renter base with shorter leases.
- Market conditions: Rents rising fast (+5.2%/yr); 327 active listings in the ZIP; 1 comparable units currently listed for rent nearby; 382 units permitted in Tompkins County in 2024 (208 in 5+ unit buildings).
Forward outlook
- Local home prices are declining (-3.0%/yr); year-one equity from $519 of loan paydown is wiped out by about $2k of value loss. Plan a longer hold.
- Tompkins County population projected at +17% by 2050 — long-run rental-demand tailwind backs the buy-and-hold thesis.
- At projected returns (-3.0% appreciation + 5.2% rent growth), your $21k cash investment doubles in ~3 years — after that, you're playing with house money.
Negotiation context
- It's been on market 30 days — a 2% lower offer ($74k) is reasonable based on typical stale-listing flexibility.
- 2 sale attempts with the ask held roughly flat each time — persistent listings suggest the price (not the market) is what's stuck; bring a comps-based counter.
Questions for the listing agent
- Is there a deadline driving the sale (1031 exchange, divorce, estate, relocation)? That informs how much negotiation room exists.
- Crime grade is D in this area — have there been break-ins, vandalism, or insurance claims at this property in the last 3 years? What carrier currently insures it and at what premium?
- What's the average days-on-market for RENTAL listings here right now (not sales)? A rising rental-DOM trend means longer vacancies and softer asking-rent achievability than the comps imply.
- What's the recent tenant-quality profile in this submarket — average credit score on applications, eviction rate, late-payment / NSF rate, and stable-employment percentage? A property-management company in the area should have these aggregated.
- How much new for-sale + rental construction is in the pipeline within 1–3 miles? Heavy new supply typically softens prices + rents 12–24 months out; constrained supply supports both.
Investment metrics
- 1% rule
- 2.28% ✓
- Cap rate
- 19.61%
- Cash-on-cash
- 47.56%
- DSCR
- 3.12
- GRM
- 3.7
CMA / ARV
- ARV (on-the-fly)
- $51,940
- Comps found
- 3
Show comp detail 3 sales within ~0.75 mi
| Address | Dist | Beds/Ba | Sqft | Sold | Price | $/sf | Match |
|---|---|---|---|---|---|---|---|
| 7 Fall Drive Dr | 0.02mi | 2/1.0 | 980 (0%) | 22mo | $60,000 | $61 | 77 |
| 99 Wood Rd #11 | 0.60mi | 2/2.0 | 952 (-3%) | 0mo | $50,000 | $53 | 67 |
| 17 Bills Way | 0.59mi | 2/1.5 | 980 (0%) | 17mo | $30,000 | $31 | 56 |
Match score weights: distance 35% · size 25% · config 20% · recency 20%. Top-matched comps best support the ARV.
Projected returns pro-forma
-3.0% appreciation · 5.22% rent growth · sell at horizon
- IRR
- 47.5%
- Equity multiple
- 3.13×
- Total profit
- $44,782
- Equity at exit
- $11,183
- IRR
- 54.1%
- Equity multiple
- 6.91×
- Total profit
- $124,116
- Equity at exit
- $6,485
Cash invested: $21,000 (down + closing). Projections, not guarantees.
Landlord ↔ Tenant lean methodology
- Overall (STATE)
- 15 Strongly Tenant-Friendly
- State New York
- 15 Strongly Tenant-Friendly · D+10
- County
- — inherits STATE
- City
- — inherits STATE
ZIP-level market 14850
- Rents YoY
- 5.2%
- Active inventory
- 327
- Price-to-rent
- 3.7×
Monthly cashflow live
- Estimated rent
- $1,710 medium interval (Pro) →
- Mortgage (P&I)
- −$393
- Tax est. 1.5%
- −$94 /mo · $1,125/yr
- Insurance
- −$31
- HOA
- −$0
- Vacancy / Maint / Mgmt
- −$359
- Net cashflow
- $832
Break-even live
UW: 25.0% down · 7.5% · 30yr · 1.5% tax · 5.0% vac · 8.0% maint · 8.0% mgmt
Financing live
Cash to close
- Down payment
- $18,750
- Closing costs
- $2,250
- Reserves months
- —
- Total cash needed
- —
Loan-product check · same deal, 3 products live
Conventional
25% down · 7.5% · 30yr
- Down + closing
- —
- Monthly P&I
- —
- Monthly cashflow
- —
- DSCR
- —
- Eligible?
- —
Personal DTI + credit; lowest rate.
DSCR
20% down · 8.5% · 30yr
- Down + closing
- —
- Monthly P&I
- —
- Monthly cashflow
- —
- DSCR
- —
- Eligible?
- —
No personal income docs; deal must DSCR.
Hard money
10% down · 12.0% · 12mo
- Down + closing
- —
- Monthly P&I
- —
- Monthly cashflow
- —
- DSCR
- —
- Eligible?
- —
Short-term bridge; refi at stabilization.
Rent comps 1 comps
| Address | Beds | Baths | Sqft | Rent | $/sqft | DOM | Units | Dist |
|---|---|---|---|---|---|---|---|---|
| 11 Mineah Rd Freeville, NY | 2.0 | 1.0 | 850 | $1,275 | $1.50 | 21d | 2 | 0.84mi |
Listing history 21 events
-
2026-06-19days on market $75,000 Active 30 DOM
-
2026-06-18days on market $75,000 Active 29 DOM
-
2026-06-17days on market $75,000 Active 28 DOM
-
2026-06-16days on market $75,000 Active 27 DOM
-
2026-06-15days on market $75,000 Active 26 DOM
-
2026-06-14days on market $75,000 Active 24 DOM
-
2026-06-13days on market $75,000 Active 23 DOM
-
2026-06-10days on market $75,000 Active 21 DOM
-
2026-06-09days on market $75,000 Active 20 DOM
-
2026-06-08days on market $75,000 Active 19 DOM
-
2026-06-07days on market $75,000 Active 18 DOM
-
2026-06-05days on market $75,000 Active 15 DOM
-
2026-06-03days on market $75,000 Active 14 DOM
-
2026-06-02days on market $75,000 Active 13 DOM
-
2026-06-01days on market $75,000 Active 12 DOM
-
2026-05-31days on market $75,000 Active 11 DOM
-
2026-05-30days on market $75,000 Active 10 DOM
-
2026-05-20$75,000 Active
-
2025-12-31historical
-
2025-10-31price $87,000
-
2025-07-30$90,000 Active
ⓘ Source: listings_history table (triggers on properties + properties_extension) + one-shot
backfill from property_details.listing_events for pre-trigger history.
Climate risk First Street
- Flood 1/10 Low FEMA zone X · 0% chance over 30 yrs
- Wildfire 3/10 Moderate
- Heat 2/10 Low 7 d/yr ≥92°F today · 16 d/yr by 30 yrs out
- Wind 2/10 Low 100% chance of damaging wind over 30 yrs
- Air quality 2/10 Low 0 unhealthy d/yr today · 1 by 30 yrs out
Nearby sold comps map
Loading sold comps map…
Walkable amenities ~0.75 mi
Loading nearby amenities…
Taxation est. · year 1
- Rental income
- $20,515
- − Mortgage interest
- −$4,201
- − Property taxes
- −$1,125
- − Insurance
- −$375
- − Repairs & maintenance
- −$1,641
- − Management
- −$1,641
- − Depreciation
- −$2,182
- Taxable income
- $9,349
- Est. tax owed @ 24.0%
- −$2,244
- After-tax cash flow
- $7,743/yr
For passive investors: Depreciation is non-cash, so a rental often shows a tax loss while cash-flowing — sheltering income. Rental losses are passive: they offset passive income freely, and up to $25,000/yr can offset ordinary (W-2) income if you actively participate and your MAGI is under $100k (phasing out to $0 by $150k); unused losses carry forward. On sale, claimed depreciation is recaptured at up to 25%, and gains may owe capital-gains tax (a 1031 exchange can defer both). Figures are a year-1 estimate at your 24.0% rate — not tax advice; consult a CPA.
Condition & rehab AI · 1 photo
This fully renovated mobile home is move-in ready with modern updates and a good condition score. Minor improvements to the exterior and landscaping would further enhance its value.
Value-add opportunities
- Both Paint exterior siding — Enhances curb appeal and value
- Both Landscaping improvements — Enhances curb appeal and value
- Both Replace outdoor shed — Improves storage and adds value
Renovation cost estimate screening
Value-add ROI direction
- Both Paint exterior siding — Enhances curb appeal and value ↑
- Both Landscaping improvements — Enhances curb appeal and value ↑
- Both Replace outdoor shed — Improves storage and adds value ↑
ⓘ Cost ranges are severity-bucket heuristics (US national rule-of-thumb). Get contractor quotes + a written scope before underwriting a rehab budget.
Schools (NCES district)
- District
- Dryden Central School District
- NCES district ID
- 3609330
- Math proficiency
- 38% ▼ -13.00%
- Reading proficiency
- 53% ▲ 13.00%
- Median HH income
- $56,766
- Composite
- 39.65/100
- National rank
- #3914
- State rank
- #443 of 590 in NY
Livability — Freeville
- Score
- 77/100
- State rank
- #198
- US rank
- #3035
Category grades
Schools grade is shown separately in the Schools card above.
Census & demographics
- County
- Tompkins County · 68,610 people
- Metro
- Ithaca, NY
- Population (ZIP)
- 68,610
- Household income
- $71,445
- Rent vs Own
- Severe rent burden
- 5169.0
Population outlook (Tompkins County) Hauer SSP2
- Today (2025)
- 113,958 people
- By 2030
- 118,774 · +4.2%
- By 2040
- 125,927 · +10.5%
- By 2050
- 133,599 · +17.2%
- By 2075
- 156,759 · +37.6%
- By 2100
- 169,896 · +49.1%
Race, ethnicity, and origin ACS 2023
- Neighborhood character
- Predominantly White (68%)
- Race & ethnicity
- White 68% Asian 13% Hispanic / Latino 8% Two or more races 8% Black 4%
- Hispanic origin (detail)
- Mexican 2% Puerto Rican 2%
- Common ancestry
- Romanian 3% Italian 3% Scotch-Irish 2%
- Foreign-born
- 18% · China, Canada, South Korea
- Languages at home
- 79% English-only · Chinese 5% Spanish 4% Other Indo-European 4%
Political lean MEDSL · Tompkins
- 2024 margin
- Solid D (+50.6) · D 75.3% · R 24.7%
- 2008→2024 swing
- +8.6pp toward D · 2008: 42.1pp · 2024: 50.6pp
- All cycles
- 2024: D+50.6 2020: D+49.2 2016: D+42.1 2012: D+39.8 2008: D+42.1
Not yet ingested
- Civics
- —
Market trends
- HPI YoY
- ▼ -276.59%
- Current HPI
- 389.7215
- Rent YoY
- ▲ 5.22%
- Metro
- Ithaca, NY
- State GDP YoY
- ▲ 2.60%
- F500 in state
- 92
Industry mix (Fortune 500 HQ in NY)
| Industry | F500 HQs | Revenue |
|---|---|---|
| Financial Services | 10 | $950B |
|
||
| Consumer Goods | 9 | $162B |
|
||
| Insurance | 4 | $225B |
|
||
| Telecommunications | 2 | $144B |
|
||
| Pharmaceuticals | 2 | $112B |
|
||
| Media / Entertainment | 2 | $69B |
|
||
Price history
-16.7% since first listed4 events — show timeline
- 2026-05-20 Listed $75,000 CNYIS
- 2025-12-31 Listing Removed — CNYIS
- 2025-10-31 Price Changed $87,000 CNYIS
- 2025-07-30 Listed $90,000 CNYIS
Cash-flow waterfall
monthlySold comps — $/sqft
last 12 mo · ≤1 miLoading sold comps…