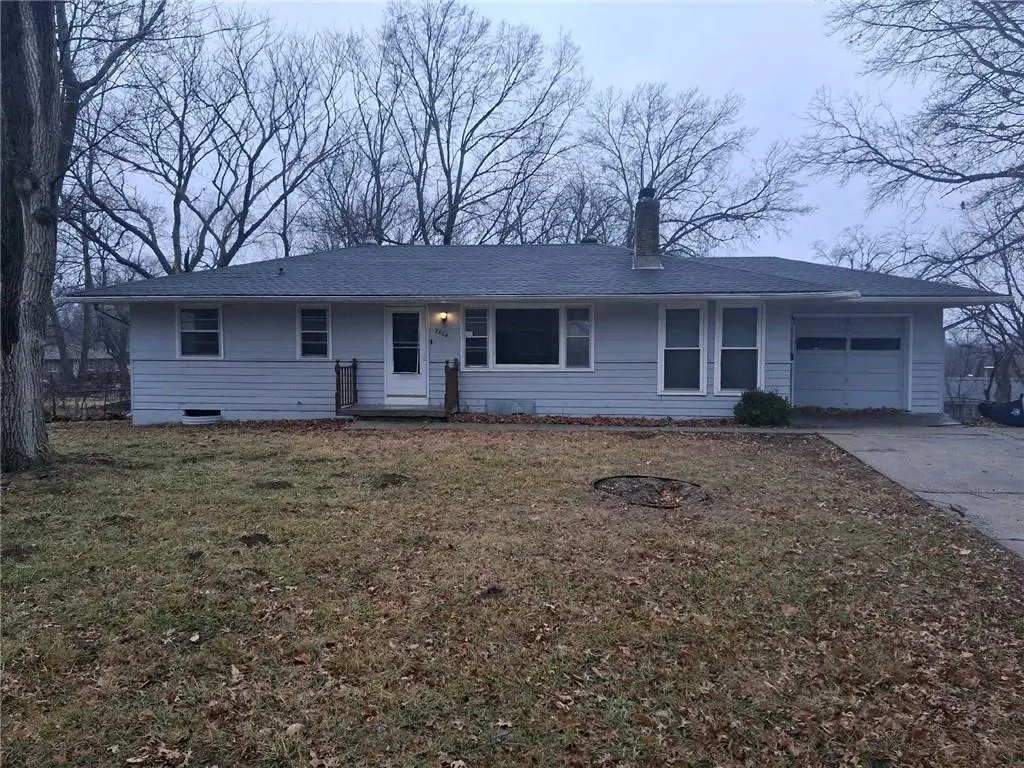
7804 Booth Ave · Kansas City, MO
Flood risk 1/10 · Minimal
- FEMA flood zone
- X (unshaded)
- Chance of flooding over 30 yrs
- 0.0%
- Est. flood insurance / yr
- $473 – $860
Fire risk 1/10 · Minimal
- Est. fire insurance / yr
- $1,054 – $1,958
Heat risk 3/10 · Minor
- Hot days now (above 106°F)
- 7 days/yr
- Hot days in 30 yrs
- 16 days/yr
Wind risk 2/10 · Minimal
- Chance of severe wind over 30 yrs
- —
Air-quality risk 3/10 · Minor
- Unhealthy air days now
- 3 days/yr
- Unhealthy air days in 30 yrs
- 5 days/yr
Risk factors via First Street. Map © Google.
Why this score? — see what drove the C grade
The composite is a weighted blend of 9 inputs, each scored 0–100. Each bar is that input's sub-score; the figure is the points it added to the 100-point composite (weight × sub-score).
- Cash flow +20.1/30.0
- ARV discount +15.0/15.0
- DSCR +6.4/10.0
- 1% rule +5.2/10.0
- Livability +3.9/5.0
- Rent growth +3.3/5.0
- Condition / age +2.5/5.0
- Schools +1.8/10.0
- Appreciation +0.0/10.0
$164,900
🖨 Deal sheet (PDF) 📄 Offer letter ✓ Due diligence
Listing remarks MLS
Outstanding opportunity for investors and renovators to bring their vision to this classic 3-bedroom, 2-bathroom home with great bones! The straightforward layout offers a solid foundation for your custom updates, perfectly complemented by a partially finished basement. Outside, an ample backyard provides a wonderful blank canvas for future landscaping or an outdoor entertaining space. Don't miss the chance to build equity and maximize the potential of this true investor special!
Key facts
- Ample backyard
- 0.4 acre lot
- Garage
Tags
Neighborhood map
What this means for you Summary
Snapshot
- This is a 3-bed/2.0-bath single-family listed at $165k.
Deal economics
- At list price, monthly cash flow is $206 ($2k/yr) — positive.
- The deal already cash-flows at list — no discount required.
- Meets the 1% rule at list price ($2k rent vs $165k).
- Recommended offer: $150k (9.0% below list) — sets the bar for market timing.
- Cap rate 7.8% vs local median 3.9% in Kansas City — top-decile yield for the area; either an underpriced asset or a hidden risk that comps aren't pricing in. Stress-test before assuming the spread holds.
Location & tenants
- Location reads 78/100 on livability (#28 in MO, #2,671 nationally) — a middle-class / working-renter tenant base. Strengths: amenities A+, commute A+, cost of living A+; Watch: crime F.
- Raytown C-2 (suburban): math 12% / reading 28% proficiency, ranked #302 of 324 in MO (top 93%) — low school quality limits family demand, transient renter base, plan for 1-2y turnover.
- Zoned schools: Westridge Elem. (math 2% / reading 17%, grade F, #1,037 of 1,115 statewide, top 94%, 321 students, 74% FRL); South Middle (math 6% / reading 25%, grade F, #359 of 391 statewide, top 92%, 522 students, 73% FRL); Raytown South Sr. High (math 8% / reading 32%, grade F, #475 of 521 statewide, top 92%, 1,185 students, 68% FRL) — zoned schools average 72% FRL vs 54% district-wide (18 pts higher); higher-poverty schools than district average — tighter screening recommended.
- Market conditions: Rents rising (+3.1%/yr); 140 active listings in the ZIP; 15 comparable units currently listed for rent nearby; rentals at typical pace (median 19d on market — plan ~3-4 weeks tenant-placement turnaround); 4,002 units permitted in Jackson County in 2024 (2,271 in 5+ unit buildings).
- This rent runs 35% of the median local income ($59k/yr) — at the standard rent-burdened threshold; future hikes will face affordability resistance.
Forward outlook
- Local home prices are declining (-3.0%/yr); year-one equity from $1k of loan paydown is wiped out by about $5k of value loss. Plan a longer hold.
- Jackson County population projected at +4% by 2050 — modest demand growth; plan on rents tracking national, not racing it.
Negotiation context
- It's been on market 91 days — a 9% lower offer ($150k) is reasonable based on typical stale-listing flexibility.
- 6 sale attempts since 21y ago with the ask held roughly flat each time — persistent listings suggest the price (not the market) is what's stuck; bring a comps-based counter.
Risks & watch-outs
- Watch-outs: built in 1956 — expect roof / HVAC / electrical / plumbing capex.
Questions for the listing agent
- It's been on market 91 days. Have you received any prior offers? Is the seller open to a 9% concession, seller financing, or rate buy-down credit?
- Built in 1956 — when were the roof, HVAC, electrical panel, plumbing, and water heater last replaced?
- Why hasn't it sold? Are there any deal-killer items the seller is aware of (foundation, flood, title, zoning, code violations)?
- Is there a deadline driving the sale (1031 exchange, divorce, estate, relocation)? That informs how much negotiation room exists.
- Crime grade is F in this area — have there been break-ins, vandalism, or insurance claims at this property in the last 3 years? What carrier currently insures it and at what premium?
- What's the average days-on-market for RENTAL listings here right now (not sales)? A rising rental-DOM trend means longer vacancies and softer asking-rent achievability than the comps imply.
- What's the recent tenant-quality profile in this submarket — average credit score on applications, eviction rate, late-payment / NSF rate, and stable-employment percentage? A property-management company in the area should have these aggregated.
- How much new for-sale + rental construction is in the pipeline within 1–3 miles? Heavy new supply typically softens prices + rents 12–24 months out; constrained supply supports both.
Investment metrics
- 1% rule
- 1.02% ✓
- Cap rate
- 7.79%
- Cash-on-cash
- 5.36%
- DSCR
- 1.24
- GRM
- 8.1
CMA / ARV
- ARV (median comp)
- $209,716
- List price
- $164,900
- Delta
- -21.37%
- Verdict
- UNDERPRICED
- Comps
- 20 within 1.0 mi
Show comp detail 12 sales within ~0.75 mi
| Address | Dist | Beds/Ba | Sqft | Sold | Price | $/sf | Match |
|---|---|---|---|---|---|---|---|
| 7835 Donnelly Ave | 0.13mi | 3/2.0 | 1,728 (+1%) | 1mo | $199,999 | $116 | 91 |
| 8604 E 79th St | 0.06mi | 3/2.0 | 1,703 (-0%) | 10mo | $209,000 | $123 | 89 |
| 7800 Booth Ave | 0.03mi | 4/2.0 (+1) | 1,912 (+12%) | 2mo | $225,000 | $118 | 72 |
| 8007 Blue Ridge Blvd | 0.26mi | 4/2.5 (+1) | 1,592 (-7%) | 1mo | $274,000 | $172 | 69 |
| 8609 E 77th St | 0.20mi | 3/2.0 | 1,539 (-10%) | 13mo | $185,000 | $120 | 64 |
| 7626 Sycamore Ave | 0.46mi | 4/2.5 (+1) | 1,763 (+4%) | 4mo | $250,000 | $142 | 62 |
| 8305 Booth Ave | 0.60mi | 3/2.5 | 1,680 (-1%) | 12mo | $289,999 | $173 | 58 |
| 9001 E 75th St | 0.69mi | 3/2.5 | 1,764 (+4%) | 4mo | $135,000 | $77 | 57 |
| 9203 E 79th St | 0.73mi | 3/3.0 | 1,764 (+4%) | 3mo | $249,950 | $142 | 53 |
| 8819 E 80th Ter | 0.46mi | 4/3.0 (+1) | 1,863 (+9%) | 4mo | $240,000 | $129 | 51 |
| 9011 E 75th St | 0.74mi | 3/2.0 | 1,632 (-4%) | 9mo | $189,900 | $116 | 51 |
| 8721 E 74 St | 0.63mi | 3/2.5 | 1,462 (-14%) | 8mo | $257,000 | $176 | 38 |
Match score weights: distance 35% · size 25% · config 20% · recency 20%. Top-matched comps best support the ARV.
Projected returns pro-forma
-3.0% appreciation · 3.07% rent growth · sell at horizon
- IRR
- -7.9%
- Equity multiple
- 0.71×
- Total profit
- $-13,447
- Equity at exit
- $24,587
- IRR
- 1.8%
- Equity multiple
- 1.12×
- Total profit
- $5,767
- Equity at exit
- $14,258
Cash invested: $46,172 (down + closing). Projections, not guarantees.
Landlord ↔ Tenant lean methodology
- Overall (STATE)
- 81 Strongly Landlord-Friendly
- State Missouri
- 81 Strongly Landlord-Friendly · R+10
- County
- — inherits STATE
- City
- — inherits STATE
ZIP-level market 64138
- Rents YoY
- 3.1%
- Active inventory
- 140
- Price-to-rent
- 8.1×
Monthly cashflow live
- Estimated rent
- $1,688 high interval (Pro) →
- Mortgage (P&I)
- −$865
- Tax from tax record
- −$194 /mo · $2,325/yr
- Insurance
- −$69
- HOA
- −$0
- Vacancy / Maint / Mgmt
- −$354
- Net cashflow
- $206
Break-even live
Sensitivity live
| Price | -10% $300 | -5% $253 | +0% $206 | +5% $160 | +10% $113 |
|---|---|---|---|---|---|
| Rent | -10% $73 | -5% $140 | +0% $206 | +5% $273 | +10% $340 |
| Rate | -1.0pp $289 | -0.5pp $248 | base $206 | +0.5pp $164 | +1.0pp $120 |
UW: 25.0% down · 7.5% · 30yr · 1.5% tax · 5.0% vac · 8.0% maint · 8.0% mgmt
Financing live
Cash to close
- Down payment
- $41,225
- Closing costs
- $4,947
- Reserves months
- —
- Total cash needed
- —
Loan-product check · same deal, 3 products live
Conventional
25% down · 7.5% · 30yr
- Down + closing
- —
- Monthly P&I
- —
- Monthly cashflow
- —
- DSCR
- —
- Eligible?
- —
Personal DTI + credit; lowest rate.
DSCR
20% down · 8.5% · 30yr
- Down + closing
- —
- Monthly P&I
- —
- Monthly cashflow
- —
- DSCR
- —
- Eligible?
- —
No personal income docs; deal must DSCR.
Hard money
10% down · 12.0% · 12mo
- Down + closing
- —
- Monthly P&I
- —
- Monthly cashflow
- —
- DSCR
- —
- Eligible?
- —
Short-term bridge; refi at stabilization.
Rent comps 15 comps
| Address | Beds | Baths | Sqft | Rent | $/sqft | DOM | Units | Dist |
|---|---|---|---|---|---|---|---|---|
| 8713 E 77th Ter Kansas City, MO | 3.0 | 2.0 | 1124 | $1,800 | $1.60 | 45d | 1 | 0.20mi |
| 7720 Elm Ave Kansas City, MO | 3.0 | 1.5 | 1400 | $1,700 | $1.21 | 45d | 1 | 0.79mi |
| 7905 Elm Ave Raytown, MO | 3.0 | 1.5 | 1104 | $1,700 | $1.54 | 4d | 1 | 0.83mi |
| 8800 E 71st Ter Raytown, MO | 3.0 | 2.0 | 1497 | $1,650 | $1.10 | 25d | 1 | 0.91mi |
| 7712 Arlington Ave Raytown, MO | 3.0 | 2.0 | 1358 | $1,741 | $1.28 | 14d | 1 | 0.97mi |
| 9400 E 82nd St Raytown, MO | 3.0 | 2.0 | 1396 | $1,606 | $1.15 | 5d | 1 | 1.00mi |
| 7607 Arlington Ave Raytown, MO | 3.0 | 1.5 | 1225 | $1,461 | $1.19 | 18d | 1 | 1.02mi |
| 9000 E 85th Pl Raytown, MO | 3.0 | 2.0 | 1580 | $1,375 | $0.87 | 45d | 1 | 1.07mi |
| 8500 Elm Ave Raytown, MO | 3.0 | 2.0 | 1250 | $1,550 | $1.24 | 45d | 1 | 1.16mi |
| 7600 E 70th Ter Kansas City, MO | 3.0 | 2.0 | 1604 | $1,601 | $1.00 | 6d | 1 | 1.19mi |
| 8607 Corrington Ave Kansas City, MO | 4.0 | 2.5 | 1754 | $1,720 | $0.98 | 45d | 1 | 1.32mi |
| 9005 E 68th Ter Raytown, MO | 4.0 | 2.0 | 1566 | $1,936 | $1.24 | 5d | 1 | 1.34mi |
| 8812 Manchester Ave Kansas City, MO | 3.0 | 1.0 | 1066 | $1,586 | $1.49 | 14d | 1 | 1.38mi |
| 10213 E 78 St Raytown, MO | 3.0 | 2.0 | 1160 | $1,410 | $1.22 | 23d | 1 | 1.44mi |
| 7902 E 89th Ter Kansas City, MO | 3.0 | 1.5 | 1068 | $1,516 | $1.42 | 19d | 1 | 1.45mi |
Listing history 27 events
-
2026-06-13statusdays on market $164,900 Pending 91 DOM
-
2026-06-09days on market $164,900 Active 90 DOM
-
2026-06-08days on market $164,900 Active 89 DOM
-
2026-06-07days on market $164,900 Active 88 DOM
-
2026-06-03days on market $164,900 Active 84 DOM
-
2026-06-02days on market $164,900 Active 83 DOM
-
2026-06-01days on market $164,900 Active 82 DOM
-
2026-05-31days on market $164,900 Active 81 DOM
-
2026-03-11$170,000 Active 484-char remark
Show marketing remark (484 chars)
Outstanding opportunity for investors and renovators to bring their vision to this classic 3-bedroom, 2-bathroom home with great bones! The straightforward layout offers a solid foundation for your custom updates, perfectly complemented by a partially finished basement. Outside, an ample backyard provides a wonderful blank canvas for future landscaping or an outdoor entertaining space. Don't miss the chance to build equity and maximize the potential of this true investor special!
-
2025-09-22historical $1,880
-
2025-09-20$1,880
-
2023-08-29historical $1,365
-
2023-08-26historical $1,365
-
2023-08-19price $1,365
-
2023-08-18price $1,365
-
2023-08-12price $1,665
-
2023-08-11price $1,665
-
2023-08-09price $1,675
-
2023-08-08price $1,675
-
2023-07-31$1,615
-
2023-07-31$1,615
-
2010-03-05soldstatus 499-char remark
Show marketing remark (499 chars)
Ranch with walkout basement on large lot in Raytown School District. Bank owned property selling in AS IS condition. No Seller's Disclosure available. Inspections welcome, seller will make no repairs. Earnest money $1000 MINIMUM CERTIFIED FUNDS ONLY PLEASE. Preapproval or proof of funds to accompany all offers. Seller Financing through Loan Acceptance Corp. Contact listing agent for details. Only complete contracts can be submitted to seller. Contact listing agent with any questions. Thank you!
-
2009-10-20$59,900 499-char remark
Show marketing remark (499 chars)
Ranch with walkout basement on large lot in Raytown School District. Bank owned property selling in AS IS condition. No Seller's Disclosure available. Inspections welcome, seller will make no repairs. Earnest money $1000 MINIMUM CERTIFIED FUNDS ONLY PLEASE. Preapproval or proof of funds to accompany all offers. Seller Financing through Loan Acceptance Corp. Contact listing agent for details. Only complete contracts can be submitted to seller. Contact listing agent with any questions. Thank you!
-
2005-05-03soldstatus
-
2005-04-29soldstatus
-
2005-02-18$99,950
-
1995-03-27soldstatus
ⓘ Source: listings_history table (triggers on properties + properties_extension) + one-shot
backfill from property_details.listing_events for pre-trigger history.
Tax reassessment forecast MO · Resets to sale price
- Current annual tax
- $2,325 · $194/mo
- Projected year-2 tax
- $2,325 · $194/mo
- Expected delta
- $0/yr ($0/mo · 0.0%)
ⓘ Screening estimate from a state-policy table — verify with the county assessor before closing.
Climate risk First Street
- Flood 1/10 Low FEMA zone X (unshaded) · 0% chance over 30 yrs
- Wildfire 1/10 Low
- Heat 3/10 Moderate 7 d/yr ≥106°F today · 16 d/yr by 30 yrs out
- Wind 2/10 Low
- Air quality 3/10 Moderate 3 unhealthy d/yr today · 5 by 30 yrs out
Nearby sold comps map
Loading sold comps map…
Walkable amenities ~0.75 mi
Loading nearby amenities…
Taxation est. · year 1
- Rental income
- $20,255
- − Mortgage interest
- −$9,237
- − Property taxes
- −$2,325
- − Insurance
- −$824
- − Repairs & maintenance
- −$1,620
- − Management
- −$1,620
- − Depreciation
- −$4,797
- Taxable loss
- −$169
- Est. tax savings @ 24.0%
- +$41
- After-tax cash flow
- $2,516/yr
For passive investors: Depreciation is non-cash, so a rental often shows a tax loss while cash-flowing — sheltering income. Rental losses are passive: they offset passive income freely, and up to $25,000/yr can offset ordinary (W-2) income if you actively participate and your MAGI is under $100k (phasing out to $0 by $150k); unused losses carry forward. On sale, claimed depreciation is recaptured at up to 25%, and gains may owe capital-gains tax (a 1031 exchange can defer both). Figures are a year-1 estimate at your 24.0% rate — not tax advice; consult a CPA.
Schools (NCES district)
- District
- Raytown C-2
- NCES district ID
- 2926070
- Math proficiency
- 12% ▼ -11.00%
- Reading proficiency
- 28% ▼ -9.00%
- Median HH income
- $47,215
- Composite
- 17.59/100
- National rank
- #9039
- State rank
- #302 of 324 in MO
Livability — Kansas City
- Score
- 78/100
- State rank
- #28
- US rank
- #2671
Category grades
Schools grade is shown separately in the Schools card above.
Census & demographics
- Census place
- Kansas City, MO
- County
- Jackson County · 687,798 people
- City population
- 439,467
- Metro
- Kansas City, MO-KS
- Population (ZIP)
- 23,805
- Household income
- $58,638
- Rent vs Own
- Severe rent burden
- 810.0
Population outlook (Jackson County) Hauer SSP2
- Today (2025)
- 719,589 people
- By 2030
- 731,456 · +1.6%
- By 2040
- 746,689 · +3.8%
- By 2050
- 749,289 · +4.1%
- By 2075
- 736,227 · +2.3%
- By 2100
- 668,210 · -7.1%
Race, ethnicity, and origin ACS 2023
- Neighborhood character
- Diverse neighborhood (Simpson 0.61)
- Race & ethnicity
- Black 46% White 42% Two or more races 6% Hispanic / Latino 5% Asian 2%
- Common ancestry
- Slovak 2% Ukrainian 1% Italian 1%
- Foreign-born
- 6% · Canada, China
- Languages at home
- 91% English-only · Spanish 4% Arabic 3% Other Indo-European 1%
Political lean MEDSL · Jackson
- 2024 margin
- D (+19.3) · D 58.9% · R 39.5% · Other 1.6%
- 2008→2024 swing
- -6.1pp toward R · 2008: 25.4pp · 2024: 19.3pp
- All cycles
- 2024: D+19.3 2020: D+22.0 2016: D+16.6 2012: D+19.0 2008: D+25.4
Not yet ingested
- Civics
- —
Market trends
- HPI YoY
- ▼ -186.34%
- Current HPI
- 274.681
- Rent YoY
- ▲ 3.07%
- Metro
- Kansas City, MO-KS
- State GDP YoY
- ▲ 1.84%
- F500 in state
- 20
Industry mix (Fortune 500 HQ in MO)
| Industry | F500 HQs | Revenue |
|---|---|---|
| Healthcare | 1 | $163B |
|
||
| Insurance | 1 | $21B |
|
||
| Industrial Technology | 1 | $17B |
|
||
| Retail | 1 | $16B |
|
||
| Industrial Distribution | 1 | $10B |
|
||
| Utilities | 1 | $9B |
|
||
Price history
+70.1% since first listed19 events — show timeline
- 2026-03-11 Listed $170,000 Heartland MLS as Distributed by MLS Grid
- 2025-09-22 Rental Removed $1,880 RENTLY
- 2025-09-20 Listed for Rent $1,880 RENTLY
- 2023-08-29 Rental Removed $1,365 RENTLY
- 2023-08-26 Rental Removed $1,365 RENT.
- 2023-08-19 Price Changed $1,365 RENTLY
- 2023-08-18 Price Changed $1,365 RENT.
- 2023-08-12 Price Changed $1,665 RENTLY
- 2023-08-11 Price Changed $1,665 RENT.
- 2023-08-09 Price Changed $1,675 RENTLY
- 2023-08-08 Price Changed $1,675 RENT.
- 2023-07-31 Listed for Rent $1,615 RENT.
- 2023-07-31 Listed for Rent $1,615 RENTLY
- 2010-03-05 Sold (MLS) — Heartland MLS as Distributed by MLS Grid
- 2009-10-20 Listed $59,900 Heartland MLS as Distributed by MLS Grid
- 2005-05-03 Sold (Public Records) — Public Records
- 2005-04-29 Sold (MLS) — Heartland MLS as Distributed by MLS Grid
- 2005-02-18 Listed $99,950 Heartland MLS as Distributed by MLS Grid
- 1995-03-27 Sold (Public Records) — Public Records
Property tax history
+4.2%/yrLatest (2025): $2,325 · -9.2% YoY. Source: county tax records.
Cash-flow waterfall
monthlySold comps — $/sqft
last 12 mo · ≤1 miLoading sold comps…