12721 W Greenway Rd #233 · El Mirage, AZ
Flood risk 1/10 · Minimal
- FEMA flood zone
- X (shaded)
- Chance of flooding over 30 yrs
- 0.0%
- Est. flood insurance / yr
- $507 – $1,088
Fire risk 4/10 · Minor
- Est. fire insurance / yr
- $610 – $1,132
Heat risk 9/10 · Severe
- Hot days now (above 114°F)
- 7 days/yr
- Hot days in 30 yrs
- 18 days/yr
Wind risk 1/10 · Minimal
- Chance of severe wind over 30 yrs
- —
Air-quality risk 2/10 · Minimal
- Unhealthy air days now
- 1 days/yr
- Unhealthy air days in 30 yrs
- 1 days/yr
Risk factors via First Street. Map © Google.
Why this score? — see what drove the C+ grade
The composite is a weighted blend of 9 inputs, each scored 0–100. Each bar is that input's sub-score; the figure is the points it added to the 100-point composite (weight × sub-score).
- Cash flow +30.0/30.0
- 1% rule +10.0/10.0
- DSCR +10.0/10.0
- Condition / age +4.0/5.0
- Schools +3.3/10.0
- Livability +3.2/5.0
- Rent growth +2.5/5.0
- ARV discount +0.0/15.0
- Appreciation +0.0/10.0
$130,000
🖨 Deal sheet 📄 Offer letter ✓ Due diligence
Listing remarks MLS
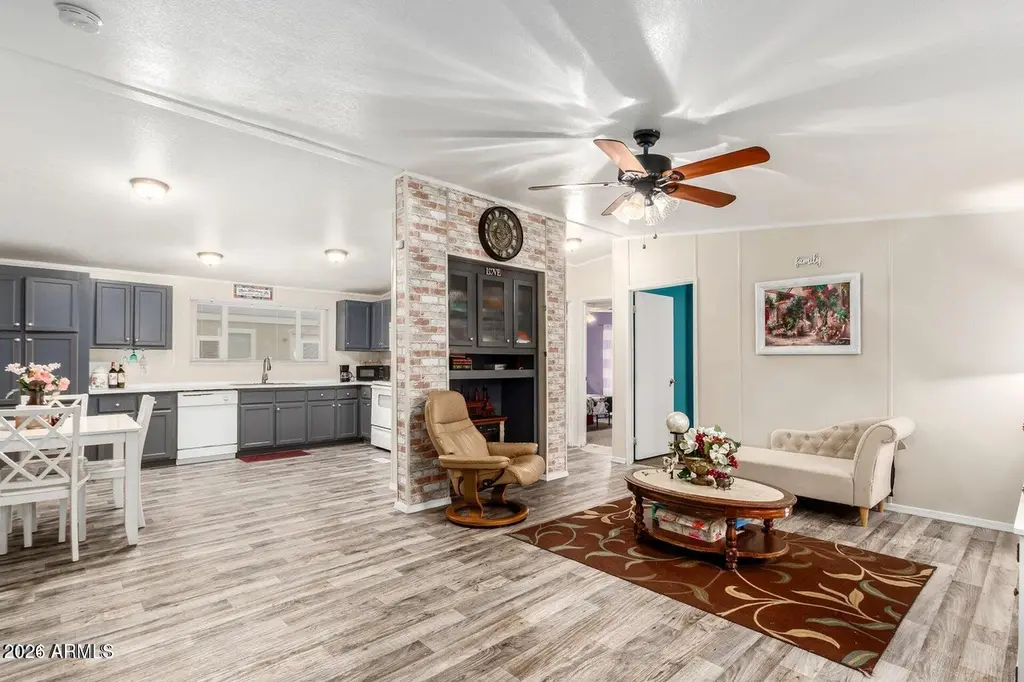
Discover this remodeled 3BR, 2BA mobile home in Rosewood Estates. This split floor plan offers modern living with upgraded finishes throughout. The kitchen is a chef's dream, while the open living area is perfect for relaxation and entertaining. Enjoy a private master suite and two additional bedrooms for versatility. Outside, a spacious patio and well-maintained landscaping provide outdoor bliss. Conveniently located, this home offers easy access to local amenities. Embrace affordable, stylish living & come check it out.
Key facts
- Private master suite
- Split floor plan
- Upgraded finishes
Tags
Neighborhood map
What this means for you Summary
Snapshot
- This is a 3-bed/2.0-bath manufactured listed at $130k. Condition is rated good.
Deal economics
- At list price, monthly cash flow is $638 ($8k/yr) — positive.
- The deal already cash-flows at list — no discount required.
- Meets the 1% rule at list price ($2k rent vs $130k).
- Recommended offer: $114k (12.0% below list) — sets the bar for market timing.
- Cap rate 12.2% vs local median 4.5% in El Mirage — top-decile yield for the area; either an underpriced asset or a hidden risk that comps aren't pricing in. Stress-test before assuming the spread holds.
Location & tenants
- Location reads 63/100 on livability (#112 in AZ) — a middle-class / working-renter tenant base. Strengths: housing A+, cost of living A; Watch: schools D-, amenities F, commute F.
- Dysart Unified District (4243) (suburban): math 34% / reading 40% proficiency, ranked #73 of 249 in AZ (top 29%) — families likely to look elsewhere, expect single-tenant / working-renter base with shorter leases.
- Market conditions: Rents flat; 132 active listings in the ZIP; 40 comparable units currently listed for rent nearby; rentals at typical pace (median 20d on market — plan ~3-4 weeks tenant-placement turnaround); solid renter incomes; 36,011 units permitted in Maricopa County in 2024 (12,801 in 5+ unit buildings).
Forward outlook
- Local home prices are declining (-3.0%/yr); year-one equity from $899 of loan paydown is wiped out by about $4k of value loss. Plan a longer hold.
- Maricopa County population projected at +38% by 2050 — long-run rental-demand tailwind backs the buy-and-hold thesis.
- At projected returns (-3.0% appreciation + 0.1% rent growth), your $36k cash investment doubles in ~8 years — after that, you're playing with house money.
Negotiation context
- It's been on market 139 days — a 12% lower offer ($114k) is reasonable based on typical stale-listing flexibility.
- 10 sale attempts since 4y ago with the ask held roughly flat each time — persistent listings suggest the price (not the market) is what's stuck; bring a comps-based counter.
- Current owner paid $85k; list at $130k implies a 53% gain — meaningful room to come down on a strong offer.
Risks & watch-outs
- Climate carrying-cost: extreme-heat days projected 7→18/yr by 2055 (HVAC capex compounding) — expect insurance premiums to compound above CPI over the hold.
Questions for the listing agent
- It's been on market 139 days. Have you received any prior offers? Is the seller open to a 12% concession, seller financing, or rate buy-down credit?
- Why hasn't it sold? Are there any deal-killer items the seller is aware of (foundation, flood, title, zoning, code violations)?
- Is there a deadline driving the sale (1031 exchange, divorce, estate, relocation)? That informs how much negotiation room exists.
- Schools are D-rated, which usually means shorter tenancies and higher turnover. Who's the typical renter profile here, and what's been the actual vacancy rate?
- What's the average days-on-market for RENTAL listings here right now (not sales)? A rising rental-DOM trend means longer vacancies and softer asking-rent achievability than the comps imply.
- What's the recent tenant-quality profile in this submarket — average credit score on applications, eviction rate, late-payment / NSF rate, and stable-employment percentage? A property-management company in the area should have these aggregated.
- How much new for-sale + rental construction is in the pipeline within 1–3 miles? Heavy new supply typically softens prices + rents 12–24 months out; constrained supply supports both.
Investment metrics
- 1% rule
- 1.50% ✓
- Cap rate
- 12.19%
- Cash-on-cash
- 21.04%
- DSCR
- 1.94
- GRM
- 5.6
CMA / ARV
- ARV (median comp)
- $98,067
- List price
- $130,000
- Delta
- 32.56%
- Verdict
- OVERPRICED
- Comps
- 16 within 1.0 mi
Show comp detail 10 sales within ~0.75 mi
| Address | Dist | Beds/Ba | Sqft | Sold | Price | $/sf | Match |
|---|---|---|---|---|---|---|---|
| 12721 W Greenway Rd #116 | 0.05mi | 3/2.0 | 1,420 (+1%) | 15mo | $100,000 | $70 | 82 |
| 12721 W Greenway Rd #159 | 0.05mi | 3/2.0 | 1,536 (+10%) | 0mo | $44,000 | $29 | 81 |
| 12721 W Greenway Rd #39 | 0.05mi | 3/2.0 | 1,536 (+10%) | 1mo | $102,000 | $66 | 80 |
| 12721 W Greenway Rd #108 | 0.05mi | 3/2.0 | 1,344 (-4%) | 14mo | $59,000 | $44 | 79 |
| 12721 W Greenway Rd #25 | 0.12mi | 4/2.0 (+1) | 1,542 (+10%) | 1mo | $73,500 | $48 | 72 |
| 12721 W Greenway Rd #80 | 0.00mi | 3/2.0 | 1,216 (-13%) | 8mo | $83,990 | $69 | 72 |
| 12721 W Greenway Rd #224 | 0.05mi | 3/2.0 | 1,548 (+11%) | 13mo | $107,000 | $69 | 69 |
| 12721 W Greenway Rd #6 | 0.05mi | 3/2.0 | 1,216 (-13%) | 13mo | $72,000 | $59 | 65 |
| 15632 N Greasewood St | 0.40mi | 3/2.0 | 1,352 (-3%) | 20mo | $315,000 | $233 | 58 |
| 16101 N EL Mirage Rd #426 | 0.72mi | 3/2.0 | 1,568 (+12%) | 7mo | $115,000 | $73 | 41 |
Match score weights: distance 35% · size 25% · config 20% · recency 20%. Top-matched comps best support the ARV.
Projected returns pro-forma
-3.0% appreciation · 0.08% rent growth · sell at horizon
- IRR
- 10.1%
- Equity multiple
- 1.39×
- Total profit
- $14,066
- Equity at exit
- $19,383
- IRR
- 16.7%
- Equity multiple
- 2.19×
- Total profit
- $43,224
- Equity at exit
- $11,240
Cash invested: $36,400 (down + closing). Projections, not guarantees.
Landlord ↔ Tenant lean methodology
- Overall (STATE)
- 87 Strongly Landlord-Friendly
- State Arizona
- 87 Strongly Landlord-Friendly · R+3
- County
- — inherits STATE
- City
- — inherits STATE
ZIP-level market 85335
- Home prices YoY
- -13.3%
- Rents YoY
- 0.1%
- Active inventory
- 132
- Price-to-rent
- 5.6×
Monthly cashflow live
- Estimated rent
- $1,945 high interval (Pro) →
- Mortgage (P&I)
- −$682
- Tax est. 1.5%
- −$162 /mo · $1,950/yr
- Insurance
- −$54
- HOA
- −$0
- Vacancy / Maint / Mgmt
- −$408
- Net cashflow
- $638
Break-even live
UW: 25.0% down · 7.5% · 30yr · 1.5% tax · 5.0% vac · 8.0% maint · 8.0% mgmt
Financing live
Cash to close
- Down payment
- $32,500
- Closing costs
- $3,900
- Reserves months
- —
- Total cash needed
- —
Loan-product check · same deal, 3 products live
Conventional
25% down · 7.5% · 30yr
- Down + closing
- —
- Monthly P&I
- —
- Monthly cashflow
- —
- DSCR
- —
- Eligible?
- —
Personal DTI + credit; lowest rate.
DSCR
20% down · 8.5% · 30yr
- Down + closing
- —
- Monthly P&I
- —
- Monthly cashflow
- —
- DSCR
- —
- Eligible?
- —
No personal income docs; deal must DSCR.
Hard money
10% down · 12.0% · 12mo
- Down + closing
- —
- Monthly P&I
- —
- Monthly cashflow
- —
- DSCR
- —
- Eligible?
- —
Short-term bridge; refi at stabilization.
Rent comps 40 comps
| Address | Beds | Baths | Sqft | Rent | $/sqft | DOM | Units | Dist |
|---|---|---|---|---|---|---|---|---|
| 12945 W Greenway Rd El Mirage, AZ | 2.0 | 2.0 | 1060 | $1,300 | $1.23 | 23d | 4 | 0.21mi |
| 12574 W Lisbon Ln El Mirage, AZ | 3.0 | 2.0 | 1058 | $1,700 | $1.61 | 4d | 1 | 0.32mi |
| 12532 W Saint Moritz Ln El Mirage, AZ | 4.0 | 2.0 | 1534 | $1,875 | $1.22 | 5d | 1 | 0.34mi |
| 15426 N Cactus Ln Surprise, AZ | 3.0 | 1.0 | 1376 | $1,634 | $1.19 | 43d | 1 | 0.37mi |
| 14715 N 124th Ave El Mirage, AZ | 4.0 | 2.0 | 1534 | $2,010 | $1.31 | 43d | 1 | 0.43mi |
| 12438 W Hearn Rd El Mirage, AZ | 3.0 | 2.0 | 1308 | $1,595 | $1.22 | 23d | 1 | 0.48mi |
| 15427 N Jerry St Surprise, AZ | 2.0 | 1.5 | 920 | $1,450 | $1.58 | 5d | 1 | 0.49mi |
| 13227 W Port au Prince Ln Surprise, AZ | 3.0 | 2.0 | 1522 | $1,709 | $1.12 | 14d | 1 | 0.54mi |
| 13227 W Port au Prince Ln Surprise, AZ | 3.0 | 2.0 | 1522 | $1,759 | $1.16 | 23d | 1 | 0.54mi |
| 12537 W Redfield Rd El Mirage, AZ | 3.0 | 2.0 | 1600 | $1,795 | $1.12 | 24d | 1 | 0.55mi |
| 15620 N El Mirage Rd Surprise, AZ | 3.0 | 2.5 | 1310 | $1,599 | $1.22 | 24d | 2 | 0.57mi |
| 12437 W Via Camille El Mirage, AZ | 3.0 | 2.0 | 1534 | $1,875 | $1.22 | 16d | 1 | 0.59mi |
| 13217 W Mauna Loa Ln Surprise, AZ | 3.0 | 2.0 | 1672 | $1,900 | $1.14 | 1d | 1 | 0.64mi |
| 12817 W Cottonwood St Surprise, AZ | 2.0 | 1.0 | 1795 | $1,300 | $0.72 | 3d | 1 | 0.65mi |
| 14417 N Gil Balcome Surprise, AZ | 3.0 | 2.0 | 1446 | $1,900 | $1.31 | 4d | 1 | 0.71mi |
| 14944 N 133rd Dr Surprise, AZ | 3.0 | 2.0 | 1518 | $2,171 | $1.43 | 21d | 1 | 0.71mi |
| 13002 W Hearn Rd El Mirage, AZ | 3.0 | 2.0 | 1518 | $1,795 | $1.18 | 10d | 1 | 0.72mi |
| 13186 W Gelding Cir Surprise, AZ | 3.0 | 2.5 | 1691 | $1,899 | $1.12 | 2d | 1 | 0.76mi |
| 16520 N Greasewood St Surprise, AZ | 2.0–3.0 | 2.5 | 1267 | $1,850 | $1.46 | 1d | 17 | 0.76mi |
| 13314 W Mauna Loa Ln Surprise, AZ | 3.0 | 2.0 | 1252 | $2,355 | $1.88 | 43d | 1 | 0.78mi |
| 12134 W Ironwood St El Mirage, AZ | 3.0 | 2.0 | 1680 | $1,950 | $1.16 | 24d | 1 | 0.79mi |
| 12121 W Ironwood St El Mirage, AZ | 3.0 | 2.0 | 1680 | $1,999 | $1.19 | 24d | 1 | 0.81mi |
| 16629 N Greasewood St Surprise, AZ | 2.0 | 1.5 | 1052 | $1,462 | $1.39 | 1d | 3 | 0.92mi |
| 13148 W Redfield Rd Surprise, AZ | 3.0 | 2.0 | 1372 | $1,970 | $1.44 | 3d | 1 | 0.93mi |
| 14973 N 135th Dr Unit 1546409P Surprise, AZ | 3.0 | 2.0 | 1797 | $3,122 | $1.74 | 12d | 1 | 0.94mi |
| 15109 N Verbena St El Mirage, AZ | 4.0 | 2.0 | 1642 | $1,869 | $1.14 | 43d | 1 | 0.95mi |
| 12731 W Sharon Dr El Mirage, AZ | 3.0 | 2.0 | 1300 | $1,650 | $1.27 | 16d | 1 | 1.02mi |
| 13342 W Canyon Creek Dr Surprise, AZ | 3.0 | 2.0 | 1419 | $1,750 | $1.23 | 24d | 1 | 1.05mi |
| 13939 N 132nd Ln Surprise, AZ | 3.0 | 2.5 | 1297 | $3,500 | $2.70 | 43d | 1 | 1.06mi |
| 13949 N 133rd Dr Surprise, AZ | 3.0 | 2.0 | 1518 | $1,995 | $1.31 | 43d | 1 | 1.08mi |
| 12530 W Willow Ave El Mirage, AZ | 4.0 | 2.0 | 1615 | $1,830 | $1.13 | 5d | 1 | 1.10mi |
| 12530 W Willow Ave El Mirage, AZ | 4.0 | 2.0 | 1615 | $2,075 | $1.28 | 24d | 1 | 1.10mi |
| 12430 W Willow Ave El Mirage, AZ | 3.0 | 2.0 | 1183 | $5,900 | $4.99 | 4d | 1 | 1.11mi |
| 14809 N El Frio Cir El Mirage, AZ | 4.0 | 2.0 | 1459 | $2,199 | $1.51 | 21d | 1 | 1.12mi |
| 14809 N El Frio Cir El Mirage, AZ | 4.0 | 2.0 | 1700 | $2,300 | $1.35 | 24d | 1 | 1.12mi |
| 12706 W Ash St El Mirage, AZ | 3.0 | 2.0 | 1559 | $1,695 | $1.09 | 5d | 1 | 1.14mi |
| 13338 W Boca Raton Rd Surprise, AZ | 3.0 | 2.0 | 1412 | $2,096 | $1.48 | 24d | 1 | 1.14mi |
| 12710 W Ash St El Mirage, AZ | 3.0 | 2.0 | 1545 | $2,195 | $1.42 | 18d | 1 | 1.14mi |
| 12710 W Ash St El Mirage, AZ | 3.0 | 2.0 | 1545 | $2,195 | $1.42 | 19d | 1 | 1.14mi |
| 12710 W Ash St El Mirage, AZ | 3.0 | 2.0 | 1559 | $2,095 | $1.34 | 2d | 1 | 1.14mi |
Listing history 37 events
-
2026-06-18days on market $130,000 Active 139 DOM
-
2026-06-17days on market $130,000 Active 138 DOM
-
2026-06-16days on market $130,000 Active 137 DOM
-
2026-06-15days on market $130,000 Active 136 DOM
-
2026-06-13days on market $130,000 Active 134 DOM
-
2026-06-09days on market $130,000 Active 130 DOM
-
2026-06-08days on market $130,000 Active 129 DOM
-
2026-06-07days on market $130,000 Active 128 DOM
-
2026-06-04days on market $130,000 Active 125 DOM
-
2026-06-03days on market $130,000 Active 124 DOM
-
2026-06-02days on market $130,000 Active 123 DOM
-
2026-06-01days on market $130,000 Active 122 DOM
-
2026-05-31days on market $130,000 Active 121 DOM
-
2026-01-30$130,000 Active 531-char remark
Show marketing remark (531 chars)
Discover this remodeled 3BR, 2BA mobile home in Rosewood Estates. This split floor plan offers modern living with upgraded finishes throughout. The kitchen is a chef's dream, while the open living area is perfect for relaxation and entertaining. Enjoy a private master suite and two additional bedrooms for versatility. Outside, a spacious patio and well-maintained landscaping provide outdoor bliss. Conveniently located, this home offers easy access to local amenities. Embrace affordable, stylish living & come check it out.
-
2026-01-01historical
-
2025-08-01$135,000 Active
-
2025-07-28historical
-
2025-06-02status Active
-
2025-06-02historical
-
2025-02-03$145,000 Active
-
2025-01-01historical
-
2024-10-02status Active
-
2024-10-02price $145,000
-
2024-10-01historical
-
2024-09-06price $149,900
-
2024-09-04status Active
-
2024-09-01historical
-
2024-08-08price $155,000
-
2024-08-01status Active
-
2024-08-01historical
-
2024-07-02status Active
-
2024-07-02historical
-
2024-05-22price $159,900
-
2024-01-29$165,000 Active
-
2022-07-06soldstatus $85,000 Closed
-
2022-06-18historical Under Contract Accepting Backups
-
2022-06-13$85,000 Active
ⓘ Source: listings_history table (triggers on properties + properties_extension) + one-shot
backfill from property_details.listing_events for pre-trigger history.
Climate risk First Street
- Flood 1/10 Low FEMA zone X (shaded) · 0% chance over 30 yrs
- Wildfire 4/10 Moderate
- Heat 9/10 Extreme 7 d/yr ≥114°F today · 18 d/yr by 30 yrs out
- Wind 1/10 Low
- Air quality 2/10 Low 1 unhealthy d/yr today · 1 by 30 yrs out
Nearby sold comps map
Loading sold comps map…
Walkable amenities ~0.75 mi
Loading nearby amenities…
Taxation est. · year 1
- Rental income
- $23,343
- − Mortgage interest
- −$7,282
- − Property taxes
- −$1,950
- − Insurance
- −$650
- − Repairs & maintenance
- −$1,867
- − Management
- −$1,867
- − Depreciation
- −$3,782
- Taxable income
- $5,944
- Est. tax owed @ 24.0%
- −$1,427
- After-tax cash flow
- $6,233/yr
For passive investors: Depreciation is non-cash, so a rental often shows a tax loss while cash-flowing — sheltering income. Rental losses are passive: they offset passive income freely, and up to $25,000/yr can offset ordinary (W-2) income if you actively participate and your MAGI is under $100k (phasing out to $0 by $150k); unused losses carry forward. On sale, claimed depreciation is recaptured at up to 25%, and gains may owe capital-gains tax (a 1031 exchange can defer both). Figures are a year-1 estimate at your 24.0% rate — not tax advice; consult a CPA.
Condition & rehab AI · 12 photos
This remodeled 3BR, 2BA mobile home in Rosewood Estates offers modern finishes and a split floor plan. It is in good condition with minimal repairs needed, making it an attractive investment for both resale and rental.
Value-add opportunities
- Both Painting exterior and interior walls — Fresh paint can enhance curb appeal and interior aesthetics
- Both Updating flooring in bathrooms — Modern flooring can improve both resale and rental value
- Both Upgrading kitchen appliances — Modern appliances can attract more buyers and renters
- Both Landscaping improvements — Enhanced landscaping can increase curb appeal and property value
Renovation cost estimate screening
Value-add ROI direction
- Both Painting exterior and interior walls — Fresh paint can enhance curb appeal and interior aesthetics ↑
- Both Updating flooring in bathrooms — Modern flooring can improve both resale and rental value ↑
- Both Upgrading kitchen appliances — Modern appliances can attract more buyers and renters ↑
- Both Landscaping improvements — Enhanced landscaping can increase curb appeal and property value ↑
ⓘ Cost ranges are severity-bucket heuristics (US national rule-of-thumb). Get contractor quotes + a written scope before underwriting a rehab budget.
Schools (NCES district)
- District
- Dysart Unified District (4243)
- NCES district ID
- 0402690
- Math proficiency
- 34% ▼ -10.00%
- Reading proficiency
- 40% ▼ -5.00%
- Median HH income
- $58,033
- Composite
- 32.76/100
- National rank
- #5634
- State rank
- #73 of 249 in AZ
Livability — El Mirage
- Score
- 63/100
- State rank
- #112
- US rank
- #15164
Category grades
Schools grade is shown separately in the Schools card above.
Census & demographics
- Census place
- El Mirage, AZ
- County
- Maricopa County · 4,537,380 people
- City population
- 36,088
- Metro
- Phoenix-Mesa-Chandler, AZ
- Population (ZIP)
- 36,088
- Household income
- $78,050
- Rent vs Own
- Severe rent burden
- 669.0
Population outlook (Maricopa County) Hauer SSP2
- Today (2025)
- 4,979,203 people
- By 2030
- 5,378,229 · +8.0%
- By 2040
- 6,156,598 · +23.6%
- By 2050
- 6,872,376 · +38.0%
- By 2075
- 8,401,270 · +68.7%
- By 2100
- 9,247,439 · +85.7%
Race, ethnicity, and origin ACS 2023
- Neighborhood character
- Diverse neighborhood (Simpson 0.62)
- Race & ethnicity
- Hispanic / Latino 50% White 35% Two or more races 28% Black 6% Native American 1% Pacific Islander 1%
- Hispanic origin (detail)
- Mexican 37%
- Common ancestry
- Lithuanian 2% Romanian 1% Iranian 1%
- Foreign-born
- 15% · Canada
- Languages at home
- 66% English-only · Spanish 30% Other Indo-European 1% Other Asian/Pacific 1%
Political lean MEDSL · Maricopa
- 2024 margin
- Toss-up / Even · D 47.7% · R 51.2% · Other 1.1%
- 2008→2024 swing
- +7.1pp toward D · 2008: -10.6pp · 2024: -3.5pp
- All cycles
- 2024: R+3.5 2020: D+2.2 2016: R+3.5 2012: R+12.0 2008: R+10.6
Not yet ingested
- Civics
- —
Market trends
- HPI YoY
- ▼ -52.81%
- Current HPI
- 342.6503
- Rent YoY
- ▲ 0.08%
- Metro
- Phoenix-Mesa-Chandler, AZ
- State GDP YoY
- ▲ 4.54%
- F500 in state
- 20
Industry mix (Fortune 500 HQ in AZ)
| Industry | F500 HQs | Revenue |
|---|---|---|
| Technology | 2 | $13B |
|
||
| Mining / Metals | 1 | $23B |
|
||
| Environmental Services | 1 | $16B |
|
||
| Metals / Steel | 1 | $14B |
|
||
| Technology Distribution | 1 | $9B |
|
||
| Homebuilding | 1 | $8B |
|
||
Price history
+52.9% since first listed24 events — show timeline
- 2026-01-30 Listed $130,000 ARMLS
- 2026-01-01 Listing Removed — ARMLS
- 2025-08-01 Listed $135,000 ARMLS
- 2025-07-28 Listing Removed — ARMLS
- 2025-06-02 Relisted — ARMLS
- 2025-06-02 Listing Removed — ARMLS
- 2025-02-03 Listed $145,000 ARMLS
- 2025-01-01 Listing Removed — ARMLS
- 2024-10-02 Relisted — ARMLS
- 2024-10-02 Price Changed $145,000 ARMLS
- 2024-10-01 Listing Removed — ARMLS
- 2024-09-06 Price Changed $149,900 ARMLS
- 2024-09-04 Relisted — ARMLS
- 2024-09-01 Listing Removed — ARMLS
- 2024-08-08 Price Changed $155,000 ARMLS
- 2024-08-01 Relisted — ARMLS
- 2024-08-01 Listing Removed — ARMLS
- 2024-07-02 Relisted — ARMLS
- 2024-07-02 Listing Removed — ARMLS
- 2024-05-22 Price Changed $159,900 ARMLS
- 2024-01-29 Listed $165,000 ARMLS
- 2022-07-06 Sold (MLS) $85,000 ARMLS
- 2022-06-18 Contingent — ARMLS
- 2022-06-13 Listed $85,000 ARMLS
Cash-flow waterfall
monthlySold comps — $/sqft
last 12 mo · ≤1 miLoading sold comps…