 Duplex
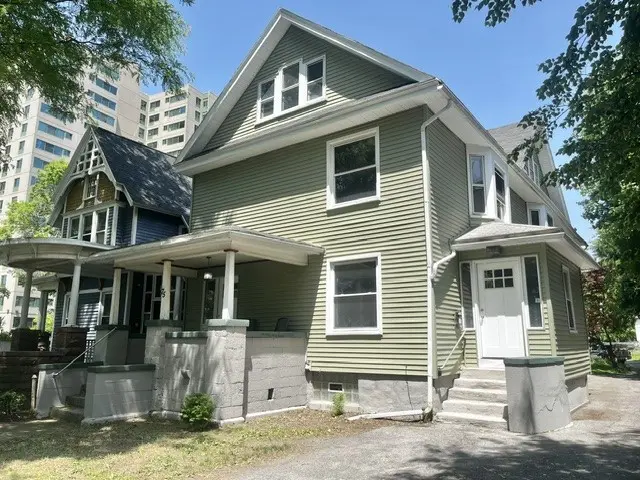
75 Alexander St · Rochester, NY
Flood risk 1/10 · Minimal
- FEMA flood zone
- X (unshaded)
- Chance of flooding over 30 yrs
- 0.0%
- Est. flood insurance / yr
- $473 – $860
Fire risk 1/10 · Minimal
- Est. fire insurance / yr
- $691 – $1,283
Heat risk 2/10 · Minimal
- Hot days now (above 96°F)
- 7 days/yr
- Hot days in 30 yrs
- 15 days/yr
Wind risk 1/10 · Minimal
- Chance of severe wind over 30 yrs
- —
Air-quality risk 2/10 · Minimal
- Unhealthy air days now
- 1 days/yr
- Unhealthy air days in 30 yrs
- 1 days/yr
Risk factors via First Street. Map © Google.
Why this score? — see what drove the C grade
The composite is a weighted blend of 9 inputs, each scored 0–100. Each bar is that input's sub-score; the figure is the points it added to the 100-point composite (weight × sub-score).
- Cash flow +24.7/30.0
- DSCR +8.0/10.0
- ARV discount +7.3/15.0
- 1% rule +6.4/10.0
- Livability +3.8/5.0
- Rent growth +2.8/5.0
- Condition / age +2.2/5.0
- Schools +1.9/10.0
- Appreciation +0.0/10.0
$349,900
🖨 Deal sheet (PDF) 📄 Offer letter ✓ Due diligence
Multi-family units
County records classify this as Multi-Family (2-4 Unit). Listing-text estimate: 2 units. confirmed
Listing remarks MLS
Currently zoned commercial and used as a boarding house along with 73 Alexander St (427976) Can be sold together or seperately. Front 2 rooms are used as office but could be opened to become part of 1st floor apartment. Taxes based on commercial and would be much lower as 2-family. Owner tax exempt. New roof 2002.
Key facts
- New exterior doors
- Zero vacancy
- New water heaters
Tags
Property features AI
Finance
- Other: Owner pays grounds care, trash collection, and water; Rent includes gardener, trash collection, and water
- Financial info: Gross income: $46,200 (multi-unit); Operating expenses: $11,910 (includes insurance, maintenance structure, maintenance, supplies, trash, water/sewer)
Exterior
- Parking: Two or more parking spaces
- Utilities: Public water connected; Sewer connected
- Home design: 2-story property; Resale condition
- Construction: Vinyl siding; Asphalt roof; Block foundation; Existing (year built: existing)
- Exterior features: Covered porch; City street frontage; Near public transit; Rectangular residential lot
Interior
- Flooring: Carpet; Hardwood; Vinyl; Varied flooring
- Bathrooms: 4 full bathrooms; 1 half bathroom
- Heating & cooling: Gas heating; Forced air; Radiator heating
- Interior features: Full basement; 2 fireplaces
- Laundry & utility: Gas water heater
Neighborhood map
What this means for you Summary
Snapshot
- This is a 2 × 4-bed/2-bath units multifamily listed at $350k. Condition is rated fair.
Deal economics
- At list price, monthly cash flow is $727 ($9k/yr) — positive. Per door: $363/mo.
- The deal already cash-flows at list — no discount required.
- Meets the 1% rule at list price ($4k rent vs $350k).
Location & tenants
- Location reads 76/100 on livability (#222 in NY, #3,482 nationally) — a middle-class / working-renter tenant base. Strengths: commute A+, cost of living A+, housing A+; Watch: schools D+, crime F, employment F.
- Rochester City School District (urban): math 21% / reading 26% proficiency, ranked #589 of 590 in NY (top 100%) — low school quality limits family demand, transient renter base, plan for 1-2y turnover; 82% free/reduced lunch — lower-income household profile, screen leases tightly.
- Market conditions: Rents rising (+1.2%/yr); 74 active listings in the ZIP; 1,169 units permitted in Monroe County in 2024 (591 in 5+ unit buildings).
- At $3,981/mo this rent would consume 77% of the median local household income ($62k/yr) (locally 2013% of renters already pay >50% of income on rent) — very limited rent-growth headroom before tenants either downsize or default.
Forward outlook
- Local home prices are declining (-3.0%/yr); year-one equity from $2k of loan paydown is wiped out by about $10k of value loss. Plan a longer hold.
- Monroe County population projected to shrink 6% by 2050 — rents likely to lag national; underwrite the cash flow, not the appreciation.
Negotiation context
- Only 3 days on market — expect competitive offers; lowballing is unlikely to land.
- 2 sale attempts since 22y ago with the ask held roughly flat each time — persistent listings suggest the price (not the market) is what's stuck; bring a comps-based counter.
- Current owner paid $89k; list at $350k implies a 293% gain — meaningful room to come down on a strong offer.
Risks & watch-outs
- Watch-outs: built in 1920 — expect roof / HVAC / electrical / plumbing capex.
Questions for the listing agent
- Can we see the unit-by-unit rent roll, current vacancy, and any below-market leases? What's the average tenancy length?
- What capital expenditures (roof, boiler, parking lot, exteriors) have been made in the last 5 years, and what's planned in the next 2?
- Have any recent inspections been done? Can we get a copy of the seller's disclosures and any deferred-maintenance estimates?
- Built in 1920 — when were the roof, HVAC, electrical panel, plumbing, and water heater last replaced?
- Is there a deadline driving the sale (1031 exchange, divorce, estate, relocation)? That informs how much negotiation room exists.
- Schools are D-rated, which usually means shorter tenancies and higher turnover. Who's the typical renter profile here, and what's been the actual vacancy rate?
- Crime grade is F in this area — have there been break-ins, vandalism, or insurance claims at this property in the last 3 years? What carrier currently insures it and at what premium?
- What's the average days-on-market for RENTAL listings here right now (not sales)? A rising rental-DOM trend means longer vacancies and softer asking-rent achievability than the comps imply.
- What's the recent tenant-quality profile in this submarket — average credit score on applications, eviction rate, late-payment / NSF rate, and stable-employment percentage? A property-management company in the area should have these aggregated.
- How much new apartment / multifamily construction is in the pipeline within 1–3 miles? Heavy new supply (>2% of stock underway) typically softens rents 12–24 months out; light construction supports rent growth.
Investment metrics
- 1% rule
- 1.14% ✓
- Cap rate
- 8.79%
- Cash-on-cash
- 8.90%
- DSCR
- 1.40
- GRM
- 7.3
CMA / ARV
- ARV (on-the-fly)
- $348,000
- Comps found
- 3
Show comp detail 3 sales within ~0.75 mi
| Address | Dist | Beds/Ba | Sqft | Sold | Price | $/sf | Match |
|---|---|---|---|---|---|---|---|
| 49 Woodlawn St | 0.48mi | 7/2.0 (-1) | 2,846 (+2%) | 5mo | $348,000 | $122 | 56 |
| 23 Benton St | 0.56mi | 7/3.0 (-1) | 2,831 (+2%) | 8mo | $355,000 | $125 | 54 |
| 93 Park Ave | 0.64mi | 8/4.0 | 3,024 (+9%) | 3mo | $630,000 | $208 | 52 |
Match score weights: distance 35% · size 25% · config 20% · recency 20%. Top-matched comps best support the ARV.
Projected returns pro-forma
-3.0% appreciation · 1.2% rent growth · sell at horizon
- IRR
- -4.9%
- Equity multiple
- 0.82×
- Total profit
- $-17,425
- Equity at exit
- $52,171
- IRR
- 2.6%
- Equity multiple
- 1.17×
- Total profit
- $16,653
- Equity at exit
- $30,253
Cash invested: $97,972 (down + closing). Projections, not guarantees.
Landlord ↔ Tenant lean methodology
- Overall (STATE)
- 15 Strongly Tenant-Friendly
- State New York
- 15 Strongly Tenant-Friendly · D+10
- County
- — inherits STATE
- City
- — inherits STATE
ZIP-level market 14620
- Home prices YoY
- -20.1%
- Rents YoY
- 1.2%
- Active inventory
- 74
- Price-to-rent
- 14.6×
Monthly cashflow live
- Estimated rent
- $3,981 high interval (Pro) →
- Mortgage (P&I)
- −$1,835
- Tax est. 1.5%
- −$437 /mo · $5,248/yr
- Insurance
- −$146
- HOA
- −$0
- Vacancy / Maint / Mgmt
- −$836
- Net cashflow
- $727
Break-even live
Sensitivity live
| Price | -10% $969 | -5% $848 | +0% $727 | +5% $606 | +10% $485 |
|---|---|---|---|---|---|
| Rent | -10% $412 | -5% $570 | +0% $727 | +5% $884 | +10% $1,041 |
| Rate | -1.0pp $903 | -0.5pp $816 | base $727 | +0.5pp $636 | +1.0pp $544 |
2-unit breakdown (identical units grouped — click to expand)
| Units | Beds | Baths | Est. rent |
|---|---|---|---|
| 2× units | 4 | 2 | $3,982 |
| #1 | 4 | 2 | $1,991 |
| #2 | 4 | 2 | $1,991 |
| Total (2 units) | $3,981 | ||
UW: 25.0% down · 7.5% · 30yr · 1.5% tax · 5.0% vac · 8.0% maint · 8.0% mgmt
Financing live
Cash to close
- Down payment
- $87,475
- Closing costs
- $10,497
- Reserves months
- —
- Total cash needed
- —
Loan-product check · same deal, 3 products live
Conventional
25% down · 7.5% · 30yr
- Down + closing
- —
- Monthly P&I
- —
- Monthly cashflow
- —
- DSCR
- —
- Eligible?
- —
Personal DTI + credit; lowest rate.
DSCR
20% down · 8.5% · 30yr
- Down + closing
- —
- Monthly P&I
- —
- Monthly cashflow
- —
- DSCR
- —
- Eligible?
- —
No personal income docs; deal must DSCR.
Hard money
10% down · 12.0% · 12mo
- Down + closing
- —
- Monthly P&I
- —
- Monthly cashflow
- —
- DSCR
- —
- Eligible?
- —
Short-term bridge; refi at stabilization.
Listing history 4 events
-
2026-06-08status $349,900 Pending 3 DOM
-
2026-06-07days on market $349,900 Active 3 DOM
-
2026-06-05remarks 699-char remark
-
2026-06-05$349,900 Active 1 DOM
ⓘ Source: listings_history table (triggers on properties + properties_extension) + one-shot
backfill from property_details.listing_events for pre-trigger history.
Climate risk First Street
- Flood 1/10 Low FEMA zone X (unshaded) · 0% chance over 30 yrs
- Wildfire 1/10 Low
- Heat 2/10 Low 7 d/yr ≥96°F today · 15 d/yr by 30 yrs out
- Wind 1/10 Low
- Air quality 2/10 Low 1 unhealthy d/yr today · 1 by 30 yrs out
Nearby sold comps map
Loading sold comps map…
Walkable amenities ~0.75 mi
Loading nearby amenities…
Taxation est. · year 1
- Rental income
- $47,772
- − Mortgage interest
- −$19,600
- − Property taxes
- −$5,248
- − Insurance
- −$1,750
- − Repairs & maintenance
- −$3,822
- − Management
- −$3,822
- − Depreciation
- −$10,179
- Taxable income
- $3,352
- Est. tax owed @ 24.0%
- −$804
- After-tax cash flow
- $7,919/yr
For passive investors: Depreciation is non-cash, so a rental often shows a tax loss while cash-flowing — sheltering income. Rental losses are passive: they offset passive income freely, and up to $25,000/yr can offset ordinary (W-2) income if you actively participate and your MAGI is under $100k (phasing out to $0 by $150k); unused losses carry forward. On sale, claimed depreciation is recaptured at up to 25%, and gains may owe capital-gains tax (a 1031 exchange can defer both). Figures are a year-1 estimate at your 24.0% rate — not tax advice; consult a CPA.
Condition & rehab AI · 2 photos
This multi-family property requires extensive repairs and updates to its interior and exterior, significantly impacting its current condition and value. Immediate investments in painting, landscaping, and structural repairs are recommended to improve its resale and rental potential.
Repairs flagged
- Major kitchen — No photos of kitchen
- Major bathrooms — No photos of bathrooms
- Major roof — No photos of roof
- Major exterior — No photos of exterior
- Major flooring — No photos of flooring
- Major interior walls/paint — No photos of interior walls/paint
- Major systems — No photos of systems
Value-add opportunities
- Both paint interior walls and ceilings — Fresh paint enhances curb appeal and interior aesthetics
- Both landscaping and curb appeal — Well-maintained landscaping improves curb appeal and property value
- Both kitchen and bathroom updates — Modernizing these spaces can attract more tenants and buyers
- Both roof replacement — A new roof is essential for long-term property value
- Both exterior siding and paint — A fresh exterior enhances curb appeal and property value
Renovation cost estimate screening
| Repair item | Severity | Est. cost |
|---|---|---|
| kitchen · No photos of kitchen | Major | $15,000–50,000 |
| bathrooms · No photos of bathrooms | Major | $15,000–50,000 |
| roof · No photos of roof | Major | $15,000–50,000 |
| exterior · No photos of exterior | Major | $15,000–50,000 |
| flooring · No photos of flooring | Major | $15,000–50,000 |
| interior walls/paint · No photos of interior walls/paint | Major | $15,000–50,000 |
| systems · No photos of systems | Major | $15,000–50,000 |
| Total estimated repair cost · 7 items | $105,000–350,000 |
Value-add ROI direction
- Both paint interior walls and ceilings — Fresh paint enhances curb appeal and interior aesthetics ↑
- Both landscaping and curb appeal — Well-maintained landscaping improves curb appeal and property value ↑
- Both kitchen and bathroom updates — Modernizing these spaces can attract more tenants and buyers ↑
- Both roof replacement — A new roof is essential for long-term property value ↑
- Both exterior siding and paint — A fresh exterior enhances curb appeal and property value ↑
ⓘ Cost ranges are severity-bucket heuristics (US national rule-of-thumb). Get contractor quotes + a written scope before underwriting a rehab budget.
Schools (NCES district)
- District
- Rochester City School District
- NCES district ID
- 3624750
- Math proficiency
- 21% ▬ 0.00%
- Reading proficiency
- 26% ▲ 4.00%
- Median HH income
- $30,923
- Composite
- 18.98/100
- National rank
- #8850
- State rank
- #589 of 590 in NY
Livability — Rochester
- Score
- 76/100
- State rank
- #222
- US rank
- #3482
Category grades
Schools grade is shown separately in the Schools card above.
Census & demographics
- Census place
- Rochester, NY
- County
- Monroe County · 674,131 people
- City population
- 432,803
- Metro
- Rochester, NY
- Population (ZIP)
- 23,769
- Household income
- $61,783
- Rent vs Own
- Severe rent burden
- 2013.0
Population outlook (Monroe County) Hauer SSP2
- Today (2025)
- 759,460 people
- By 2030
- 757,154 · -0.3%
- By 2040
- 740,644 · -2.5%
- By 2050
- 714,443 · -5.9%
- By 2075
- 645,883 · -15.0%
- By 2100
- 547,084 · -28.0%
Race, ethnicity, and origin ACS 2023
- Neighborhood character
- Predominantly White (68%)
- Race & ethnicity
- White 68% Black 12% Asian 9% Hispanic / Latino 6% Two or more races 6%
- Hispanic origin (detail)
- Puerto Rican 3%
- Common ancestry
- Romanian 5% Iranian 3% Lithuanian 2%
- Foreign-born
- 13% · China, Canada, South Korea
- Languages at home
- 85% English-only · Chinese 4% Spanish 4% Other Indo-European 3%
Political lean MEDSL · Monroe
- 2024 margin
- D (+19.1) · D 59.5% · R 40.5%
- 2008→2024 swing
- +1.4pp toward D · 2008: 17.7pp · 2024: 19.1pp
- All cycles
- 2024: D+19.1 2020: D+21.0 2016: D+14.1 2012: D+17.4 2008: D+17.7
Not yet ingested
- Civics
- —
Market trends
- HPI YoY
- ▼ -84.77%
- Current HPI
- 337.6917
- Rent YoY
- ▲ 1.20%
- Metro
- Rochester, NY
- State GDP YoY
- ▲ 2.60%
- F500 in state
- 92
Industry mix (Fortune 500 HQ in NY)
| Industry | F500 HQs | Revenue |
|---|---|---|
| Financial Services | 10 | $950B |
|
||
| Consumer Goods | 9 | $162B |
|
||
| Insurance | 4 | $225B |
|
||
| Telecommunications | 2 | $144B |
|
||
| Pharmaceuticals | 2 | $112B |
|
||
| Media / Entertainment | 2 | $69B |
|
||
Price history
+312.1% since first listed3 events — show timeline
- 2026-06-04 Listed $349,900 UNYREIS
- 2005-04-15 Sold (MLS) $89,000 UNYREIS
- 2004-11-18 Listed $84,900 UNYREIS
Cash-flow waterfall
monthlySold comps — $/sqft
last 12 mo · ≤1 miLoading sold comps…