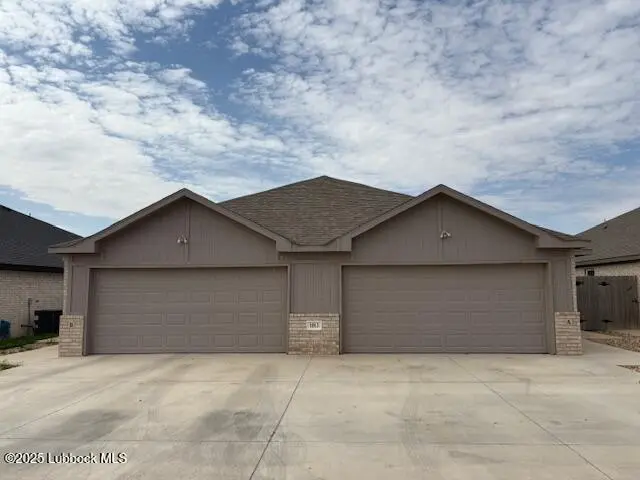
 Duplex
1013 Preston Trl · Wolfforth, TX
Flood risk 1/10 · Minimal
- FEMA flood zone
- X (unshaded)
- Chance of flooding over 30 yrs
- 0.0%
- Est. flood insurance / yr
- $507 – $1,088
Fire risk 7/10 · Major
- Est. fire insurance / yr
- $1,222 – $2,270
Heat risk 5/10 · Moderate
- Hot days now (above 99°F)
- 7 days/yr
- Hot days in 30 yrs
- 21 days/yr
Wind risk 2/10 · Minimal
- Chance of severe wind over 30 yrs
- —
Air-quality risk 2/10 · Minimal
- Unhealthy air days now
- 1 days/yr
- Unhealthy air days in 30 yrs
- 1 days/yr
Risk factors via First Street. Map © Google.
Why this score? — see what drove the C grade
The composite is a weighted blend of 9 inputs, each scored 0–100. Each bar is that input's sub-score; the figure is the points it added to the 100-point composite (weight × sub-score).
- Cash flow +17.4/30.0
- Appreciation +10.0/10.0
- ARV discount +7.5/15.0
- DSCR +5.4/10.0
- 1% rule +5.2/10.0
- Schools +4.4/10.0
- Livability +4.0/5.0
- Rent growth +2.5/5.0
- Condition / age +2.5/5.0
$345,000
🖨 Deal sheet 📄 Offer letter ✓ Due diligence
Multi-family units
County records classify this as Multi-Family (2-4 Unit). Listing-text estimate: 2 units. confirmed
Listing remarks MLS
Beautiful, newer duplex located in Frenship School District! Highly desirable upscale residential and rental area offering the convenience of being adjacent to Preston Manor. Each side of the duplex boasts 3 big bedrooms and 2 full bathrooms and a 2 car garage. Don't miss your opportunity to own this beauty!
Key facts
- 6,720 sq ft lot
- 2 garage spots
- Built 2022
Neighborhood map
What this means for you Summary
Snapshot
- This is a 2 × 3-bed/?-bath units multifamily listed at $345k.
Deal economics
- At list price, monthly cash flow is $261 ($3k/yr) — positive. Per door: $131/mo.
- The deal already cash-flows at list — no discount required.
- Meets the 1% rule at list price ($4k rent vs $345k).
- Recommended offer: $304k (12.0% below list) — sets the bar for market timing.
Location & tenants
- Location reads 80/100 on livability (#43 in TX, #1,872 nationally) — a professional / high-income tenant draw. Strengths: cost of living A+, housing A+, health & safety A+; Watch: amenities F, commute F.
- Frenship ISD (urban): math 47% / reading 54% proficiency, ranked #162 of 826 in TX (top 20%) — acceptable for families but not a draw, mixed tenant base, ~2y average lease.
- Market conditions: 472 active listings in the ZIP; solid renter incomes; 2,219 units permitted in Lubbock County in 2024 (252 in 5+ unit buildings).
- At $3,505/mo this rent would consume 50% of the median local household income ($84k/yr) (locally 135% of renters already pay >50% of income on rent) — very limited rent-growth headroom before tenants either downsize or default.
Forward outlook
- In year one you build about $37k of equity ($2k loan paydown + $34k appreciation (10.0% local appreciation)).
- Lubbock County population projected at +39% by 2050 — long-run rental-demand tailwind backs the buy-and-hold thesis.
- At projected returns (10.0% appreciation + 3.0% rent growth), your $97k cash investment doubles in ~3 years — after that, you're playing with house money.
- By year 2, paydown + projected appreciation supports a ~$59k cash-out refi (75% LTV) — recoverable capital for the next deal without selling this one.
Negotiation context
- It's been on market 364 days — a 12% lower offer ($304k) is reasonable based on typical stale-listing flexibility.
- 2 sale attempts with the ask held roughly flat each time — persistent listings suggest the price (not the market) is what's stuck; bring a comps-based counter.
Risks & watch-outs
- Climate carrying-cost: major wildfire risk; extreme-heat days projected 7→21/yr by 2055 (HVAC capex compounding) — expect insurance premiums to compound above CPI over the hold.
Questions for the listing agent
- It's been on market 364 days. Have you received any prior offers? Is the seller open to a 12% concession, seller financing, or rate buy-down credit?
- Can we see the unit-by-unit rent roll, current vacancy, and any below-market leases? What's the average tenancy length?
- What capital expenditures (roof, boiler, parking lot, exteriors) have been made in the last 5 years, and what's planned in the next 2?
- Why hasn't it sold? Are there any deal-killer items the seller is aware of (foundation, flood, title, zoning, code violations)?
- Is there a deadline driving the sale (1031 exchange, divorce, estate, relocation)? That informs how much negotiation room exists.
- Schools are B-rated — typically a magnet for longer-tenancy family renters. What's the average tenant stay here, and is there a school-zone premium baked into asking?
- What's the average days-on-market for RENTAL listings here right now (not sales)? A rising rental-DOM trend means longer vacancies and softer asking-rent achievability than the comps imply.
- What's the recent tenant-quality profile in this submarket — average credit score on applications, eviction rate, late-payment / NSF rate, and stable-employment percentage? A property-management company in the area should have these aggregated.
- How much new apartment / multifamily construction is in the pipeline within 1–3 miles? Heavy new supply (>2% of stock underway) typically softens rents 12–24 months out; light construction supports rent growth.
Investment metrics
- 1% rule
- 1.02% ✓
- Cap rate
- 7.20%
- Cash-on-cash
- 3.25%
- DSCR
- 1.14
- GRM
- 8.2
CMA / ARV
No comps found within radius.
Projected returns pro-forma
10.0% appreciation · 3.0% rent growth · sell at horizon
- IRR
- 26.6%
- Equity multiple
- 3.12×
- Total profit
- $204,664
- Equity at exit
- $310,803
- IRR
- 23.3%
- Equity multiple
- 7.11×
- Total profit
- $589,873
- Equity at exit
- $670,259
Cash invested: $96,600 (down + closing). Projections, not guarantees.
Landlord ↔ Tenant lean methodology
- Overall (STATE)
- 87 Strongly Landlord-Friendly
- State Texas
- 87 Strongly Landlord-Friendly · R+5
- County
- — inherits STATE
- City
- — inherits STATE
ZIP-level market 79382
- Active inventory
- 472
- Price-to-rent
- 16.4×
Monthly cashflow live
- Estimated rent
- $3,505 high interval (Pro) →
- Mortgage (P&I)
- −$1,809
- Tax from tax record
- −$555 /mo · $6,657/yr
- Insurance
- −$144
- HOA
- −$0
- Vacancy / Maint / Mgmt
- −$736
- Net cashflow
- $261
Break-even live
2-unit breakdown (identical units grouped — click to expand)
| Units | Beds | Baths | Est. rent |
|---|---|---|---|
| 2× units | 3 | — | $3,506 |
| #1 | 3 | — | $1,753 |
| #2 | 3 | — | $1,753 |
| Total (2 units) | $3,505 | ||
UW: 25.0% down · 7.5% · 30yr · 1.5% tax · 5.0% vac · 8.0% maint · 8.0% mgmt
Financing live
Cash to close
- Down payment
- $86,250
- Closing costs
- $10,350
- Reserves months
- —
- Total cash needed
- —
Loan-product check · same deal, 3 products live
Conventional
25% down · 7.5% · 30yr
- Down + closing
- —
- Monthly P&I
- —
- Monthly cashflow
- —
- DSCR
- —
- Eligible?
- —
Personal DTI + credit; lowest rate.
DSCR
20% down · 8.5% · 30yr
- Down + closing
- —
- Monthly P&I
- —
- Monthly cashflow
- —
- DSCR
- —
- Eligible?
- —
No personal income docs; deal must DSCR.
Hard money
10% down · 12.0% · 12mo
- Down + closing
- —
- Monthly P&I
- —
- Monthly cashflow
- —
- DSCR
- —
- Eligible?
- —
Short-term bridge; refi at stabilization.
Listing history 21 events
-
2026-06-18days on market $345,000 Active 364 DOM
-
2026-06-17days on market $345,000 Active 363 DOM
-
2026-06-16days on market $345,000 Active 362 DOM
-
2026-06-15days on market $345,000 Active 361 DOM
-
2026-06-13days on market $345,000 Active 358 DOM
-
2026-06-10days on market $345,000 Active 356 DOM
-
2026-06-09days on market $345,000 Active 355 DOM
-
2026-06-08days on market $345,000 Active 354 DOM
-
2026-06-07days on market $345,000 Active 353 DOM
-
2026-06-05days on market $345,000 Active 350 DOM
-
2026-06-03days on market $345,000 Active 349 DOM
-
2026-06-02days on market $345,000 Active 348 DOM
-
2026-06-01days on market $345,000 Active 347 DOM
-
2026-05-31days on market $345,000 Active 346 DOM
-
2026-05-30days on market $345,000 Active 345 DOM
-
2026-04-21status Active 310-char remark
Show marketing remark (310 chars)
Beautiful, newer duplex located in Frenship School District! Highly desirable upscale residential and rental area offering the convenience of being adjacent to Preston Manor. Each side of the duplex boasts 3 big bedrooms and 2 full bathrooms and a 2 car garage. Don't miss your opportunity to own this beauty!
-
2026-04-13status Pending 310-char remark
Show marketing remark (310 chars)
Beautiful, newer duplex located in Frenship School District! Highly desirable upscale residential and rental area offering the convenience of being adjacent to Preston Manor. Each side of the duplex boasts 3 big bedrooms and 2 full bathrooms and a 2 car garage. Don't miss your opportunity to own this beauty!
-
2025-06-06$345,000 Active 310-char remark
Show marketing remark (310 chars)
Beautiful, newer duplex located in Frenship School District! Highly desirable upscale residential and rental area offering the convenience of being adjacent to Preston Manor. Each side of the duplex boasts 3 big bedrooms and 2 full bathrooms and a 2 car garage. Don't miss your opportunity to own this beauty!
-
2025-01-10price $373,000
-
2024-07-10price $370,000
-
2022-08-08soldstatus
ⓘ Source: listings_history table (triggers on properties + properties_extension) + one-shot
backfill from property_details.listing_events for pre-trigger history.
Tax reassessment forecast TX · Resets to sale price
- Current annual tax
- $6,657 · $555/mo
- Projected year-2 tax
- $6,657 · $555/mo
- Expected delta
- $0/yr ($0/mo · 0.0%)
ⓘ Screening estimate from a state-policy table — verify with the county assessor before closing.
Climate risk First Street
- Flood 1/10 Low FEMA zone X (unshaded) · 0% chance over 30 yrs
- Wildfire 7/10 Severe
- Heat 5/10 Major 7 d/yr ≥99°F today · 21 d/yr by 30 yrs out
- Wind 2/10 Low
- Air quality 2/10 Low 1 unhealthy d/yr today · 1 by 30 yrs out
Nearby sold comps map
Loading sold comps map…
Walkable amenities ~0.75 mi
Loading nearby amenities…
Taxation est. · year 1
- Rental income
- $42,060
- − Mortgage interest
- −$19,325
- − Property taxes
- −$6,657
- − Insurance
- −$1,725
- − Repairs & maintenance
- −$3,365
- − Management
- −$3,365
- − Depreciation
- −$10,036
- Taxable loss
- −$2,413
- Est. tax savings @ 24.0%
- +$579
- After-tax cash flow
- $3,714/yr
For passive investors: Depreciation is non-cash, so a rental often shows a tax loss while cash-flowing — sheltering income. Rental losses are passive: they offset passive income freely, and up to $25,000/yr can offset ordinary (W-2) income if you actively participate and your MAGI is under $100k (phasing out to $0 by $150k); unused losses carry forward. On sale, claimed depreciation is recaptured at up to 25%, and gains may owe capital-gains tax (a 1031 exchange can defer both). Figures are a year-1 estimate at your 24.0% rate — not tax advice; consult a CPA.
Schools (NCES district)
- District
- Frenship ISD
- NCES district ID
- 4819830
- Math proficiency
- 47% ▼ -8.00%
- Reading proficiency
- 54% ▬ 0.00%
- Median HH income
- $54,376
- Composite
- 43.59/100
- National rank
- #2976
- State rank
- #162 of 826 in TX
Livability — Wolfforth
- Score
- 80/100
- State rank
- #43
- US rank
- #1872
Category grades
Schools grade is shown separately in the Schools card above.
Census & demographics
- Census place
- Wolfforth, TX
- County
- Lubbock County · 293,542 people
- City population
- 10,512
- Metro
- Lubbock, TX
- Population (ZIP)
- 10,512
- Household income
- $84,457
- Rent vs Own
- Severe rent burden
- 135.0
Population outlook (Lubbock County) Hauer SSP2
- Today (2025)
- 345,960 people
- By 2030
- 371,449 · +7.4%
- By 2040
- 424,539 · +22.7%
- By 2050
- 481,150 · +39.1%
- By 2075
- 633,467 · +83.1%
- By 2100
- 746,853 · +115.9%
Race, ethnicity, and origin ACS 2023
- Neighborhood character
- Majority White (64%)
- Race & ethnicity
- White 64% Hispanic / Latino 31% Two or more races 18% Black 1%
- Hispanic origin (detail)
- Mexican 28%
- Common ancestry
- Italian 4% Slovak 2% Lithuanian 2%
- Foreign-born
- 4% · Canada
- Languages at home
- 85% English-only · Spanish 14%
Political lean MEDSL · Lubbock
- 2024 margin
- Solid R (+39.5) · D 29.7% · R 69.2% · Other 1.0%
- 2008→2024 swing
- -2.8pp toward R · 2008: -36.7pp · 2024: -39.5pp
- All cycles
- 2024: R+39.5 2020: R+32.2 2016: R+38.4 2012: R+40.9 2008: R+36.7
Not yet ingested
- Civics
- —
Market trends
- HPI YoY
- ▲ 166.08%
- Current HPI
- 561.4491
- Rent YoY
- —
- Metro
- Lubbock, TX
- State GDP YoY
- ▲ 3.95%
- F500 in state
- 110
Industry mix (Fortune 500 HQ in TX)
| Industry | F500 HQs | Revenue |
|---|---|---|
| Energy | 16 | $1,198B |
|
||
| Technology | 5 | $198B |
|
||
| Engineering / Construction | 4 | $72B |
|
||
| Energy Services | 3 | $60B |
|
||
| Utilities | 3 | $41B |
|
||
| Healthcare | 2 | $330B |
|
||
Price history
-6.8% since first listed6 events — show timeline
- 2026-04-21 Relisted — LARMLS
- 2026-04-13 Pending — LARMLS
- 2025-06-06 Listed $345,000 LARMLS
- 2025-01-10 Price Changed $373,000 LARMLS
- 2024-07-10 Price Changed $370,000 LARMLS
- 2022-08-08 Sold (Public Records) — Public Records
Property tax history
+29.1%/yrLatest (2025): $6,657 · -11.5% YoY. Source: county tax records.
Cash-flow waterfall
monthlySold comps — $/sqft
last 12 mo · ≤1 miLoading sold comps…