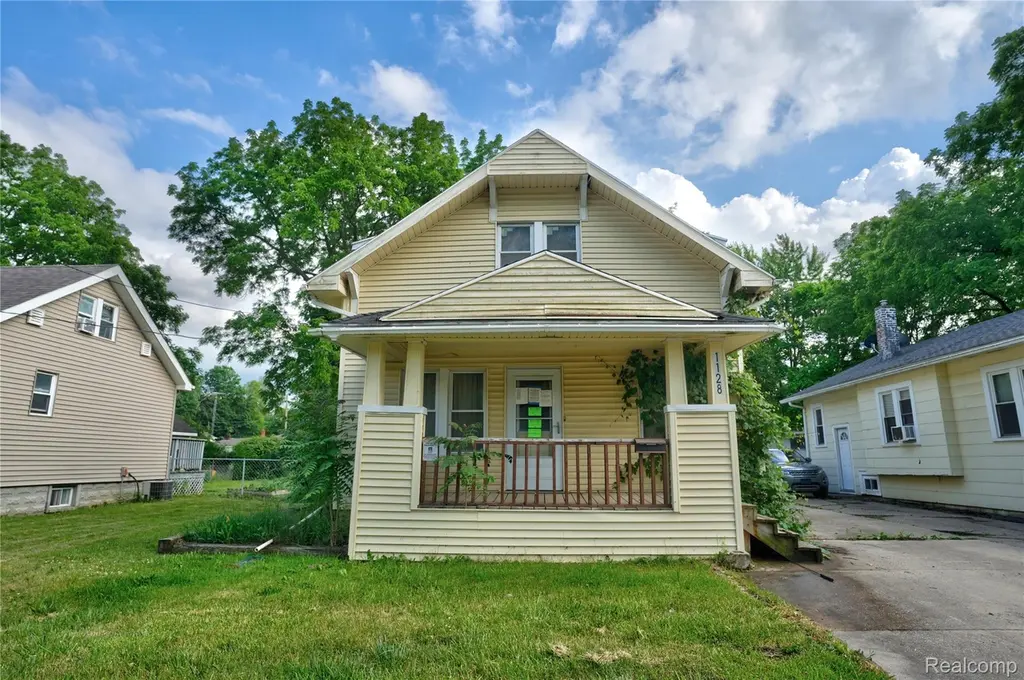
1128 Maginn Ct · Mount Morris, MI
Flood risk 1/10 · Minimal
- FEMA flood zone
- X (unshaded)
- Chance of flooding over 30 yrs
- 0.0%
- Est. flood insurance / yr
- $473 – $860
Fire risk 1/10 · Minimal
- Est. fire insurance / yr
- $784 – $1,456
Heat risk 2/10 · Minimal
- Hot days now (above 96°F)
- 7 days/yr
- Hot days in 30 yrs
- 14 days/yr
Wind risk 2/10 · Minimal
- Chance of severe wind over 30 yrs
- —
Air-quality risk 2/10 · Minimal
- Unhealthy air days now
- 1 days/yr
- Unhealthy air days in 30 yrs
- 3 days/yr
Risk factors via First Street. Map © Google.
Why this score? — see what drove the B- grade
The composite is a weighted blend of 9 inputs, each scored 0–100. Each bar is that input's sub-score; the figure is the points it added to the 100-point composite (weight × sub-score).
- Cash flow +30.0/30.0
- 1% rule +10.0/10.0
- DSCR +10.0/10.0
- ARV discount +7.5/15.0
- Livability +3.4/5.0
- Rent growth +2.5/5.0
- Condition / age +2.5/5.0
- Schools +1.1/10.0
- Appreciation +0.0/10.0
$59,500
🖨 Deal sheet 📄 Offer letter ✓ Due diligence
Listing remarks MLS
Investor Special!!! Looking for your next opportunity?? This fixer-upper is perfect for the experienced investor, flipper, or anyone looking for a serious value-add opportunity. The home needs repairs and is being sold AS-IS with no repairs or warranties. Great potential for a full rehab or renovation. Prime location near downtown Mt Morris and close to schools, shopping, food and expressway access. Cash offers only. Buyer responsible for all due diligence. Bring your flashlight! The upside IS definitely there for the right buyer! Bring your vision and your contractor!!
Key facts
- Downtown mt morris
- Close to schools
- Full rehab
Tags
Property features AI
Exterior
- Parking: Detached 2-car garage
- Utilities: Public water; Public sewer
- Home design: Single-family residence; Two levels; Ground-level entry; Vinyl siding exterior
- Construction: Block foundation
- Exterior features: Fenced backyard; Paved road access
Interior
- Bathrooms: 1 full bathroom
- Heating & cooling: Central air conditioning; Ceiling fans; Forced air heating; Natural gas heating
- Interior features: Unfinished basement; 6 total rooms
Neighborhood map
What this means for you Summary
Snapshot
- This is a 3-bed/1.0-bath single-family listed at $60k.
Deal economics
- At list price, monthly cash flow is $385 ($5k/yr) — positive.
- The deal already cash-flows at list — no discount required.
- Meets the 1% rule at list price ($1k rent vs $60k).
- Cap rate 14.1% vs local median 5.5% in Mount Morris — top-decile yield for the area; either an underpriced asset or a hidden risk that comps aren't pricing in. Stress-test before assuming the spread holds.
Location & tenants
- Location reads 68/100 on livability (#357 in MI) — a middle-class / working-renter tenant base. Strengths: cost of living A+, housing A+, health & safety A+; Watch: schools F, crime F, amenities F.
- Mt. Morris Consolidated Schools (suburban): math 7% / reading 19% proficiency, ranked #511 of 540 in MI (top 95%) — low school quality limits family demand, transient renter base, plan for 1-2y turnover; 73% free/reduced lunch — lower-income household profile, screen leases tightly.
- Market conditions: 144 active listings in the ZIP; 3 comparable units currently listed for rent nearby; rentals leasing fast (median 14d on market — plan ~1-2 weeks tenant-placement turnaround); 419 units permitted in Genesee County in 2024 (68 in 5+ unit buildings).
Forward outlook
- Local home prices are declining (-3.0%/yr); year-one equity from $411 of loan paydown is wiped out by about $2k of value loss. Plan a longer hold.
- Genesee County population projected at -27% by 2050 — secular population decline; favor cash flow + early exit over multi-decade hold.
- At projected returns (-3.0% appreciation + 3.0% rent growth), your $17k cash investment doubles in ~5 years — after that, you're playing with house money.
Negotiation context
- Only 3 days on market — expect competitive offers; lowballing is unlikely to land.
- 8 sale attempts since 30y ago with the ask held roughly flat each time — persistent listings suggest the price (not the market) is what's stuck; bring a comps-based counter.
Risks & watch-outs
- Watch-outs: property tax is 3.1% of price; built in 1940 — expect roof / HVAC / electrical / plumbing capex.
Questions for the listing agent
- Built in 1940 — when were the roof, HVAC, electrical panel, plumbing, and water heater last replaced?
- Property tax is high relative to price — has the assessment been appealed recently, and will the sale trigger a re-assessment?
- Is there a deadline driving the sale (1031 exchange, divorce, estate, relocation)? That informs how much negotiation room exists.
- Schools are F-rated, which usually means shorter tenancies and higher turnover. Who's the typical renter profile here, and what's been the actual vacancy rate?
- Crime grade is F in this area — have there been break-ins, vandalism, or insurance claims at this property in the last 3 years? What carrier currently insures it and at what premium?
- What's the average days-on-market for RENTAL listings here right now (not sales)? A rising rental-DOM trend means longer vacancies and softer asking-rent achievability than the comps imply.
- What's the recent tenant-quality profile in this submarket — average credit score on applications, eviction rate, late-payment / NSF rate, and stable-employment percentage? A property-management company in the area should have these aggregated.
- How much new for-sale + rental construction is in the pipeline within 1–3 miles? Heavy new supply typically softens prices + rents 12–24 months out; constrained supply supports both.
Investment metrics
- 1% rule
- 1.86% ✓
- Cap rate
- 14.06%
- Cash-on-cash
- 27.73%
- DSCR
- 2.23
- GRM
- 4.5
CMA / ARV
- ARV (on-the-fly)
- $120,120
- Comps found
- 12
Show comp detail 12 sales within ~0.75 mi
| Address | Dist | Beds/Ba | Sqft | Sold | Price | $/sf | Match |
|---|---|---|---|---|---|---|---|
| 1298 Garfield Ave | 0.25mi | 3/1.0 | 912 (+6%) | 9mo | $150,000 | $164 | 70 |
| 1297 Garfield Ave | 0.26mi | 3/1.0 | 925 (+8%) | 10mo | $129,900 | $140 | 67 |
| 11614 Temperance St | 0.23mi | 2/1.0 (-1) | 800 (-7%) | 8mo | $57,000 | $71 | 66 |
| 766 Louisa St | 0.33mi | 3/1.0 | 960 (+12%) | 3mo | $91,000 | $95 | 62 |
| 1031 E Pine Ave | 0.52mi | 2/1.5 (-1) | 900 (+5%) | 0mo | $125,000 | $139 | 60 |
| 619 Monroe Ave | 0.47mi | 2/1.0 (-1) | 792 (-8%) | 1mo | $118,000 | $149 | 59 |
| 1132 Wisner St | 0.53mi | 2/1.0 (-1) | 815 (-5%) | 7mo | $85,500 | $105 | 56 |
| 11343 Church St | 0.46mi | 3/1.0 | 928 (+8%) | 11mo | $130,000 | $140 | 56 |
| 1059 Corydon Dr | 0.63mi | 2/1.0 (-1) | 864 (+1%) | 13mo | $131,000 | $152 | 53 |
| 1150 Wisner St | 0.52mi | 3/1.0 | 945 (+10%) | 14mo | $105,000 | $111 | 47 |
| 1051 Pinehurst Blvd | 0.65mi | 2/1.0 (-1) | 956 (+11%) | 1mo | $159,500 | $167 | 45 |
| 556 Walnut St | 0.58mi | 2/1.0 (-1) | 756 (-12%) | 6mo | $100,000 | $132 | 43 |
Match score weights: distance 35% · size 25% · config 20% · recency 20%. Top-matched comps best support the ARV.
Projected returns pro-forma
-3.0% appreciation · 3.0% rent growth · sell at horizon
- IRR
- 21.9%
- Equity multiple
- 1.90×
- Total profit
- $14,941
- Equity at exit
- $8,872
- IRR
- 30.0%
- Equity multiple
- 3.69×
- Total profit
- $44,846
- Equity at exit
- $5,144
Cash invested: $16,660 (down + closing). Projections, not guarantees.
Landlord ↔ Tenant lean methodology
- Overall (STATE)
- 62 Landlord-Friendly
- State Michigan
- 62 Landlord-Friendly · EVEN
- County
- — inherits STATE
- City
- — inherits STATE
ZIP-level market 48458
- Home prices YoY
- -16.0%
- Active inventory
- 144
- Price-to-rent
- 4.5×
Monthly cashflow live
- Estimated rent
- $1,108 medium interval (Pro) →
- Mortgage (P&I)
- −$312
- Tax from tax record
- −$154 /mo · $1,847/yr
- Insurance
- −$25
- HOA
- −$0
- Vacancy / Maint / Mgmt
- −$233
- Net cashflow
- $385
Break-even live
UW: 25.0% down · 7.5% · 30yr · 1.5% tax · 5.0% vac · 8.0% maint · 8.0% mgmt
Financing live
Cash to close
- Down payment
- $14,875
- Closing costs
- $1,785
- Reserves months
- —
- Total cash needed
- —
Loan-product check · same deal, 3 products live
Conventional
25% down · 7.5% · 30yr
- Down + closing
- —
- Monthly P&I
- —
- Monthly cashflow
- —
- DSCR
- —
- Eligible?
- —
Personal DTI + credit; lowest rate.
DSCR
20% down · 8.5% · 30yr
- Down + closing
- —
- Monthly P&I
- —
- Monthly cashflow
- —
- DSCR
- —
- Eligible?
- —
No personal income docs; deal must DSCR.
Hard money
10% down · 12.0% · 12mo
- Down + closing
- —
- Monthly P&I
- —
- Monthly cashflow
- —
- DSCR
- —
- Eligible?
- —
Short-term bridge; refi at stabilization.
Rent comps 3 comps
| Address | Beds | Baths | Sqft | Rent | $/sqft | DOM | Units | Dist |
|---|---|---|---|---|---|---|---|---|
| 750 Jefferson St Mt Morris, MI | 1.0–2.0 | 1.0–2.0 | 828 | $1,020 | $1.23 | 13d | 4 | 0.28mi |
| 9070 N Saginaw Rd Apt 201 Mt Morris, MI | 2.0 | 1.0 | 700 | $940 | $1.34 | 13d | 1 | 1.02mi |
| 7028 Rosewood Dr Mt Morris, MI | 2.0 | 1.0 | 967 | $1,020 | $1.05 | 13d | 1 | 1.44mi |
Listing history 4 events
-
2026-06-15statusdays on market $59,500 Pending 3 DOM
-
2026-06-14days on market $59,500 Active 2 DOM
-
2026-06-13remarks 576-char remark
-
2026-06-13$59,500 Active 1 DOM
ⓘ Source: listings_history table (triggers on properties + properties_extension) + one-shot
backfill from property_details.listing_events for pre-trigger history.
Tax reassessment forecast MI · Partial reset (capped growth)
- Current annual tax
- $1,847 · $154/mo
- Projected year-2 tax
- $1,847 · $154/mo
- Expected delta
- $0/yr ($0/mo · 0.0%)
ⓘ Screening estimate from a state-policy table — verify with the county assessor before closing.
Climate risk First Street
- Flood 1/10 Low FEMA zone X (unshaded) · 0% chance over 30 yrs
- Wildfire 1/10 Low
- Heat 2/10 Low 7 d/yr ≥96°F today · 14 d/yr by 30 yrs out
- Wind 2/10 Low
- Air quality 2/10 Low 1 unhealthy d/yr today · 3 by 30 yrs out
Nearby sold comps map
Loading sold comps map…
Walkable amenities ~0.75 mi
Loading nearby amenities…
Taxation est. · year 1
- Rental income
- $13,301
- − Mortgage interest
- −$3,333
- − Property taxes
- −$1,847
- − Insurance
- −$298
- − Repairs & maintenance
- −$1,064
- − Management
- −$1,064
- − Depreciation
- −$1,731
- Taxable income
- $3,965
- Est. tax owed @ 24.0%
- −$952
- After-tax cash flow
- $3,668/yr
For passive investors: Depreciation is non-cash, so a rental often shows a tax loss while cash-flowing — sheltering income. Rental losses are passive: they offset passive income freely, and up to $25,000/yr can offset ordinary (W-2) income if you actively participate and your MAGI is under $100k (phasing out to $0 by $150k); unused losses carry forward. On sale, claimed depreciation is recaptured at up to 25%, and gains may owe capital-gains tax (a 1031 exchange can defer both). Figures are a year-1 estimate at your 24.0% rate — not tax advice; consult a CPA.
Schools (NCES district)
- District
- Mt. Morris Consolidated Schools
- NCES district ID
- 2624720
- Math proficiency
- 7% ▼ -9.00%
- Reading proficiency
- 19% ▼ -7.00%
- Median HH income
- $35,006
- Composite
- 10.63/100
- National rank
- #9774
- State rank
- #511 of 540 in MI
Livability — Mount Morris
- Score
- 68/100
- State rank
- #357
- US rank
- #9095
Category grades
Schools grade is shown separately in the Schools card above.
Census & demographics
- Census place
- Mount Morris, MI
- County
- Genesee County · 221,329 people
- City population
- 19,519
- Metro
- Flint, MI
- Population (ZIP)
- 19,519
- Household income
- $46,797
- Rent vs Own
- Severe rent burden
- 724.0
Population outlook (Genesee County) Hauer SSP2
- Today (2025)
- 381,312 people
- By 2030
- 362,731 · -4.9%
- By 2040
- 321,550 · -15.7%
- By 2050
- 279,212 · -26.8%
- By 2075
- 193,336 · -49.3%
- By 2100
- 128,118 · -66.4%
Race, ethnicity, and origin ACS 2023
- Neighborhood character
- Predominantly White (66%)
- Race & ethnicity
- White 66% Black 22% Two or more races 7% Hispanic / Latino 7%
- Hispanic origin (detail)
- Mexican 5%
- Common ancestry
- Lithuanian 5% Romanian 3% Slovak 1%
- Foreign-born
- 2% · Canada
- Languages at home
- 97% English-only · Spanish 2%
Political lean MEDSL · Genesee
- 2024 margin
- Toss-up / Even · D 51.4% · R 47.2% · Other 1.4%
- 2008→2024 swing
- -28.3pp toward R · 2008: 32.5pp · 2024: 4.2pp
- All cycles
- 2024: D+4.2 2020: D+9.3 2016: D+9.5 2012: D+28.2 2008: D+32.5
Not yet ingested
- Civics
- —
Market trends
- HPI YoY
- ▼ -46.45%
- Current HPI
- 244.2061
- Rent YoY
- —
- Metro
- Flint, MI
- State GDP YoY
- ▲ 1.37%
- F500 in state
- 28
Industry mix (Fortune 500 HQ in MI)
| Industry | F500 HQs | Revenue |
|---|---|---|
| Automotive Parts | 3 | $48B |
|
||
| Automotive | 2 | $372B |
|
||
| Chemicals | 1 | $45B |
|
||
| Automotive Retail | 1 | $29B |
|
||
| Healthcare / Medical Devices | 1 | $23B |
|
||
| Automotive Technology | 1 | $20B |
|
||
Price history
+26.9% since first listed25 events — show timeline
- 2026-06-12 Pending — MiRealSource-MiMLS
- 2026-06-11 Listed $59,500 REALCOMP
- 2026-06-11 Listed $59,500 MiRealSource-MiMLS
- 2026-04-14 Listing Removed — REALCOMP
- 2026-04-14 Listing Removed — REALCOMP
- 2026-04-14 Listed $40,000 REALCOMP
- 2026-04-14 Listing Removed — MiRealSource-MiMLS
- 2026-04-14 Listing Removed — MiRealSource-MiMLS
- 2026-04-14 Listed $40,000 MiRealSource-MiMLS
- 2022-10-25 Sold (Public Records) $92,000 Public Records
- 2022-10-21 Sold (MLS) $92,000 MiRealSource-MiMLS
- 2022-10-21 Sold (MLS) $92,000 REALCOMP
- 2022-09-08 Pending — MiRealSource-MiMLS
- 2022-09-08 Pending — REALCOMP
- 2022-08-13 Price Changed $88,000 MiRealSource-MiMLS
- 2022-08-12 Price Changed $88,000 REALCOMP
- 2022-06-09 Price Changed $90,000 MiRealSource-MiMLS
- 2022-06-09 Price Changed $90,000 REALCOMP
- 2022-06-03 Listed $92,000 MiRealSource-MiMLS
- 2022-06-03 Listed $92,000 REALCOMP
- 1996-06-21 Sold (MLS) $43,900 MiRealSource-MiMLS
- 1996-06-21 Sold (MLS) $43,900 REALCOMP
- 1996-05-15 Listing Removed — MiRealSource-MiMLS
- 1996-05-01 Listed $46,900 MiRealSource-MiMLS
- 1996-05-01 Listed $46,900 REALCOMP
Property tax history
+5.6%/yrLatest (2025): $1,847 · +2.3% YoY. Source: county tax records.
Cash-flow waterfall
monthlySold comps — $/sqft
last 12 mo · ≤1 miLoading sold comps…