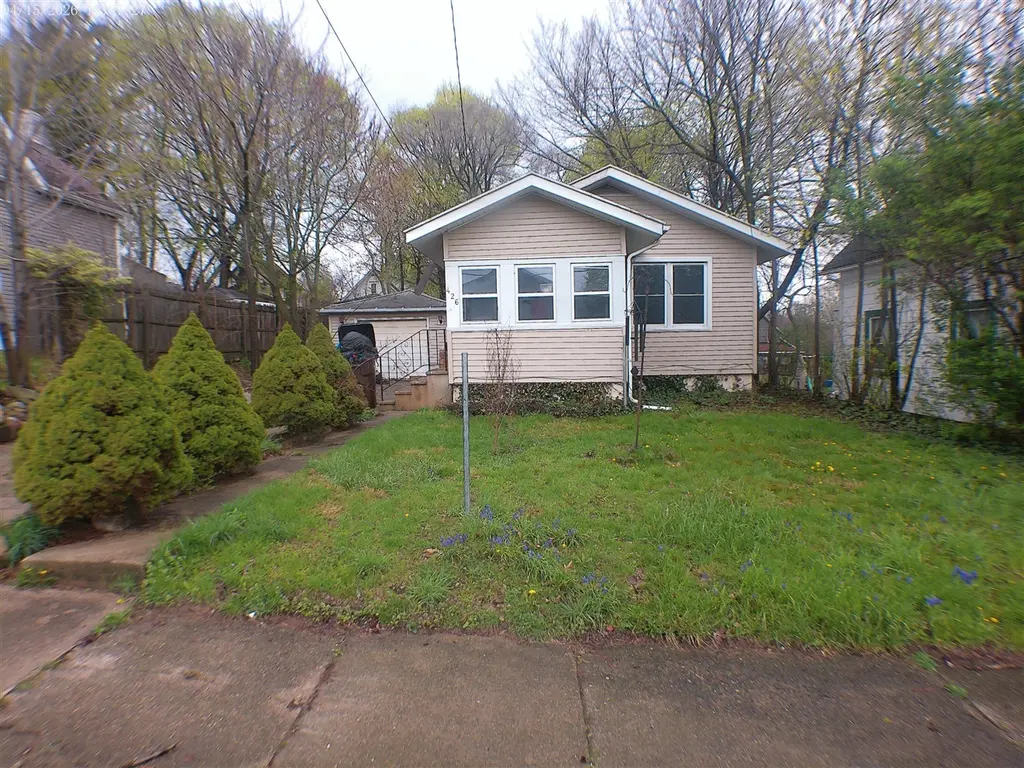
426 Madison St · Jackson, MI
Flood risk 1/10 · Minimal
- FEMA flood zone
- X (unshaded)
- Chance of flooding over 30 yrs
- 0.0%
- Est. flood insurance / yr
- $473 – $860
Fire risk 1/10 · Minimal
- Est. fire insurance / yr
- $784 – $1,456
Heat risk 3/10 · Minor
- Hot days now (above 98°F)
- 7 days/yr
- Hot days in 30 yrs
- 15 days/yr
Wind risk 2/10 · Minimal
- Chance of severe wind over 30 yrs
- —
Air-quality risk 2/10 · Minimal
- Unhealthy air days now
- 1 days/yr
- Unhealthy air days in 30 yrs
- 1 days/yr
Risk factors via First Street. Map © Google.
Why this score? — see what drove the B- grade
The composite is a weighted blend of 9 inputs, each scored 0–100. Each bar is that input's sub-score; the figure is the points it added to the 100-point composite (weight × sub-score).
- Cash flow +26.4/30.0
- ARV discount +15.0/15.0
- DSCR +9.0/10.0
- 1% rule +7.0/10.0
- Livability +3.7/5.0
- Rent growth +2.5/5.0
- Condition / age +2.5/5.0
- Schools +1.8/10.0
- Appreciation +0.0/10.0
$80,000
🖨 Deal sheet (PDF) 📄 Offer letter ✓ Due diligence
Listing remarks MLS
This stunning home at 426 Madison, Jackson, MI, is a must-see! Welcome to 426 Madison St in Jackson, Michigan! This home is full of potential and ready for someone to bring their vision to life. Offering great space and a solid layout, this property could be the perfect opportunity for a homeowner or investor looking to add their personal touch. While the home does need some care and updates, the possibilities are endless. With a little work and creativity, this could become a truly amazing place to call home. Don't miss the chance to turn this property into something special!
Key facts
- 6,098 sq ft lot
- Garage
- Built 1920
Neighborhood map
What this means for you Summary
Snapshot
- This is a 2-bed/1.0-bath single-family listed at $80k.
Deal economics
- At list price, monthly cash flow is $210 ($3k/yr) — positive.
- The deal already cash-flows at list — no discount required.
- Meets the 1% rule at list price ($962 rent vs $80k).
- Recommended offer: $75k (6.0% below list) — sets the bar for market timing.
- Cap rate 9.4% vs local median 5.4% in Jackson — top-decile yield for the area; either an underpriced asset or a hidden risk that comps aren't pricing in. Stress-test before assuming the spread holds.
Location & tenants
- Location reads 74/100 on livability (#197 in MI, #4,970 nationally) — a middle-class / working-renter tenant base. Strengths: cost of living A+, housing A+, health & safety A+; Watch: schools D, crime F, employment F.
- Jackson Public Schools (urban): math 15% / reading 28% proficiency, ranked #458 of 540 in MI (top 85%) — low school quality limits family demand, transient renter base, plan for 1-2y turnover; 63% free/reduced lunch — lower-income household profile, screen leases tightly.
- Market conditions: 80 active listings in the ZIP; 9 comparable units currently listed for rent nearby; rentals lingering (median 45d on market — plan ~5-8 weeks vacancy on turnover, expect pricing pressure); 100% of comp listings sitting > 30 days — soft ceiling on asking rent; 317 units permitted in Jackson County in 2024 (103 in 5+ unit buildings).
Forward outlook
- Local home prices are declining (-3.0%/yr); year-one equity from $553 of loan paydown is wiped out by about $2k of value loss. Plan a longer hold.
- Jackson County population projected at -13% by 2050 — secular population decline; favor cash flow + early exit over multi-decade hold.
- At projected returns (-3.0% appreciation + 3.0% rent growth), your $22k cash investment doubles in ~10 years — after that, you're playing with house money.
Negotiation context
- It's been on market 64 days — a 6% lower offer ($75k) is reasonable based on typical stale-listing flexibility.
- 8 sale attempts since 20y ago; this cycle's ask has dropped $8k (9%) from the opening price — seller is motivated, your offer sets the floor, not the list.
Risks & watch-outs
- Watch-outs: built in 1920 — expect roof / HVAC / electrical / plumbing capex.
Questions for the listing agent
- It's been on market 64 days. Have you received any prior offers? Is the seller open to a 6% concession, seller financing, or rate buy-down credit?
- Built in 1920 — when were the roof, HVAC, electrical panel, plumbing, and water heater last replaced?
- Why hasn't it sold? Are there any deal-killer items the seller is aware of (foundation, flood, title, zoning, code violations)?
- Is there a deadline driving the sale (1031 exchange, divorce, estate, relocation)? That informs how much negotiation room exists.
- Schools are D-rated, which usually means shorter tenancies and higher turnover. Who's the typical renter profile here, and what's been the actual vacancy rate?
- Crime grade is F in this area — have there been break-ins, vandalism, or insurance claims at this property in the last 3 years? What carrier currently insures it and at what premium?
- What's the average days-on-market for RENTAL listings here right now (not sales)? A rising rental-DOM trend means longer vacancies and softer asking-rent achievability than the comps imply.
- What's the recent tenant-quality profile in this submarket — average credit score on applications, eviction rate, late-payment / NSF rate, and stable-employment percentage? A property-management company in the area should have these aggregated.
- How much new for-sale + rental construction is in the pipeline within 1–3 miles? Heavy new supply typically softens prices + rents 12–24 months out; constrained supply supports both.
Investment metrics
- 1% rule
- 1.20% ✓
- Cap rate
- 9.44%
- Cash-on-cash
- 11.24%
- DSCR
- 1.50
- GRM
- 6.9
CMA / ARV
- ARV (median comp)
- $115,174
- List price
- $80,000
- Delta
- -30.54%
- Verdict
- UNDERPRICED
- Comps
- 20 within 1.0 mi
Show comp detail 12 sales within ~0.75 mi
| Address | Dist | Beds/Ba | Sqft | Sold | Price | $/sf | Match |
|---|---|---|---|---|---|---|---|
| 520 Andrew Ave | 0.38mi | 2/1.0 | 868 (+2%) | 4mo | $153,500 | $177 | 75 |
| 618 Madison St | 0.22mi | 2/1.0 | 816 (-4%) | 10mo | $130,000 | $159 | 75 |
| 833 Backus St | 0.46mi | 2/1.0 | 788 (-7%) | 3mo | $70,000 | $89 | 64 |
| 550 Sparks St | 0.31mi | 2/1.0 | 948 (+12%) | 4mo | $128,700 | $136 | 62 |
| 735 Royal Dr | 0.57mi | 2/1.0 | 936 (+10%) | 3mo | $120,000 | $128 | 54 |
| 1125 Walker St | 0.52mi | 2/1.0 | 768 (-9%) | 8mo | $109,900 | $143 | 53 |
| 1114 Hamilton St | 0.55mi | 2/1.0 | 748 (-12%) | 3mo | $130,000 | $174 | 52 |
| 1123 Walker St | 0.52mi | 2/1.0 | 960 (+13%) | 9mo | $169,900 | $177 | 46 |
| 120 Austin Ave | 0.69mi | 2/1.0 | 929 (+10%) | 8mo | $127,500 | $137 | 46 |
| 612 Bush St | 0.69mi | 2/1.0 | 936 (+10%) | 7mo | $149,900 | $160 | 45 |
| 801 Center St | 0.69mi | 2/1.0 | 746 (-12%) | 4mo | $89,900 | $121 | 44 |
| 1410 Rowena Ln | 0.74mi | 2/1.0 | 975 (+15%) | 4mo | $155,000 | $159 | 37 |
Match score weights: distance 35% · size 25% · config 20% · recency 20%. Top-matched comps best support the ARV.
Projected returns pro-forma
-3.0% appreciation · 3.0% rent growth · sell at horizon
- IRR
- 0.5%
- Equity multiple
- 1.02×
- Total profit
- $418
- Equity at exit
- $11,928
- IRR
- 10.1%
- Equity multiple
- 1.79×
- Total profit
- $17,630
- Equity at exit
- $6,917
Cash invested: $22,400 (down + closing). Projections, not guarantees.
Landlord ↔ Tenant lean methodology
- Overall (STATE)
- 62 Landlord-Friendly
- State Michigan
- 62 Landlord-Friendly · EVEN
- County
- — inherits STATE
- City
- — inherits STATE
ZIP-level market 49202
- Active inventory
- 80
- Price-to-rent
- 6.9×
Monthly cashflow live
- Estimated rent
- $962 high interval (Pro) →
- Mortgage (P&I)
- −$420
- Tax from tax record
- −$97 /mo · $1,167/yr
- Insurance
- −$33
- HOA
- −$0
- Vacancy / Maint / Mgmt
- −$202
- Net cashflow
- $210
Break-even live
Sensitivity live
| Price | -10% $255 | -5% $233 | +0% $210 | +5% $187 | +10% $165 |
|---|---|---|---|---|---|
| Rent | -10% $134 | -5% $172 | +0% $210 | +5% $248 | +10% $286 |
| Rate | -1.0pp $250 | -0.5pp $230 | base $210 | +0.5pp $189 | +1.0pp $168 |
UW: 25.0% down · 7.5% · 30yr · 1.5% tax · 5.0% vac · 8.0% maint · 8.0% mgmt
Financing live
Cash to close
- Down payment
- $20,000
- Closing costs
- $2,400
- Reserves months
- —
- Total cash needed
- —
Loan-product check · same deal, 3 products live
Conventional
25% down · 7.5% · 30yr
- Down + closing
- —
- Monthly P&I
- —
- Monthly cashflow
- —
- DSCR
- —
- Eligible?
- —
Personal DTI + credit; lowest rate.
DSCR
20% down · 8.5% · 30yr
- Down + closing
- —
- Monthly P&I
- —
- Monthly cashflow
- —
- DSCR
- —
- Eligible?
- —
No personal income docs; deal must DSCR.
Hard money
10% down · 12.0% · 12mo
- Down + closing
- —
- Monthly P&I
- —
- Monthly cashflow
- —
- DSCR
- —
- Eligible?
- —
Short-term bridge; refi at stabilization.
Rent comps 9 comps
| Address | Beds | Baths | Sqft | Rent | $/sqft | DOM | Units | Dist |
|---|---|---|---|---|---|---|---|---|
| 521 W North St Jackson, MI | 2.0 | 1.0 | 684 | $1,000 | $1.46 | 45d | 1 | 0.44mi |
| 100 Armory Ct Jackson, MI | 1.0 | 1.0 | 800 | $788 | $0.98 | 45d | 1 | 0.70mi |
| 653 Oakhill Ave Jackson, MI | 2.0 | 1.0 | 900 | $950 | $1.06 | 45d | 1 | 0.82mi |
| 720 W Michigan Ave Jackson, MI | 2.0 | 1.0 | 972 | $900 | $0.93 | 45d | 1 | 1.19mi |
| 159 W Pearl St Unit 202 Jackson, MI | 2.0 | 1.0 | 1000 | $1,350 | $1.35 | 45d | 1 | 1.23mi |
| 408 N Perrine St Jackson, MI | 3.0 | 1.0 | 990 | $1,350 | $1.36 | 45d | 1 | 1.26mi |
| 305 1st St Jackson, MI | 1.0 | 1.0 | 600 | $720 | $1.20 | 45d | 1 | 1.36mi |
| 225 W Washington Ave Apt 4 Jackson, MI | 1.0 | 1.0 | 850 | $850 | $1.00 | 45d | 1 | 1.38mi |
| 225 W Washington Ave Apt 5 Jackson, MI | 1.0 | 1.0 | 850 | $825 | $0.97 | 45d | 1 | 1.38mi |
Listing history 31 events
-
2026-06-19days on market $80,000 Active 64 DOM
-
2026-06-18days on market $80,000 Active 63 DOM
-
2026-06-17days on market $80,000 Active 62 DOM
-
2026-06-16days on market $80,000 Active 61 DOM
-
2026-06-15days on market $80,000 Active 60 DOM
-
2026-06-14days on market $80,000 Active 58 DOM
-
2026-06-13days on market $80,000 Active 57 DOM
-
2026-06-10days on market $80,000 Active 55 DOM
-
2026-06-09days on market $80,000 Active 54 DOM
-
2026-06-08days on market $80,000 Active 53 DOM
-
2026-06-07days on market $80,000 Active 52 DOM
-
2026-06-03days on market $80,000 Active 48 DOM
-
2026-06-02days on market $80,000 Active 47 DOM
-
2026-06-01days on market $80,000 Active 46 DOM
-
2026-05-31days on market $80,000 Active 45 DOM
-
2026-05-30days on market $80,000 Active 44 DOM
-
2026-04-16$87,500 Active 583-char remark
Show marketing remark (583 chars)
This stunning home at 426 Madison, Jackson, MI, is a must-see! Welcome to 426 Madison St in Jackson, Michigan! This home is full of potential and ready for someone to bring their vision to life. Offering great space and a solid layout, this property could be the perfect opportunity for a homeowner or investor looking to add their personal touch. While the home does need some care and updates, the possibilities are endless. With a little work and creativity, this could become a truly amazing place to call home. Don't miss the chance to turn this property into something special!
-
2026-04-16price $87,500 583-char remark
Show marketing remark (583 chars)
This stunning home at 426 Madison, Jackson, MI, is a must-see! Welcome to 426 Madison St in Jackson, Michigan! This home is full of potential and ready for someone to bring their vision to life. Offering great space and a solid layout, this property could be the perfect opportunity for a homeowner or investor looking to add their personal touch. While the home does need some care and updates, the possibilities are endless. With a little work and creativity, this could become a truly amazing place to call home. Don't miss the chance to turn this property into something special!
-
2026-04-15$90,000 Active 583-char remark
Show marketing remark (583 chars)
This stunning home at 426 Madison, Jackson, MI, is a must-see! Welcome to 426 Madison St in Jackson, Michigan! This home is full of potential and ready for someone to bring their vision to life. Offering great space and a solid layout, this property could be the perfect opportunity for a homeowner or investor looking to add their personal touch. While the home does need some care and updates, the possibilities are endless. With a little work and creativity, this could become a truly amazing place to call home. Don't miss the chance to turn this property into something special!
-
2026-04-15$87,500 Active
Show marketing remark (583 chars)
This stunning home at 426 Madison, Jackson, MI, is a must-see! Welcome to 426 Madison St in Jackson, Michigan! This home is full of potential and ready for someone to bring their vision to life. Offering great space and a solid layout, this property could be the perfect opportunity for a homeowner or investor looking to add their personal touch. While the home does need some care and updates, the possibilities are endless. With a little work and creativity, this could become a truly amazing place to call home. Don't miss the chance to turn this property into something special!
-
2023-11-26historical
-
2023-11-25historical
-
2023-09-15$79,900 Active
-
2023-09-15$79,900 Active
-
2007-01-05soldstatus $72,500
-
2007-01-05soldstatus $72,500
-
2007-01-05soldstatus $72,500
-
2006-12-09historical
-
2006-11-16$79,000
-
2006-11-16$79,000
-
2006-11-16$79,000
ⓘ Source: listings_history table (triggers on properties + properties_extension) + one-shot
backfill from property_details.listing_events for pre-trigger history.
Tax reassessment forecast MI · Partial reset (capped growth)
- Current annual tax
- $1,167 · $97/mo
- Projected year-2 tax
- $1,200 · $100/mo
- Expected delta
- +$32/yr (+$3/mo · 2.8%)
ⓘ Screening estimate from a state-policy table — verify with the county assessor before closing.
Climate risk First Street
- Flood 1/10 Low FEMA zone X (unshaded) · 0% chance over 30 yrs
- Wildfire 1/10 Low
- Heat 3/10 Moderate 7 d/yr ≥98°F today · 15 d/yr by 30 yrs out
- Wind 2/10 Low
- Air quality 2/10 Low 1 unhealthy d/yr today · 1 by 30 yrs out
Nearby sold comps map
Loading sold comps map…
Walkable amenities ~0.75 mi
Loading nearby amenities…
Taxation est. · year 1
- Rental income
- $11,545
- − Mortgage interest
- −$4,481
- − Property taxes
- −$1,167
- − Insurance
- −$400
- − Repairs & maintenance
- −$924
- − Management
- −$924
- − Depreciation
- −$2,327
- Taxable income
- $1,322
- Est. tax owed @ 24.0%
- −$317
- After-tax cash flow
- $2,202/yr
For passive investors: Depreciation is non-cash, so a rental often shows a tax loss while cash-flowing — sheltering income. Rental losses are passive: they offset passive income freely, and up to $25,000/yr can offset ordinary (W-2) income if you actively participate and your MAGI is under $100k (phasing out to $0 by $150k); unused losses carry forward. On sale, claimed depreciation is recaptured at up to 25%, and gains may owe capital-gains tax (a 1031 exchange can defer both). Figures are a year-1 estimate at your 24.0% rate — not tax advice; consult a CPA.
Schools (NCES district)
- District
- Jackson Public Schools
- NCES district ID
- 2619620
- Math proficiency
- 15% ▼ -6.00%
- Reading proficiency
- 28% ▼ -3.00%
- Median HH income
- $38,344
- Composite
- 17.99/100
- National rank
- #8986
- State rank
- #458 of 540 in MI
Livability — Jackson
- Score
- 74/100
- State rank
- #197
- US rank
- #4970
Category grades
Schools grade is shown separately in the Schools card above.
Census & demographics
- Census place
- Jackson, MI
- City population
- 85,581
- Population (ZIP)
- 18,763
Population outlook (Jackson County) Hauer SSP2
- Today (2025)
- 156,365 people
- By 2030
- 153,123 · -2.1%
- By 2040
- 144,981 · -7.3%
- By 2050
- 135,671 · -13.2%
- By 2075
- 113,833 · -27.2%
- By 2100
- 86,592 · -44.6%
Race, ethnicity, and origin ACS 2023
- Neighborhood character
- Predominantly White (75%)
- Race & ethnicity
- White 75% Two or more races 11% Black 10% Hispanic / Latino 5% Asian 1%
- Common ancestry
- Romanian 9% Iranian 2% Lithuanian 2%
- Foreign-born
- 3% · Canada
- Languages at home
- 94% English-only · Spanish 3% Other Asian/Pacific 1% Arabic 1%
Political lean MEDSL · Jackson
- 2024 margin
- Strong R (+21.3) · D 38.6% · R 59.9% · Other 1.5%
- 2008→2024 swing
- -23.7pp toward R · 2008: 2.4pp · 2024: -21.3pp
- All cycles
- 2024: R+21.3 2020: R+19.0 2016: R+20.1 2012: R+5.8 2008: D+2.4
Not yet ingested
- Civics
- —
Market trends
- HPI YoY
- ▼ -175.30%
- Current HPI
- 170.3682
- Rent YoY
- —
- Metro
- —
- State GDP YoY
- ▲ 1.37%
- F500 in state
- 28
Industry mix (Fortune 500 HQ in MI)
| Industry | F500 HQs | Revenue |
|---|---|---|
| Automotive Parts | 3 | $48B |
|
||
| Automotive | 2 | $372B |
|
||
| Chemicals | 1 | $45B |
|
||
| Automotive Retail | 1 | $29B |
|
||
| Healthcare / Medical Devices | 1 | $23B |
|
||
| Automotive Technology | 1 | $20B |
|
||
Price history
+10.8% since first listed15 events — show timeline
- 2026-04-16 Listed $87,500 REALCOMP
- 2026-04-16 Price Changed $87,500 SW Michigan MLS
- 2026-04-15 Listed $87,500 MiRealSource-MiMLS
- 2026-04-15 Listed $90,000 SW Michigan MLS
- 2023-11-26 Listing Removed — MiRealSource-MiMLS
- 2023-11-25 Listing Removed — REALCOMP
- 2023-09-15 Listed $79,900 MiRealSource-MiMLS
- 2023-09-15 Listed $79,900 REALCOMP
- 2007-01-05 Sold (MLS) $72,500 MiRealSource-MiMLS
- 2007-01-05 Sold (MLS) $72,500 REALCOMP
- 2007-01-05 Sold (MLS) $72,500 SW Michigan MLS
- 2006-12-09 Listing Removed — MiRealSource-MiMLS
- 2006-11-16 Listed $79,000 MiRealSource-MiMLS
- 2006-11-16 Listed $79,000 REALCOMP
- 2006-11-16 Listed $79,000 SW Michigan MLS
Property tax history
+3.1%/yrLatest (2025): $1,167 · -26.6% YoY. Source: county tax records.
Cash-flow waterfall
monthlySold comps — $/sqft
last 12 mo · ≤1 miLoading sold comps…