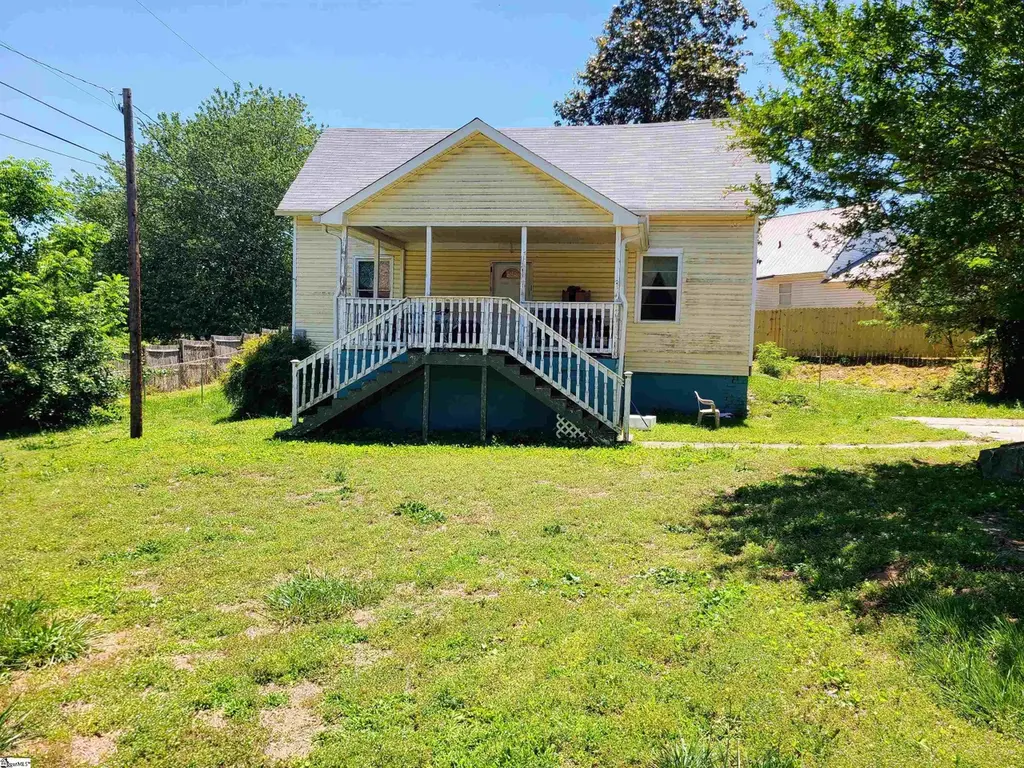
31 Mccaughrin St · Pelzer, SC
Flood risk 1/10 · Minimal
- FEMA flood zone
- X (unshaded)
- Chance of flooding over 30 yrs
- 0.0%
- Est. flood insurance / yr
- $507 – $1,088
Fire risk 4/10 · Minor
- Est. fire insurance / yr
- $783 – $1,453
Heat risk 6/10 · Moderate
- Hot days now (above 106°F)
- 7 days/yr
- Hot days in 30 yrs
- 17 days/yr
Wind risk 2/10 · Minimal
- Chance of severe wind over 30 yrs
- 1.0%
Air-quality risk 4/10 · Minor
- Unhealthy air days now
- 3 days/yr
- Unhealthy air days in 30 yrs
- 4 days/yr
Risk factors via First Street. Map © Google.
Why this score? — see what drove the C+ grade
The composite is a weighted blend of 9 inputs, each scored 0–100. Each bar is that input's sub-score; the figure is the points it added to the 100-point composite (weight × sub-score).
- Cash flow +26.6/30.0
- DSCR +9.1/10.0
- ARV discount +7.5/15.0
- 1% rule +5.9/10.0
- Schools +5.0/10.0
- Livability +3.7/5.0
- Rent growth +2.5/5.0
- Condition / age +2.5/5.0
- Appreciation +0.0/10.0
$128,000
🖨 Deal sheet (PDF) 📄 Offer letter ✓ Due diligence
Listing remarks
Located in the heart of Pelzer, this 3-bedroom, 1-bath home offers plenty of space and potential at an affordable price point. The layout features two bedrooms on the main level and a private upstairs bedroom with an additional bonus loft area, perfect for extra living space, a home office, or storage. The large kitchen includes an eat-in breakfast area, while the spacious living room provides a comfortable gathering space. Outside, you’ll enjoy a large front porch deck ideal for relaxing. A new roof has already been installed, adding value and peace of mind. Property is being sold as-is and is priced to sell quickly. Please note: the home will not qualify for traditional financing.
Key facts
- Bonus loft area
- New roof
- Listed 37 days
Tags
Property features AI
Finance
- HOA & community: No HOA fees
Exterior
- Parking: Paved driveway; No garage
- Utilities: Public water; Electric water heater; Public sewer; Public garbage pickup; Electric service
- Home design: Two-story home; Approximately 50+ years old; Crawl space foundation; Vinyl siding with full brick veneer; Architectural roof
- Construction: Vinyl siding; Full brick veneer; Architectural roof; Crawl space foundation; Outbuilding for additional storage
- Exterior features: Front porch; Deck; Some storm doors; Some storm windows; Level lot with some trees; Outbuilding (storage)
Interior
- Kitchen: 16 x 10 kitchen; Dishwasher; Microwave; Refrigerator; Electric freestanding range
- Bedrooms: Primary bedroom on main level (15 x 12); Second bedroom (14 x 11); Third bedroom (17 x 15); Two bedrooms on the main level
- Flooring: Carpet; Hardwood/pine under carpet; Laminate flooring
- Bathrooms: One full bathroom (on main level)
- Heating & cooling: Electric heating; Forced air; Heat pump; Central forced cooling (electric)
- Interior features: Cable available; Ceiling fans; Smooth ceilings; Blown ceiling insulation; Smoke detector; Some window treatments; Garden tub; Laminate countertops
- Laundry & utility: First-floor laundry; Walk-in laundry
Neighborhood map
What this means for you Summary
Snapshot
- This is a 3-bed/1.0-bath other listed at $128k.
Deal economics
- At list price, monthly cash flow is $342 ($4k/yr) — positive.
- The deal already cash-flows at list — no discount required.
- Meets the 1% rule at list price ($1k rent vs $128k).
- Recommended offer: $124k (3.0% below list) — sets the bar for market timing.
Location & tenants
- Location reads 73/100 on livability (#42 in SC) — a middle-class / working-renter tenant base. Strengths: cost of living A+, housing A+, health & safety A+; Watch: amenities D-, commute F, employment F.
- Anderson 01 (rural): math 58% / reading 60% proficiency, ranked #3 of 80 in SC (top 4%) — acceptable for families but not a draw, mixed tenant base, ~2y average lease.
- Zoned schools: West Pelzer Elementary (math 47% / reading 42%, grade F, #226 of 597 statewide, top 40%, 362 students, 86% FRL); Palmetto Middle (math 41% / reading 46%, grade D, #57 of 229 statewide, top 25%, 774 students, 70% FRL); Palmetto High (math 77% / reading 77%, grade A-, #28 of 196 statewide, top 16%, 1,021 students, 67% FRL) — zoned schools average 74% FRL vs 35% district-wide (39 pts higher); higher-poverty schools than district average — tighter screening recommended.
- Market conditions: 112 active listings in the ZIP; 1 comparable units currently listed for rent nearby; 1,255 units permitted in Anderson County in 2024 (0 in 5+ unit buildings).
Forward outlook
- Local home prices are declining (-3.0%/yr); year-one equity from $885 of loan paydown is wiped out by about $4k of value loss. Plan a longer hold.
- Anderson County population projected at +14% by 2050 — modest demand growth; plan on rents tracking national, not racing it.
- At projected returns (-3.0% appreciation + 3.0% rent growth), your $36k cash investment doubles in ~10 years — after that, you're playing with house money.
Negotiation context
- It's been on market 37 days — a 3% lower offer ($124k) is reasonable based on typical stale-listing flexibility.
- Current owner paid $30k; list at $128k implies a 327% gain — meaningful room to come down on a strong offer.
Risks & watch-outs
- Climate carrying-cost: extreme-heat days projected 7→17/yr by 2055 (HVAC capex compounding) — expect insurance premiums to compound above CPI over the hold.
Questions for the listing agent
- It's been on market 37 days. Have you received any prior offers? Is the seller open to a 3% concession, seller financing, or rate buy-down credit?
- Is there a deadline driving the sale (1031 exchange, divorce, estate, relocation)? That informs how much negotiation room exists.
- What's the average days-on-market for RENTAL listings here right now (not sales)? A rising rental-DOM trend means longer vacancies and softer asking-rent achievability than the comps imply.
- What's the recent tenant-quality profile in this submarket — average credit score on applications, eviction rate, late-payment / NSF rate, and stable-employment percentage? A property-management company in the area should have these aggregated.
- How much new for-sale + rental construction is in the pipeline within 1–3 miles? Heavy new supply typically softens prices + rents 12–24 months out; constrained supply supports both.
Investment metrics
- 1% rule
- 1.09% ✓
- Cap rate
- 9.50%
- Cash-on-cash
- 11.46%
- DSCR
- 1.51
- GRM
- 7.6
CMA / ARV
No comps found within radius.
Projected returns pro-forma
-3.0% appreciation · 3.0% rent growth · sell at horizon
- IRR
- 0.7%
- Equity multiple
- 1.03×
- Total profit
- $1,001
- Equity at exit
- $19,085
- IRR
- 10.3%
- Equity multiple
- 1.80×
- Total profit
- $28,721
- Equity at exit
- $11,067
Cash invested: $35,840 (down + closing). Projections, not guarantees.
Landlord ↔ Tenant lean methodology
- Overall (STATE)
- 90 Strongly Landlord-Friendly
- State South Carolina
- 90 Strongly Landlord-Friendly · R+6
- County
- — inherits STATE
- City
- — inherits STATE
ZIP-level market 29669
- Home prices YoY
- -18.9%
- Active inventory
- 112
- Price-to-rent
- 7.6×
Monthly cashflow live
- Estimated rent
- $1,400 medium interval (Pro) →
- Mortgage (P&I)
- −$671
- Tax from tax record
- −$39 /mo · $470/yr
- Insurance
- −$53
- HOA
- −$0
- Vacancy / Maint / Mgmt
- −$294
- Net cashflow
- $342
Break-even live
Sensitivity live
| Price | -10% $415 | -5% $378 | +0% $342 | +5% $306 | +10% $270 |
|---|---|---|---|---|---|
| Rent | -10% $232 | -5% $287 | +0% $342 | +5% $398 | +10% $453 |
| Rate | -1.0pp $407 | -0.5pp $375 | base $342 | +0.5pp $309 | +1.0pp $275 |
UW: 25.0% down · 7.5% · 30yr · 1.5% tax · 5.0% vac · 8.0% maint · 8.0% mgmt
Financing live
Cash to close
- Down payment
- $32,000
- Closing costs
- $3,840
- Reserves months
- —
- Total cash needed
- —
Loan-product check · same deal, 3 products live
Conventional
25% down · 7.5% · 30yr
- Down + closing
- —
- Monthly P&I
- —
- Monthly cashflow
- —
- DSCR
- —
- Eligible?
- —
Personal DTI + credit; lowest rate.
DSCR
20% down · 8.5% · 30yr
- Down + closing
- —
- Monthly P&I
- —
- Monthly cashflow
- —
- DSCR
- —
- Eligible?
- —
No personal income docs; deal must DSCR.
Hard money
10% down · 12.0% · 12mo
- Down + closing
- —
- Monthly P&I
- —
- Monthly cashflow
- —
- DSCR
- —
- Eligible?
- —
Short-term bridge; refi at stabilization.
Rent comps 1 comps
| Address | Beds | Baths | Sqft | Rent | $/sqft | DOM | Units | Dist |
|---|---|---|---|---|---|---|---|---|
| 18 Adger St Pelzer, SC | 3.0 | 1.0 | 1350 | $1,400 | $1.04 | 16d | 1 | 0.12mi |
Listing history 19 events
-
2026-06-21days on market $128,000 Active 37 DOM
-
2026-06-18days on market $128,000 Active 34 DOM
-
2026-06-17days on market $128,000 Active 33 DOM
-
2026-06-16days on market $128,000 Active 32 DOM
-
2026-06-15days on market $128,000 Active 31 DOM
-
2026-06-13days on market $128,000 Active 29 DOM
-
2026-06-10days on market $128,000 Active 26 DOM
-
2026-06-09days on market $128,000 Active 25 DOM
-
2026-06-08days on market $128,000 Active 24 DOM
-
2026-06-07days on market $128,000 Active 23 DOM
-
2026-06-03days on market $128,000 Active 19 DOM
-
2026-06-03days on market $128,000 Active 18 DOM
-
2026-06-01days on market $128,000 Active 17 DOM
-
2026-05-31days on market $128,000 Active 16 DOM
-
2026-05-15$128,000 Active
-
2013-11-13soldstatus $30,000
-
2008-01-30soldstatus $30,000
-
1990-06-04soldstatus $10,517
-
1987-12-29soldstatus $10,000
ⓘ Source: listings_history table (triggers on properties + properties_extension) + one-shot
backfill from property_details.listing_events for pre-trigger history.
Tax reassessment forecast SC · Resets to sale price
- Current annual tax
- $470 · $39/mo
- Projected year-2 tax
- $730 · $61/mo
- Expected delta
- +$259/yr (+$22/mo · 55.1%)
ⓘ Screening estimate from a state-policy table — verify with the county assessor before closing.
Climate risk First Street
- Flood 1/10 Low FEMA zone X (unshaded) · 0% chance over 30 yrs
- Wildfire 4/10 Moderate
- Heat 6/10 Major 7 d/yr ≥106°F today · 17 d/yr by 30 yrs out
- Wind 2/10 Low 100% chance of damaging wind over 30 yrs
- Air quality 4/10 Moderate 3 unhealthy d/yr today · 4 by 30 yrs out
Nearby sold comps map
Loading sold comps map…
Walkable amenities ~0.75 mi
Loading nearby amenities…
Taxation est. · year 1
- Rental income
- $16,800
- − Mortgage interest
- −$7,170
- − Property taxes
- −$470
- − Insurance
- −$640
- − Repairs & maintenance
- −$1,344
- − Management
- −$1,344
- − Depreciation
- −$3,724
- Taxable income
- $2,108
- Est. tax owed @ 24.0%
- −$506
- After-tax cash flow
- $3,601/yr
For passive investors: Depreciation is non-cash, so a rental often shows a tax loss while cash-flowing — sheltering income. Rental losses are passive: they offset passive income freely, and up to $25,000/yr can offset ordinary (W-2) income if you actively participate and your MAGI is under $100k (phasing out to $0 by $150k); unused losses carry forward. On sale, claimed depreciation is recaptured at up to 25%, and gains may owe capital-gains tax (a 1031 exchange can defer both). Figures are a year-1 estimate at your 24.0% rate — not tax advice; consult a CPA.
Schools (NCES district)
- District
- Anderson 01
- NCES district ID
- 4500780
- Math proficiency
- 58% ▼ -6.00%
- Reading proficiency
- 60% ▼ -1.00%
- Median HH income
- $52,196
- Composite
- 50.46/100
- National rank
- #1861
- State rank
- #3 of 80 in SC
Livability — Pelzer
- Score
- 73/100
- State rank
- #42
- US rank
- #5453
Category grades
Schools grade is shown separately in the Schools card above.
Census & demographics
- Census place
- Pelzer, SC
- Population (ZIP)
- 14,712
Population outlook (Anderson County) Hauer SSP2
- Today (2025)
- 210,546 people
- By 2030
- 217,791 · +3.4%
- By 2040
- 230,643 · +9.5%
- By 2050
- 240,220 · +14.1%
- By 2075
- 259,518 · +23.3%
- By 2100
- 258,696 · +22.9%
Race, ethnicity, and origin ACS 2023
- Neighborhood character
- Predominantly White (79%)
- Race & ethnicity
- White 79% Hispanic / Latino 12% Two or more races 10% Black 6%
- Hispanic origin (detail)
- Mexican 8% Puerto Rican 1%
- Common ancestry
- Romanian 4% Serbian 2% Slovak 2%
- Foreign-born
- 3% · Canada
- Languages at home
- 95% English-only · Spanish 3% Arabic 1%
Political lean MEDSL · Anderson
- 2024 margin
- Solid R (+47.4) · D 25.7% · R 73.1% · Other 1.2%
- 2008→2024 swing
- -14.1pp toward R · 2008: -33.3pp · 2024: -47.4pp
- All cycles
- 2024: R+47.4 2020: R+42.0 2016: R+43.7 2012: R+36.4 2008: R+33.3
Not yet ingested
- Civics
- —
Market trends
- HPI YoY
- ▼ -61.21%
- Current HPI
- 261.8165
- Rent YoY
- —
- Metro
- —
- State GDP YoY
- ▲ 4.51%
- F500 in state
- 2
Industry mix (Fortune 500 HQ in SC)
| Industry | F500 HQs | Revenue |
|---|---|---|
| Packaging | 1 | $7B |
|
||
Price history
+1180.0% since first listed5 events — show timeline
- 2026-05-15 Listed $128,000 Greater Greenville MLS
- 2013-11-13 Sold (Public Records) $30,000 Public Records
- 2008-01-30 Sold (Public Records) $30,000 Public Records
- 1990-06-04 Sold (Public Records) $10,517 Public Records
- 1987-12-29 Sold (Public Records) $10,000 Public Records
Property tax history
-10.3%/yrLatest (2025): $470 · -63.7% YoY. Source: county tax records.
Cash-flow waterfall
monthlySold comps — $/sqft
last 12 mo · ≤1 miLoading sold comps…