 Duplex
1020 22 Gordon St · New Orleans, LA
Flood risk No data
- FEMA flood zone
- —
- Chance of flooding over 30 yrs
- —
- Est. flood insurance / yr
- —
Fire risk No data
- Est. fire insurance / yr
- —
Heat risk No data
- Hot days now (above threshold)
- —
- Hot days in 30 yrs
- —
Wind risk No data
- Chance of severe wind over 30 yrs
- —
Air-quality risk No data
- Unhealthy air days now
- —
- Unhealthy air days in 30 yrs
- —
Risk factors via First Street. Map © Google.
Why this score? — see what drove the B grade
The composite is a weighted blend of 9 inputs, each scored 0–100. Each bar is that input's sub-score; the figure is the points it added to the 100-point composite (weight × sub-score).
- Cash flow +30.0/30.0
- 1% rule +10.0/10.0
- DSCR +10.0/10.0
- ARV discount +9.1/15.0
- Livability +4.0/5.0
- Rent growth +3.1/5.0
- Condition / age +2.5/5.0
- Schools +1.6/10.0
- Appreciation +0.0/10.0
$149,000
🖨 Deal sheet 📄 Offer letter ✓ Due diligence
Multi-family units
County records classify this as Multi-Family (2-4 Unit). Listing-text estimate: 2 units. confirmed
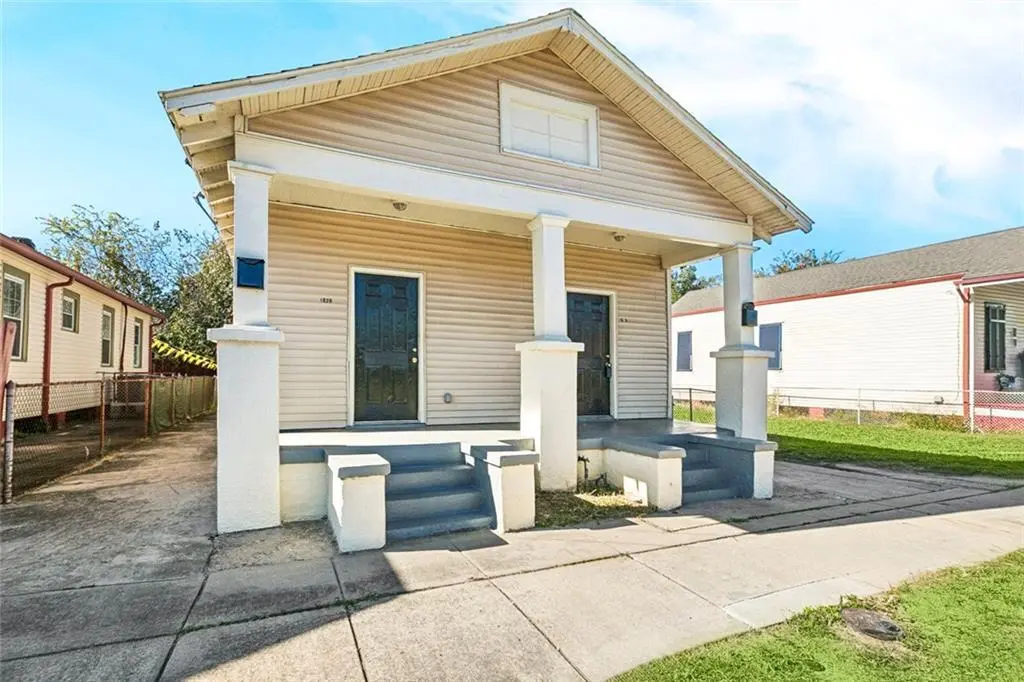
Listing remarks
This well-maintained 4-bed, 2-bath duplex offers identical units on both sides, providing a great opportunity for owner-occupants or investors. Located in the Holy Cross Historic District, this property is just minutes from Bywater, OAB, St. Claude Arts District, and more. The area offers easy access to schools, shopping, and public transportation, while blending historic and cultural charm with modern amenities. With a strong rental demand and proximity to vibrant neighborhoods, this property is perfectly situated for both comfortable living and an excellent investment. Live in one unit and rent the other, or lease both for strong rental income potential.
Key facts
- Strong rental demand
- Parking
- Built 1960
Tags
Neighborhood map
What this means for you Summary
Snapshot
- This is a 2 × 2-bed/1.0-bath units multifamily listed at $149k.
Deal economics
- At list price, monthly cash flow is $936 ($11k/yr) — positive. Per door: $468/mo.
- The deal already cash-flows at list — no discount required.
- Meets the 1% rule at list price ($2k rent vs $149k).
- Cap rate 13.8% vs local median 4.4% in New Orleans — top-decile yield for the area; either an underpriced asset or a hidden risk that comps aren't pricing in. Stress-test before assuming the spread holds.
Location & tenants
- Location reads 81/100 on livability (#3 in LA, #1,383 nationally) — a professional / high-income tenant draw. Strengths: amenities A+, commute A+, health & safety A+; Watch: crime C-, employment D.
- Orleans Parish (urban): math 11% / reading 27% proficiency, ranked #69 of 98 in LA (top 70%) — low school quality limits family demand, transient renter base, plan for 1-2y turnover; 68% free/reduced lunch — lower-income household profile, screen leases tightly.
- Market conditions: Rents rising (+2.5%/yr); 581 active listings in the ZIP; 35 comparable units currently listed for rent nearby; rentals at typical pace (median 17d on market — plan ~3-4 weeks tenant-placement turnaround); 710 units permitted in Orleans Parish in 2024 (244 in 5+ unit buildings).
- At $2,488/mo this rent would consume 65% of the median local household income ($46k/yr) (locally 1988% of renters already pay >50% of income on rent) — very limited rent-growth headroom before tenants either downsize or default.
Forward outlook
- Local home prices are declining (-3.0%/yr); year-one equity from $1k of loan paydown is wiped out by about $4k of value loss. Plan a longer hold.
- Orleans County population projected at +61% by 2050 — long-run rental-demand tailwind backs the buy-and-hold thesis.
- At projected returns (-3.0% appreciation + 2.5% rent growth), your $42k cash investment doubles in ~5 years — after that, you're playing with house money.
Negotiation context
- Only 6 days on market — expect competitive offers; lowballing is unlikely to land.
Questions for the listing agent
- Can we see the unit-by-unit rent roll, current vacancy, and any below-market leases? What's the average tenancy length?
- What capital expenditures (roof, boiler, parking lot, exteriors) have been made in the last 5 years, and what's planned in the next 2?
- Built in 1960 — when were the roof, HVAC, electrical panel, plumbing, and water heater last replaced?
- Is there a deadline driving the sale (1031 exchange, divorce, estate, relocation)? That informs how much negotiation room exists.
- What's the average days-on-market for RENTAL listings here right now (not sales)? A rising rental-DOM trend means longer vacancies and softer asking-rent achievability than the comps imply.
- What's the recent tenant-quality profile in this submarket — average credit score on applications, eviction rate, late-payment / NSF rate, and stable-employment percentage? A property-management company in the area should have these aggregated.
- How much new apartment / multifamily construction is in the pipeline within 1–3 miles? Heavy new supply (>2% of stock underway) typically softens rents 12–24 months out; light construction supports rent growth.
Investment metrics
- 1% rule
- 1.67% ✓
- Cap rate
- 13.83%
- Cash-on-cash
- 26.92%
- DSCR
- 2.20
- GRM
- 5.0
CMA / ARV
- ARV (median comp)
- $154,427
- List price
- $149,000
- Delta
- -1.25%
- Verdict
- FAIR
- Comps
- 20 within 1.0 mi
Projected returns pro-forma
-3.0% appreciation · 2.49% rent growth · sell at horizon
- IRR
- 20.3%
- Equity multiple
- 1.82×
- Total profit
- $34,225
- Equity at exit
- $22,216
- IRR
- 28.1%
- Equity multiple
- 3.43×
- Total profit
- $101,544
- Equity at exit
- $12,883
Cash invested: $41,720 (down + closing). Projections, not guarantees.
Landlord ↔ Tenant lean methodology
- Overall (STATE)
- 90 Strongly Landlord-Friendly
- State Louisiana
- 90 Strongly Landlord-Friendly · R+12
- County
- — inherits STATE
- City
- — inherits STATE
ZIP-level market 70117
- Rents YoY
- 2.5%
- Active inventory
- 581
- Price-to-rent
- 10.0×
Monthly cashflow live
- Estimated rent
- $2,488 high interval (Pro) →
- Mortgage (P&I)
- −$781
- Tax est. 1.5%
- −$186 /mo · $2,235/yr
- Insurance
- −$62
- HOA
- −$0
- Vacancy / Maint / Mgmt
- −$522
- Net cashflow
- $936
Break-even live
2-unit breakdown (identical units grouped — click to expand)
| Units | Beds | Baths | Est. rent |
|---|---|---|---|
| 2× units | 2 | 1 | $2,488 |
| #1 | 2 | 1 | $1,244 |
| #2 | 2 | 1 | $1,244 |
| Total (2 units) | $2,488 | ||
UW: 25.0% down · 7.5% · 30yr · 1.5% tax · 5.0% vac · 8.0% maint · 8.0% mgmt
Financing live
Cash to close
- Down payment
- $37,250
- Closing costs
- $4,470
- Reserves months
- —
- Total cash needed
- —
Loan-product check · same deal, 3 products live
Conventional
25% down · 7.5% · 30yr
- Down + closing
- —
- Monthly P&I
- —
- Monthly cashflow
- —
- DSCR
- —
- Eligible?
- —
Personal DTI + credit; lowest rate.
DSCR
20% down · 8.5% · 30yr
- Down + closing
- —
- Monthly P&I
- —
- Monthly cashflow
- —
- DSCR
- —
- Eligible?
- —
No personal income docs; deal must DSCR.
Hard money
10% down · 12.0% · 12mo
- Down + closing
- —
- Monthly P&I
- —
- Monthly cashflow
- —
- DSCR
- —
- Eligible?
- —
Short-term bridge; refi at stabilization.
Rent comps 35 comps
| Address | Beds | Baths | Sqft | Rent | $/sqft | DOM | Units | Dist |
|---|---|---|---|---|---|---|---|---|
| 5900 N Derbigny St Unit 1 New Orleans, LA | 3.0 | 2.0 | 1000 | $1,950 | $1.95 | 3d | 1 | 0.09mi |
| 1824 Saint Maurice Ave New Orleans, LA | 4.0 | 2.0 | 1500 | $1,500 | $1.00 | 23d | 1 | 0.16mi |
| 1714 Tricou St New Orleans, LA | 3.0 | 2.0 | 1271 | $1,900 | $1.49 | 23d | 1 | 0.16mi |
| 1925 Alabo St Unit A New Orleans, LA | 3.0 | 2.0 | 1199 | $1,500 | $1.25 | 21d | 1 | 0.20mi |
| 1301 Lamanche St New Orleans, LA | 3.0 | 2.0 | 1178 | $1,600 | $1.36 | 23d | 1 | 0.36mi |
| 1301 Lamanche St New Orleans, LA | 3.0 | 2.0 | 1090 | $1,600 | $1.47 | 3d | 1 | 0.36mi |
| 1301 Lamanche St New Orleans, LA | 3.0 | 2.0 | 1090 | $1,600 | $1.47 | 3d | 1 | 0.36mi |
| 1314 Lamanche St New Orleans, LA | 4.0 | 1.0 | 1300 | $2,100 | $1.62 | 16d | 1 | 0.36mi |
| 1201 Gordon St New Orleans, LA | 3.0 | 2.5 | 1367 | $1,900 | $1.39 | 17d | 1 | 0.37mi |
| 1327 Fats Domino Ave Unit B New Orleans, LA | 4.0 | 2.0 | 1200 | $2,200 | $1.83 | 16d | 1 | 0.37mi |
| 1327 Fats Domino Ave Unit A New Orleans, LA | 3.0 | 2.0 | 1200 | $1,900 | $1.58 | 3d | 1 | 0.37mi |
| 1835 Andry St New Orleans, LA | 3.0 | 2.0 | 918 | $1,800 | $1.96 | 23d | 1 | 0.47mi |
| 1333 Angela Ave Arabi, LA | 3.0 | 2.0 | 1090 | $1,850 | $1.70 | 2d | 1 | 0.48mi |
| 5618 N Tonti St New Orleans, LA | 3.0 | 2.0 | 1128 | $1,550 | $1.37 | 23d | 1 | 0.51mi |
| 1422 Andry St New Orleans, LA | 3.0 | 2.0 | 1100 | $1,400 | $1.27 | 3d | 1 | 0.52mi |
| 6038 N Rampart St New Orleans, LA | 3.0 | 2.0 | 1080 | $1,795 | $1.66 | 23d | 1 | 0.54mi |
| 2012 Esteban St Arabi, LA | 3.0 | 2.0 | 1466 | $2,500 | $1.71 | 10d | 1 | 0.56mi |
| 5461 Saint Claude Ave New Orleans, LA | 4.0 | 2.0 | 1250 | $2,350 | $1.88 | 23d | 1 | 0.56mi |
| 5459 Saint Claude Ave Unit 5461 New Orleans, LA | 4.0 | 2.0 | 1454 | $2,350 | $1.62 | 23d | 1 | 0.57mi |
| 18 Saint Claude Ct New Orleans, LA | 3.0 | 1.0 | 864 | $1,200 | $1.39 | 11d | 1 | 0.63mi |
| 2301 Esteban St Arabi, LA | 3.0 | 1.0 | 1102 | $1,800 | $1.63 | 14d | 1 | 0.68mi |
| 906 Flood St New Orleans, LA | 3.0 | 3.0 | 1174 | $1,700 | $1.45 | 2d | 1 | 0.69mi |
| 2539 Fats Domino Ave New Orleans, LA | 3.0 | 2.0 | 1184 | $1,850 | $1.56 | 20d | 1 | 0.72mi |
| 816 Forstall St New Orleans, LA | 3.0 | 1.0 | 850 | $1,600 | $1.88 | 23d | 1 | 0.92mi |
| 617 Forstall St New Orleans, LA | 3.0 | 2.0 | 1262 | $2,200 | $1.74 | 3d | 1 | 1.00mi |
| 619 Reynes St New Orleans, LA | 3.0 | 2.0 | 1318 | $2,100 | $1.59 | 16d | 1 | 1.04mi |
| 438 Friscoville Ave Arabi, LA | 3.0 | 2.0 | 1500 | $3,200 | $2.13 | 2d | 1 | 1.09mi |
| 505 Center St Unit A Arabi, LA | 3.0 | 1.0 | 811 | $1,300 | $1.60 | 43d | 1 | 1.13mi |
| 310 Lynx Dr Arabi, LA | 3.0 | 2.0 | 1050 | $1,775 | $1.69 | 23d | 1 | 1.15mi |
| 4318 N Robertson St New Orleans, LA | 3.0 | 1.0 | 1250 | $1,150 | $0.92 | 3d | 1 | 1.33mi |
| 4318 1/2 N Robertson St New Orleans, LA | 3.0 | 1.0 | 1250 | $1,150 | $0.92 | 3d | 1 | 1.33mi |
| 4317 Urquhart St New Orleans, LA | 3.0 | 2.0 | 1300 | $1,650 | $1.27 | 23d | 1 | 1.35mi |
| 4230 N Claiborne Ave New Orleans, LA | 3.0 | 2.5 | 1296 | $1,750 | $1.35 | 23d | 1 | 1.36mi |
| 4222 N Johnson St New Orleans, LA | 3.0 | 2.0 | 1100 | $1,895 | $1.72 | 23d | 1 | 1.39mi |
| 4217 N Johnson St New Orleans, LA | 3.0 | 2.0 | 904 | $1,650 | $1.83 | 23d | 1 | 1.40mi |
Listing history 7 events
-
2026-06-18days on market $149,000 Active 6 DOM
-
2026-06-17days on market $149,000 Active 5 DOM
-
2026-06-16days on market $149,000 Active 4 DOM
-
2026-06-15days on market $149,000 Active 3 DOM
-
2026-06-13pricestatusdays on market $149,000 Active 1 DOM
-
2025-12-02price $152,500
-
2025-05-07price $154,900
ⓘ Source: listings_history table (triggers on properties + properties_extension) + one-shot
backfill from property_details.listing_events for pre-trigger history.
Nearby sold comps map
Loading sold comps map…
Walkable amenities ~0.75 mi
Loading nearby amenities…
Taxation est. · year 1
- Rental income
- $29,856
- − Mortgage interest
- −$8,346
- − Property taxes
- −$2,235
- − Insurance
- −$745
- − Repairs & maintenance
- −$2,388
- − Management
- −$2,388
- − Depreciation
- −$4,335
- Taxable income
- $9,418
- Est. tax owed @ 24.0%
- −$2,260
- After-tax cash flow
- $8,969/yr
For passive investors: Depreciation is non-cash, so a rental often shows a tax loss while cash-flowing — sheltering income. Rental losses are passive: they offset passive income freely, and up to $25,000/yr can offset ordinary (W-2) income if you actively participate and your MAGI is under $100k (phasing out to $0 by $150k); unused losses carry forward. On sale, claimed depreciation is recaptured at up to 25%, and gains may owe capital-gains tax (a 1031 exchange can defer both). Figures are a year-1 estimate at your 24.0% rate — not tax advice; consult a CPA.
Schools (NCES district)
- District
- Orleans Parish
- NCES district ID
- 2201170
- Math proficiency
- 11% ▼ -52.00%
- Reading proficiency
- 27% ▼ -46.00%
- Median HH income
- $37,011
- Composite
- 15.78/100
- National rank
- #9271
- State rank
- #69 of 98 in LA
Livability — New Orleans
- Score
- 81/100
- State rank
- #3
- US rank
- #1383
Category grades
Schools grade is shown separately in the Schools card above.
Census & demographics
- Census place
- New Orleans, LA
- County
- Orleans Parish · 338,817 people
- City population
- 338,817
- Metro
- New Orleans-Metairie, LA
- Population (ZIP)
- 25,652
- Household income
- $45,764
- Rent vs Own
- Severe rent burden
- 1988.0
Population outlook (Orleans County) Hauer SSP2
- Today (2025)
- 513,025 people
- By 2030
- 575,781 · +12.2%
- By 2040
- 700,174 · +36.5%
- By 2050
- 826,541 · +61.1%
- By 2075
- 1,123,374 · +119.0%
- By 2100
- 1,355,609 · +164.2%
Race, ethnicity, and origin ACS 2023
- Neighborhood character
- Majority Black (60%)
- Race & ethnicity
- Black 60% White 30% Two or more races 6% Hispanic / Latino 5%
- Common ancestry
- Lithuanian 5% Italian 1% Romanian 1%
- Foreign-born
- 5% · Canada, South Korea
- Languages at home
- 93% English-only · Spanish 3% Other Indo-European 1% French/Haitian/Cajun 1%
Political lean MEDSL · Orleans
- 2024 margin
- Solid D (+67.0) · D 82.2% · R 15.2% · Other 2.7%
- 2008→2024 swing
- +6.7pp toward D · 2008: 60.3pp · 2024: 67.0pp
- All cycles
- 2024: D+67.0 2020: D+68.2 2016: D+66.2 2012: D+62.5 2008: D+60.3
Not yet ingested
- Civics
- —
Market trends
- HPI YoY
- ▼ -177.22%
- Current HPI
- 184.6061
- Rent YoY
- ▲ 2.49%
- Metro
- New Orleans-Metairie, LA
- State GDP YoY
- ▲ 3.29%
- F500 in state
- 10
Industry mix (Fortune 500 HQ in LA)
| Industry | F500 HQs | Revenue |
|---|---|---|
| Telecommunications | 2 | $23B |
|
||
| Utilities | 1 | $12B |
|
||
| Wholesale / Distribution | 1 | $5B |
|
||
| Advertising | 1 | $2B |
|
||
Price history
-1.5% since first listed2 events — show timeline
- 2025-12-02 Price Changed $152,500 GSREIN
- 2025-05-07 Price Changed $154,900 GSREIN
Cash-flow waterfall
monthlySold comps — $/sqft
last 12 mo · ≤1 miLoading sold comps…