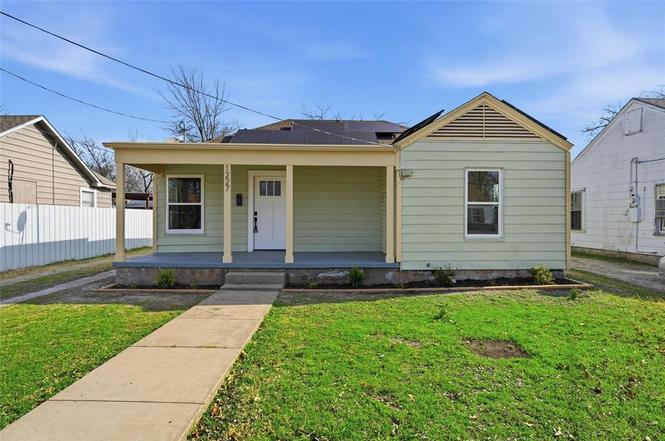
1227 La Vega St · Bellmead, TX
Flood risk 1/10 · Minimal
- FEMA flood zone
- X (unshaded)
- Chance of flooding over 30 yrs
- 0.0%
- Est. flood insurance / yr
- $507 – $1,088
Fire risk 4/10 · Minor
- Est. fire insurance / yr
- $1,222 – $2,270
Heat risk 7/10 · Major
- Hot days now (above 109°F)
- 7 days/yr
- Hot days in 30 yrs
- 24 days/yr
Wind risk 6/10 · Moderate
- Chance of severe wind over 30 yrs
- 63.0%
Air-quality risk 2/10 · Minimal
- Unhealthy air days now
- 0 days/yr
- Unhealthy air days in 30 yrs
- 1 days/yr
Risk factors via First Street. Map © Google.
Why this score? — see what drove the F grade
The composite is a weighted blend of 9 inputs, each scored 0–100. Each bar is that input's sub-score; the figure is the points it added to the 100-point composite (weight × sub-score).
- Cash flow +9.5/30.0
- ARV discount +4.1/15.0
- Livability +3.2/5.0
- Rent growth +3.1/5.0
- 1% rule +2.9/10.0
- DSCR +2.7/10.0
- Condition / age +2.5/5.0
- Schools +2.3/10.0
- Appreciation +0.0/10.0
$159,900
🖨 Deal sheet (PDF) 📄 Offer letter ✓ Due diligence
Listing remarks
Welcome to this beautifully remodeled 3-bedroom, 1-bath home offering comfort, convenience, and value all in one! Centrally located just 5 minutes from major grocery centers and popular local dining options, and only minutes from Interstate 35, this home provides easy access for commuters while keeping everyday essentials close at hand. Step inside to discover a bright, open-concept layout filled with natural light and thoughtfully updated finishes throughout. The spacious living areas flow seamlessly into the kitchen and dining spaces, creating the perfect setting for both relaxing and entertaining. Each bedroom offers generous proportions, making it ideal for families, roommates, or a ho
Key facts
- Remodeled
- Updated finishes
- Natural light
Tags
Neighborhood map
What this means for you Summary
Snapshot
- This is a 2-bed/1.0-bath single-family listed at $160k.
Deal economics
- At list price, monthly cash flow is $-113 ($-1k/yr) — negative.
- To cash-flow at today's rent, offer at most $140k (12.4% below list).
- To meet the 1% rule (rent ≥ 1% of price), the offer needs to be $126k (21.5% below list).
- Recommended offer: $126k (21.5% below list) — sets the bar for 1% rule.
Location & tenants
- Location reads 63/100 on livability (#893 in TX) — a middle-class / working-renter tenant base. Strengths: cost of living A+, housing A+; Watch: employment D+, crime F, amenities F.
- La Vega ISD (suburban): math 24% / reading 32% proficiency, ranked #680 of 826 in TX (top 82%) — low school quality limits family demand, transient renter base, plan for 1-2y turnover; 79% free/reduced lunch — lower-income household profile, screen leases tightly.
- Zoned schools: La Vega El (math 14% / reading 31%, grade F, #3,311 of 4,322 statewide, top 77%, 659 students, 94% FRL) — zoned schools average 94% FRL vs 79% district-wide (15 pts higher); higher-poverty schools than district average — tighter screening recommended.
- Market conditions: Rents rising (+2.2%/yr); 297 active listings in the ZIP; 6 comparable units currently listed for rent nearby; rentals at typical pace (median 22d on market — plan ~3-4 weeks tenant-placement turnaround); 1,014 units permitted in McLennan County in 2024 (200 in 5+ unit buildings).
Forward outlook
- Local home prices are declining (-3.0%/yr); year-one equity from $1k of loan paydown is wiped out by about $5k of value loss. Plan a longer hold.
- McLennan County population projected at +17% by 2050 — long-run rental-demand tailwind backs the buy-and-hold thesis.
Negotiation context
- Only 9 days on market — expect competitive offers; lowballing is unlikely to land.
- 2 sale attempts with the ask held roughly flat each time — persistent listings suggest the price (not the market) is what's stuck; bring a comps-based counter.
Risks & watch-outs
- Watch-outs: built in 1942 — expect roof / HVAC / electrical / plumbing capex.
- Climate carrying-cost: major wind risk, 63% chance of damaging wind over 30y; extreme-heat days projected 7→24/yr by 2055 (HVAC capex compounding) — expect insurance premiums to compound above CPI over the hold.
Questions for the listing agent
- What do current leases actually rent for vs. the listed asking? Can we see a recent rent roll and the last 12 months of T-12 income?
- Built in 1942 — when were the roof, HVAC, electrical panel, plumbing, and water heater last replaced?
- Is there a deadline driving the sale (1031 exchange, divorce, estate, relocation)? That informs how much negotiation room exists.
- Schools are F-rated, which usually means shorter tenancies and higher turnover. Who's the typical renter profile here, and what's been the actual vacancy rate?
- Crime grade is F in this area — have there been break-ins, vandalism, or insurance claims at this property in the last 3 years? What carrier currently insures it and at what premium?
- The area grade is low — what's the realistic commute time and amenity access for the typical tenant pool here? Any planned neighborhood developments (good or bad) we should know about?
- What's the average days-on-market for RENTAL listings here right now (not sales)? A rising rental-DOM trend means longer vacancies and softer asking-rent achievability than the comps imply.
- What's the recent tenant-quality profile in this submarket — average credit score on applications, eviction rate, late-payment / NSF rate, and stable-employment percentage? A property-management company in the area should have these aggregated.
- How much new for-sale + rental construction is in the pipeline within 1–3 miles? Heavy new supply typically softens prices + rents 12–24 months out; constrained supply supports both.
Investment metrics
- 1% rule
- 0.79% ✗
- Cap rate
- 5.45%
- Cash-on-cash
- -3.02%
- DSCR
- 0.87
- GRM
- 10.6
CMA / ARV
- ARV (on-the-fly)
- $148,575
- Comps found
- 9
Show comp detail 9 sales within ~0.75 mi
| Address | Dist | Beds/Ba | Sqft | Sold | Price | $/sf | Match |
|---|---|---|---|---|---|---|---|
| 3602 Latimer St | 0.40mi | 2/1.0 | 875 (+3%) | 1mo | $139,000 | $159 | 75 |
| 1224 Ashleman St | 0.15mi | 2/1.0 | 768 (-10%) | 2mo | $145,000 | $189 | 75 |
| 1122 Lewis St | 0.20mi | 1/1.0 (-1) | 830 (-2%) | 22mo | $145,000 | $175 | 63 |
| 3602 Parrish St | 0.16mi | 2/1.0 | 920 (+8%) | 21mo | $177,000 | $192 | 61 |
| 3634 Redbird St | 0.24mi | 2/1.0 | 952 (+12%) | 11mo | $194,900 | $205 | 59 |
| 1111 Gilliam St | 0.31mi | 2/1.0 | 915 (+8%) | 24mo | $169,900 | $186 | 52 |
| 607 La Clede St | 0.74mi | 2/1.0 | 960 (+13%) | 2mo | $104,900 | $109 | 42 |
| 1111 Campbelton St | 0.70mi | 2/1.0 | 912 (+7%) | 20mo | $92,000 | $101 | 38 |
| 2207 Behrens Cir | 0.73mi | 1/1.0 (-1) | 780 (-8%) | 13mo | $74,900 | $96 | 36 |
Match score weights: distance 35% · size 25% · config 20% · recency 20%. Top-matched comps best support the ARV.
Projected returns pro-forma
-3.0% appreciation · 2.2% rent growth · sell at horizon
- IRR
- -22.2%
- Equity multiple
- 0.24×
- Total profit
- $-34,064
- Equity at exit
- $23,842
- IRR
- -18.3%
- Equity multiple
- 0.04×
- Total profit
- $-42,868
- Equity at exit
- $13,825
Cash invested: $44,772 (down + closing). Projections, not guarantees.
Landlord ↔ Tenant lean methodology
- Overall (STATE)
- 87 Strongly Landlord-Friendly
- State Texas
- 87 Strongly Landlord-Friendly · R+5
- County
- — inherits STATE
- City
- — inherits STATE
ZIP-level market 76705
- Home prices YoY
- -29.6%
- Rents YoY
- 2.2%
- Active inventory
- 297
- Price-to-rent
- 10.6×
Monthly cashflow live
- Estimated rent
- $1,256 high interval (Pro) →
- Mortgage (P&I)
- −$839
- Tax from tax record
- −$200 /mo · $2,395/yr
- Insurance
- −$67
- HOA
- −$0
- Vacancy / Maint / Mgmt
- −$264
- Net cashflow
- $-113
Break-even live
Sensitivity live
| Price | -10% $-22 | -5% $-67 | +0% $-113 | +5% $-158 | +10% $-203 |
|---|---|---|---|---|---|
| Rent | -10% $-212 | -5% $-162 | +0% $-113 | +5% $-63 | +10% $-13 |
| Rate | -1.0pp $-32 | -0.5pp $-72 | base $-113 | +0.5pp $-154 | +1.0pp $-196 |
UW: 25.0% down · 7.5% · 30yr · 1.5% tax · 5.0% vac · 8.0% maint · 8.0% mgmt
Financing live
Cash to close
- Down payment
- $39,975
- Closing costs
- $4,797
- Reserves months
- —
- Total cash needed
- —
Loan-product check · same deal, 3 products live
Conventional
25% down · 7.5% · 30yr
- Down + closing
- —
- Monthly P&I
- —
- Monthly cashflow
- —
- DSCR
- —
- Eligible?
- —
Personal DTI + credit; lowest rate.
DSCR
20% down · 8.5% · 30yr
- Down + closing
- —
- Monthly P&I
- —
- Monthly cashflow
- —
- DSCR
- —
- Eligible?
- —
No personal income docs; deal must DSCR.
Hard money
10% down · 12.0% · 12mo
- Down + closing
- —
- Monthly P&I
- —
- Monthly cashflow
- —
- DSCR
- —
- Eligible?
- —
Short-term bridge; refi at stabilization.
Rent comps 6 comps
| Address | Beds | Baths | Sqft | Rent | $/sqft | DOM | Units | Dist |
|---|---|---|---|---|---|---|---|---|
| 1130 Lewis St Waco, TX | 2.0 | 2.0 | 1092 | $1,450 | $1.33 | 21d | 1 | 0.18mi |
| 3600 Scroggins Dr Waco, TX | 1.0 | 1.0 | 681 | $920 | $1.35 | 44d | 4 | 0.25mi |
| 1403 Strickland St Waco, TX | 3.0 | 2.0 | 1000 | $1,399 | $1.40 | 21d | 1 | 0.78mi |
| 3500 Meyers Ln Waco, TX | 1.0–2.0 | 1.0–2.0 | 684 | $1,125 | $1.64 | 14d | 1 | 1.12mi |
| 4245 Meyers Ln Waco, TX | 2.0 | 1.0 | 772 | $1,175 | $1.52 | 21d | 1 | 1.31mi |
| 4245 Meyers Ln Waco, TX | 2.0 | 2.0 | 772 | $1,745 | $2.26 | 14d | 1 | 1.31mi |
Listing history 5 events
-
2026-03-26status Pending
-
2026-03-26status Active
-
2026-03-01status Pending
-
2026-02-19$159,900 Active
-
2001-06-28soldstatus
ⓘ Source: listings_history table (triggers on properties + properties_extension) + one-shot
backfill from property_details.listing_events for pre-trigger history.
Tax reassessment forecast TX · Resets to sale price
- Current annual tax
- $2,395 · $200/mo
- Projected year-2 tax
- $2,926 · $244/mo
- Expected delta
- +$531/yr (+$44/mo · 22.2%)
ⓘ Screening estimate from a state-policy table — verify with the county assessor before closing.
Climate risk First Street
- Flood 1/10 Low FEMA zone X (unshaded) · 0% chance over 30 yrs
- Wildfire 4/10 Moderate
- Heat 7/10 Severe 7 d/yr ≥109°F today · 24 d/yr by 30 yrs out
- Wind 6/10 Major 63% chance of damaging wind over 30 yrs
- Air quality 2/10 Low 0 unhealthy d/yr today · 1 by 30 yrs out
Nearby sold comps map
Loading sold comps map…
Walkable amenities ~0.75 mi
Loading nearby amenities…
Taxation est. · year 1
- Rental income
- $15,071
- − Mortgage interest
- −$8,957
- − Property taxes
- −$2,395
- − Insurance
- −$800
- − Repairs & maintenance
- −$1,206
- − Management
- −$1,206
- − Depreciation
- −$4,652
- Taxable loss
- −$4,143
- Est. tax savings @ 24.0%
- +$994
- After-tax cash flow
- $-356/yr
For passive investors: Depreciation is non-cash, so a rental often shows a tax loss while cash-flowing — sheltering income. Rental losses are passive: they offset passive income freely, and up to $25,000/yr can offset ordinary (W-2) income if you actively participate and your MAGI is under $100k (phasing out to $0 by $150k); unused losses carry forward. On sale, claimed depreciation is recaptured at up to 25%, and gains may owe capital-gains tax (a 1031 exchange can defer both). Figures are a year-1 estimate at your 24.0% rate — not tax advice; consult a CPA.
Schools (NCES district)
- District
- La Vega ISD
- NCES district ID
- 4826280
- Math proficiency
- 24% ▼ -13.00%
- Reading proficiency
- 32% ▼ -4.00%
- Median HH income
- $38,539
- Composite
- 23.42/100
- National rank
- #7892
- State rank
- #680 of 826 in TX
Livability — Bellmead
- Score
- 63/100
- State rank
- #893
- US rank
- #16031
Category grades
Schools grade is shown separately in the Schools card above.
Census & demographics
- Census place
- Bellmead, TX
- County
- McLennan County · 213,088 people
- City population
- 31,750
- Metro
- Waco, TX
- Population (ZIP)
- 31,616
- Household income
- $58,236
- Rent vs Own
- Severe rent burden
- 668.0
Population outlook (McLennan County) Hauer SSP2
- Today (2025)
- 264,191 people
- By 2030
- 273,578 · +3.6%
- By 2040
- 291,506 · +10.3%
- By 2050
- 308,044 · +16.6%
- By 2075
- 349,648 · +32.3%
- By 2100
- 364,779 · +38.1%
Race, ethnicity, and origin ACS 2023
- Neighborhood character
- Diverse neighborhood (Simpson 0.68)
- Race & ethnicity
- White 43% Hispanic / Latino 32% Two or more races 20% Black 18% Native American 1% Asian 1%
- Hispanic origin (detail)
- Mexican 31%
- Common ancestry
- Slovak 2% Lithuanian 1% Serbian 1%
- Foreign-born
- 13% · Canada, Vietnam
- Languages at home
- 73% English-only · Spanish 24% Other Indo-European 1% German/W. Germanic 1%
Political lean MEDSL · McLennan
- 2024 margin
- Solid R (+30.9) · D 34.0% · R 64.9% · Other 1.0%
- 2008→2024 swing
- -7.0pp toward R · 2008: -23.9pp · 2024: -30.9pp
- All cycles
- 2024: R+30.9 2020: R+23.4 2016: R+27.1 2012: R+29.8 2008: R+23.9
Not yet ingested
- Civics
- —
Market trends
- HPI YoY
- ▼ -91.45%
- Current HPI
- 217.9429
- Rent YoY
- ▲ 2.20%
- Metro
- Waco, TX
- State GDP YoY
- ▲ 3.95%
- F500 in state
- 110
Industry mix (Fortune 500 HQ in TX)
| Industry | F500 HQs | Revenue |
|---|---|---|
| Energy | 16 | $1,198B |
|
||
| Technology | 5 | $198B |
|
||
| Engineering / Construction | 4 | $72B |
|
||
| Energy Services | 3 | $60B |
|
||
| Utilities | 3 | $41B |
|
||
| Healthcare | 2 | $330B |
|
||
Price history
5 events — show timeline
- 2026-03-26 Pending — NTREIS
- 2026-03-26 Relisted — NTREIS
- 2026-03-01 Pending — NTREIS
- 2026-02-19 Listed $159,900 NTREIS
- 2001-06-28 Sold (Public Records) — Public Records
Property tax history
+13.2%/yrLatest (2025): $2,395 · +12.9% YoY. Source: county tax records.
Cash-flow waterfall
monthlySold comps — $/sqft
last 12 mo · ≤1 miLoading sold comps…