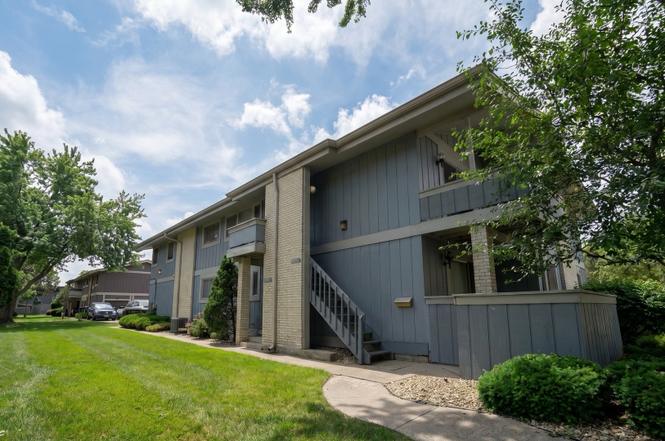
20125 Woodale St #0 · Lynwood, IL
Flood risk 4/10 · Minor
- FEMA flood zone
- X (unshaded)
- Chance of flooding over 30 yrs
- 0.21%
- Est. flood insurance / yr
- $507 – $1,088
Fire risk 3/10 · Minor
- Est. fire insurance / yr
- $804 – $1,492
Heat risk 3/10 · Minor
- Hot days now (above 102°F)
- 7 days/yr
- Hot days in 30 yrs
- 15 days/yr
Wind risk 2/10 · Minimal
- Chance of severe wind over 30 yrs
- 0.0%
Air-quality risk 2/10 · Minimal
- Unhealthy air days now
- 2 days/yr
- Unhealthy air days in 30 yrs
- 2 days/yr
Risk factors via First Street. Map © Google.
Why this score? — see what drove the C+ grade
The composite is a weighted blend of 9 inputs, each scored 0–100. Each bar is that input's sub-score; the figure is the points it added to the 100-point composite (weight × sub-score).
- Cash flow +27.2/30.0
- DSCR +9.4/10.0
- 1% rule +7.8/10.0
- ARV discount +7.5/15.0
- Rent growth +4.1/5.0
- Livability +3.2/5.0
- Condition / age +2.5/5.0
- Schools +1.0/10.0
- Appreciation +0.0/10.0
$149,900
🖨 Deal sheet 📄 Offer letter ✓ Due diligence
Listing remarks MLS
This spacious 2-bedroom, 1-bath condo offers great potential with a functional layout and solid features throughout. The unit includes a large living/dining room combo, galley-style kitchen, in-unit washer and dryer, central air, and an attached 1-car garage. Property being sold AS-IS.
Key facts
- New kitchen
- Updated throughout
- Remodeled bathroom
Tags
Property features AI
Finance
- Other: Five units in the building; Living area source: Landlord/Tenant/Seller; Directions: Torrence to 201st, then right on Woodale — property will be on the left
- Financial info: Special service area: No
- HOA & community: Monthly association fee of $182; Association fee includes lawn care, trash (scavenger) and snow removal; Manager off-site; Pets allowed (cats and dogs), max pet weight 99 lbs
Exterior
- Parking: Attached garage with garage door opener (1 garage space, 1 total parking space)
- Utilities: Public water; Public sewer; Electric with circuit breakers
- Home design: Attached single (condo); Entry level: 2; Condo ownership; Two-story layout
- Construction: Cedar construction; Asphalt roof; Property rehabilitated in 2026; Built 41–50 years ago; Built before 1978
- Exterior features: Condo setting; School bus service available
Interior
- Kitchen: Kitchen with island; Range; Microwave; Dishwasher; Refrigerator; Ceramic tile flooring in kitchen
- Bedrooms: Two bedrooms total; Master bedroom located on the second level (16 x 11); Second bedroom on main level (11 x 10)
- Flooring: Luxury vinyl flooring in dining area and living room; Carpet in master bedroom; Ceramic tile in kitchen
- Bathrooms: One full bathroom
- Heating & cooling: Natural gas heating; Central air conditioning
- Interior features: Six total rooms; Dining area combined with living room; Energy Star qualified windows in kitchen and living areas; Blinds and window screens in living room
- Laundry & utility: In-unit laundry (laundry room on main level, 12 x 8)
Neighborhood map
What this means for you Summary
Snapshot
- This is a 2-bed/1.0-bath condo listed at $150k.
Deal economics
- At list price, monthly cash flow is $428 ($5k/yr) — positive.
- The deal already cash-flows at list — no discount required.
- Meets the 1% rule at list price ($2k rent vs $150k).
- Cap rate 9.7% vs local median 3.5% in Lynwood — top-decile yield for the area; either an underpriced asset or a hidden risk that comps aren't pricing in. Stress-test before assuming the spread holds.
Location & tenants
- Location reads 65/100 on livability (#635 in IL) — a middle-class / working-renter tenant base. Strengths: cost of living A+, housing A+, employment A; Watch: schools F, amenities F, commute F.
- Thornton Fractional Twp Hsd 215 (suburban): math 9% / reading 13% proficiency, ranked #563 of 620 in IL (top 91%) — low school quality limits family demand, transient renter base, plan for 1-2y turnover.
- Market conditions: Rents rising fast (+6.5%/yr); 222 active listings in the ZIP; 3 comparable units currently listed for rent nearby; rentals leasing fast (median 1d on market — plan ~1-2 weeks tenant-placement turnaround); 6,272 units permitted in Cook County in 2024 (4,658 in 5+ unit buildings).
- This rent runs 37% of the median local income ($62k/yr) — at the standard rent-burdened threshold; future hikes will face affordability resistance.
Forward outlook
- Local home prices are declining (-3.0%/yr); year-one equity from $1k of loan paydown is wiped out by about $4k of value loss. Plan a longer hold.
- At projected returns (-3.0% appreciation + 6.5% rent growth), your $42k cash investment doubles in ~8 years — after that, you're playing with house money.
Negotiation context
- Only 2 days on market — expect competitive offers; lowballing is unlikely to land.
- 2 sale attempts with the ask held roughly flat each time — persistent listings suggest the price (not the market) is what's stuck; bring a comps-based counter.
- Current owner paid $68k; list at $150k implies a 120% gain — meaningful room to come down on a strong offer.
Questions for the listing agent
- What does the HOA fee cover, when was the last increase, and are there any pending special assessments or reserve-fund shortfalls?
- Any open or pending special assessments — roof, HVAC, plumbing, elevator, façade? What's the per-unit balance and payoff schedule, and is the seller paying it off at close or rolling it to the buyer?
- Is there a deadline driving the sale (1031 exchange, divorce, estate, relocation)? That informs how much negotiation room exists.
- Schools are F-rated, which usually means shorter tenancies and higher turnover. Who's the typical renter profile here, and what's been the actual vacancy rate?
- What's the average days-on-market for RENTAL listings here right now (not sales)? A rising rental-DOM trend means longer vacancies and softer asking-rent achievability than the comps imply.
- What's the recent tenant-quality profile in this submarket — average credit score on applications, eviction rate, late-payment / NSF rate, and stable-employment percentage? A property-management company in the area should have these aggregated.
- How much new apartment / multifamily construction is in the pipeline within 1–3 miles? Heavy new supply (>2% of stock underway) typically softens rents 12–24 months out; light construction supports rent growth.
Investment metrics
- 1% rule
- 1.28% ✓
- Cap rate
- 9.72%
- Cash-on-cash
- 12.23%
- DSCR
- 1.54
- GRM
- 6.5
CMA / ARV
No comps found within radius.
Projected returns pro-forma
-3.0% appreciation · 6.48% rent growth · sell at horizon
- IRR
- 5.9%
- Equity multiple
- 1.24×
- Total profit
- $9,978
- Equity at exit
- $22,351
- IRR
- 18.3%
- Equity multiple
- 2.78×
- Total profit
- $74,680
- Equity at exit
- $12,961
Cash invested: $41,972 (down + closing). Projections, not guarantees.
Landlord ↔ Tenant lean methodology
- Overall (STATE)
- 43 Moderately Tenant-Leaning
- State Illinois
- 43 Moderately Tenant-Leaning · D+7
- County
- — inherits STATE
- City
- — inherits STATE
ZIP-level market 60411
- Home prices YoY
- -33.9%
- Rents YoY
- 6.5%
- Active inventory
- 222
- Price-to-rent
- 6.5×
Monthly cashflow live
- Estimated rent
- $1,919 medium interval (Pro) →
- Mortgage (P&I)
- −$786
- Tax from tax record
- −$57 /mo · $688/yr
- Insurance
- −$62
- HOA
- −$182
- Vacancy / Maint / Mgmt
- −$403
- Net cashflow
- $428
Break-even live
UW: 25.0% down · 7.5% · 30yr · 1.5% tax · 5.0% vac · 8.0% maint · 8.0% mgmt
Financing live
Cash to close
- Down payment
- $37,475
- Closing costs
- $4,497
- Reserves months
- —
- Total cash needed
- —
Loan-product check · same deal, 3 products live
Conventional
25% down · 7.5% · 30yr
- Down + closing
- —
- Monthly P&I
- —
- Monthly cashflow
- —
- DSCR
- —
- Eligible?
- —
Personal DTI + credit; lowest rate.
DSCR
20% down · 8.5% · 30yr
- Down + closing
- —
- Monthly P&I
- —
- Monthly cashflow
- —
- DSCR
- —
- Eligible?
- —
No personal income docs; deal must DSCR.
Hard money
10% down · 12.0% · 12mo
- Down + closing
- —
- Monthly P&I
- —
- Monthly cashflow
- —
- DSCR
- —
- Eligible?
- —
Short-term bridge; refi at stabilization.
Rent comps 3 comps
| Address | Beds | Baths | Sqft | Rent | $/sqft | DOM | Units | Dist |
|---|---|---|---|---|---|---|---|---|
| 20104 Willow Dr Lynwood, IL | 2.0 | 1.0 | 1000 | $1,600 | $1.60 | 17d | 1 | 0.05mi |
| 20067 Orchard Ave Lynwood, IL | 3.0 | 1.0 | 1084 | $2,200 | $2.03 | 1d | 1 | 0.13mi |
| 20078 Monterey Ave Lynwood, IL | 3.0 | 2.0 | 1128 | $2,850 | $2.53 | 1d | 1 | 0.19mi |
HOA detail condo
- Monthly dues
- $182 · $2,184/yr
- Assessments
- None detected in remarks — confirm with the listing agent.
Listing history 3 events
-
2026-06-18days on market $149,900 Active 2 DOM
-
2026-06-17remarks 699-char remark
-
2026-06-17$149,900 Active 1 DOM
ⓘ Source: listings_history table (triggers on properties + properties_extension) + one-shot
backfill from property_details.listing_events for pre-trigger history.
Tax reassessment forecast IL · Partial reset (capped growth)
- Current annual tax
- $688 · $57/mo
- Projected year-2 tax
- $2,045 · $170/mo
- Expected delta
- +$1,357/yr (+$113/mo · 197.3%)
ⓘ Screening estimate from a state-policy table — verify with the county assessor before closing.
Climate risk First Street
- Flood 4/10 Moderate FEMA zone X (unshaded) · 21% chance over 30 yrs
- Wildfire 3/10 Moderate
- Heat 3/10 Moderate 7 d/yr ≥102°F today · 15 d/yr by 30 yrs out
- Wind 2/10 Low 0% chance of damaging wind over 30 yrs
- Air quality 2/10 Low 2 unhealthy d/yr today · 2 by 30 yrs out
Nearby sold comps map
Loading sold comps map…
Walkable amenities ~0.75 mi
Loading nearby amenities…
Taxation est. · year 1
- Rental income
- $23,025
- − Mortgage interest
- −$8,397
- − Property taxes
- −$688
- − Insurance
- −$750
- − Repairs & maintenance
- −$1,842
- − Management
- −$1,842
- − HOA
- −$2,184
- − Depreciation
- −$4,361
- Taxable income
- $2,962
- Est. tax owed @ 24.0%
- −$711
- After-tax cash flow
- $4,424/yr
For passive investors: Depreciation is non-cash, so a rental often shows a tax loss while cash-flowing — sheltering income. Rental losses are passive: they offset passive income freely, and up to $25,000/yr can offset ordinary (W-2) income if you actively participate and your MAGI is under $100k (phasing out to $0 by $150k); unused losses carry forward. On sale, claimed depreciation is recaptured at up to 25%, and gains may owe capital-gains tax (a 1031 exchange can defer both). Figures are a year-1 estimate at your 24.0% rate — not tax advice; consult a CPA.
Schools (NCES district)
- District
- Thornton Fractional Twp Hsd 215
- NCES district ID
- 1738940
- Math proficiency
- 9% ▼ -3.00%
- Reading proficiency
- 13% ▼ -3.00%
- Median HH income
- $48,207
- Composite
- 10.27/100
- National rank
- #9793
- State rank
- #563 of 620 in IL
Livability — Lynwood
- Score
- 65/100
- State rank
- #635
- US rank
- #12997
Category grades
Schools grade is shown separately in the Schools card above.
Census & demographics
- Census place
- Lynwood, IL
- County
- Cook County · 4,486,803 people
- City population
- 52,175
- Metro
- Chicago-Naperville-Elgin, IL-IN-WI
- Population (ZIP)
- 52,175
- Household income
- $62,073
- Rent vs Own
- Severe rent burden
- 1714.0
Population outlook (Cook County) Hauer SSP2
- Today (2025)
- 5,347,519 people
- By 2030
- 5,357,703 · +0.2%
- By 2040
- 5,324,924 · -0.4%
- By 2050
- 5,230,762 · -2.2%
- By 2075
- 4,785,735 · -10.5%
- By 2100
- 4,188,836 · -21.7%
Race, ethnicity, and origin ACS 2023
- Neighborhood character
- Diverse neighborhood (Simpson 0.66)
- Race & ethnicity
- Black 49% Hispanic / Latino 26% White 19% Two or more races 11%
- Hispanic origin (detail)
- Mexican 22% Puerto Rican 2%
- Common ancestry
- Romanian 4% Portuguese 1% Lithuanian 1%
- Foreign-born
- 12% · Canada
- Languages at home
- 76% English-only · Spanish 21% Russian/Polish/Slavic 1% Other Indo-European 1%
Political lean MEDSL · Cook
- 2024 margin
- Solid D (+42.0) · D 70.4% · R 28.4% · Other 1.2%
- 2008→2024 swing
- -11.4pp toward R · 2008: 53.4pp · 2024: 42.0pp
- All cycles
- 2024: D+42.0 2020: D+50.3 2016: D+53.0 2012: D+49.4 2008: D+53.4
Not yet ingested
- Civics
- —
Market trends
- HPI YoY
- ▼ -108.75%
- Current HPI
- 212.4058
- Rent YoY
- ▲ 6.48%
- Metro
- Chicago-Naperville-Elgin, IL-IN-WI
- State GDP YoY
- ▲ 1.59%
- F500 in state
- 60
Industry mix (Fortune 500 HQ in IL)
| Industry | F500 HQs | Revenue |
|---|---|---|
| Insurance | 4 | $201B |
|
||
| Consumer Goods | 4 | $87B |
|
||
| Industrial Machinery | 3 | $64B |
|
||
| Healthcare | 2 | $55B |
|
||
| Retail / Pharmacy | 1 | $148B |
|
||
| Agriculture / Food | 1 | $86B |
|
||
Price history
+79.5% since first listed6 events — show timeline
- 2026-06-16 Listed $149,900 MRED as Distributed by MLS Grid
- 2026-03-11 Sold (Public Records) $68,000 Public Records
- 2026-02-02 Sold (MLS) $68,000 MRED as Distributed by MLS Grid
- 2026-01-19 Contingent — MRED as Distributed by MLS Grid
- 2026-01-07 Price Changed $75,500 MRED as Distributed by MLS Grid
- 2025-11-13 Listed $83,500 MRED as Distributed by MLS Grid
Property tax history
-4.3%/yrLatest (2023): $688 · +738.0% YoY. Source: county tax records.
Cash-flow waterfall
monthlySold comps — $/sqft
last 12 mo · ≤1 miLoading sold comps…