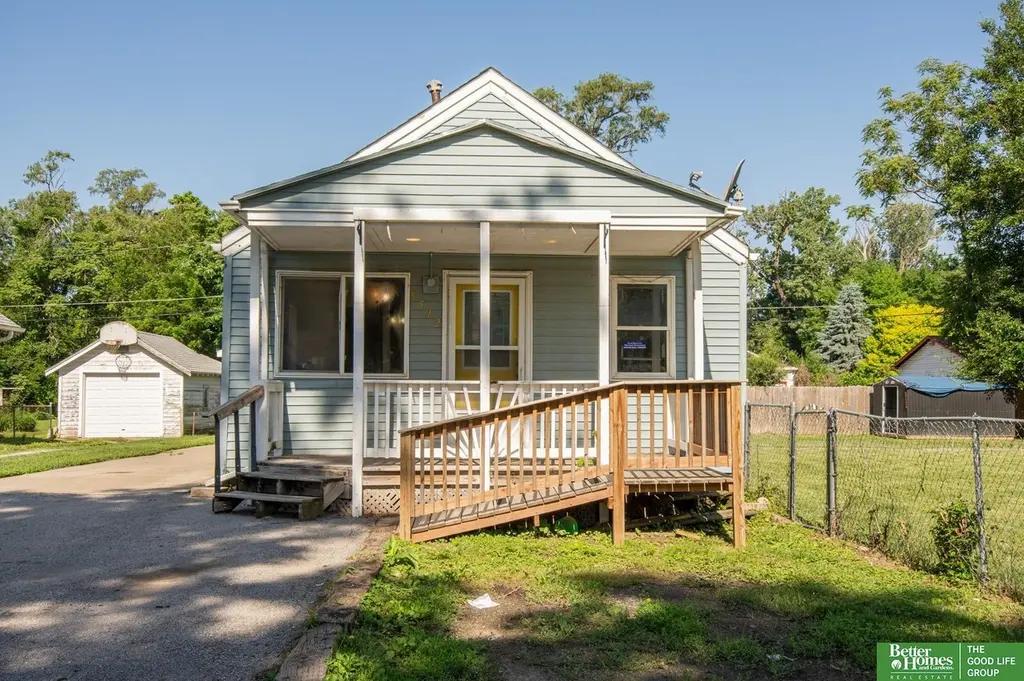
5512 N 6th St · Omaha, NE
Flood risk 1/10 · Minimal
- FEMA flood zone
- X
- Chance of flooding over 30 yrs
- 0.0%
- Est. flood insurance / yr
- $473 – $860
Fire risk 1/10 · Minimal
- Est. fire insurance / yr
- $1,161 – $2,155
Heat risk 3/10 · Minor
- Hot days now (above 105°F)
- 7 days/yr
- Hot days in 30 yrs
- 14 days/yr
Wind risk 2/10 · Minimal
- Chance of severe wind over 30 yrs
- —
Air-quality risk 2/10 · Minimal
- Unhealthy air days now
- 1 days/yr
- Unhealthy air days in 30 yrs
- 1 days/yr
Risk factors via First Street. Map © Google.
Why this score? — see what drove the C grade
The composite is a weighted blend of 9 inputs, each scored 0–100. Each bar is that input's sub-score; the figure is the points it added to the 100-point composite (weight × sub-score).
- Cash flow +20.1/30.0
- ARV discount +10.4/15.0
- DSCR +6.4/10.0
- 1% rule +5.7/10.0
- Appreciation +5.0/10.0
- Livability +4.2/5.0
- Rent growth +2.5/5.0
- Condition / age +2.5/5.0
- Schools +2.1/10.0
$100,000
🖨 Deal sheet 📄 Offer letter ✓ Due diligence
Listing remarks MLS
Small bungalow on large level lot, close to Carter Lake, Airport, and downtown. Some updating has been done, still needs more. Sold as-is. Priced to sell.
Key facts
- Solid foundation
- Spacious lot
- Functional layout
Tags
Property features AI
Exterior
- Parking: Detached 2-car garage; 2 total parking spaces (2 covered)
- Utilities: Public water; Public sewer; Electricity available; Natural gas available
- Home design: Single-family residence; Residential property; Built in 1928; Living area above grade: 677 sq ft
- Construction: Vinyl siding; Composition roof; Block foundation; Originally built in 1928
- Exterior features: Chain-link full fence; City lot, up to 1/4 acre (approx. 0.24 acres); Lot dimensions approx. 100 x 107
Interior
- Kitchen: Range
- Bedrooms: Main floor primary bedroom (approx. 10.6 x 9; ~95 sq ft); Main floor second bedroom (approx. 9.1 x 7.7; ~70 sq ft)
- Flooring: Carpet; Laminate
- Bathrooms: One full bathroom on the main floor
- Heating & cooling: Natural gas forced air heating; Central air conditioning
- Interior features: Unfinished full basement; Range; Carpet and laminate flooring; No fireplaces
Neighborhood map
What this means for you Summary
Snapshot
- This is a 1-bed/1.0-bath single-family listed at $100k.
Deal economics
- At list price, monthly cash flow is $125 ($1k/yr) — positive.
- The deal already cash-flows at list — no discount required.
- Meets the 1% rule at list price ($1k rent vs $100k).
- Cap rate 7.8% vs local median 3.6% in Omaha — top-decile yield for the area; either an underpriced asset or a hidden risk that comps aren't pricing in. Stress-test before assuming the spread holds.
Location & tenants
- Location reads 84/100 on livability (#7 in NE, #663 nationally) — a professional / high-income tenant draw. Strengths: amenities A+, commute A+, cost of living A+; Watch: crime F.
- Omaha Public Schools (urban): math 20% / reading 28% proficiency, ranked #110 of 111 in NE (top 99%) — low school quality limits family demand, transient renter base, plan for 1-2y turnover; 62% free/reduced lunch — lower-income household profile, screen leases tightly.
- Zoned schools: Sherman Elementary School (math 8% / reading 22%, grade F, #482 of 502 statewide, top 96%, 225 students, 0% FRL); North High School (math 21% / reading 25%, grade F, #247 of 261 statewide, top 95%, 1,796 students, 0% FRL) — zoned schools average 0% FRL vs 62% district-wide (62 pts lower); this property's tenant base skews higher-income than the district average.
- Market conditions: 1 active listings in the ZIP; 4,539 units permitted in Douglas County in 2024 (2,583 in 5+ unit buildings).
Forward outlook
- In year one you build about $4k of equity ($691 loan paydown + $3k appreciation (3.0% local appreciation)).
- Douglas County population projected at +28% by 2050 — long-run rental-demand tailwind backs the buy-and-hold thesis.
- At projected returns (3.0% appreciation + 3.0% rent growth), your $28k cash investment doubles in ~5 years — after that, you're playing with house money.
- By year 9, paydown + projected appreciation supports a ~$31k cash-out refi (75% LTV) — recoverable capital for the next deal without selling this one.
Negotiation context
- Only 9 days on market — expect competitive offers; lowballing is unlikely to land.
- 7 sale attempts since 24y ago with the ask held roughly flat each time — persistent listings suggest the price (not the market) is what's stuck; bring a comps-based counter.
- Current owner paid $42k; list at $100k implies a 138% gain — meaningful room to come down on a strong offer.
Risks & watch-outs
- Watch-outs: built in 1928 — expect roof / HVAC / electrical / plumbing capex.
Questions for the listing agent
- Built in 1928 — when were the roof, HVAC, electrical panel, plumbing, and water heater last replaced?
- Is there a deadline driving the sale (1031 exchange, divorce, estate, relocation)? That informs how much negotiation room exists.
- Crime grade is F in this area — have there been break-ins, vandalism, or insurance claims at this property in the last 3 years? What carrier currently insures it and at what premium?
- What's the average days-on-market for RENTAL listings here right now (not sales)? A rising rental-DOM trend means longer vacancies and softer asking-rent achievability than the comps imply.
- What's the recent tenant-quality profile in this submarket — average credit score on applications, eviction rate, late-payment / NSF rate, and stable-employment percentage? A property-management company in the area should have these aggregated.
- How much new for-sale + rental construction is in the pipeline within 1–3 miles? Heavy new supply typically softens prices + rents 12–24 months out; constrained supply supports both.
Investment metrics
- 1% rule
- 1.07% ✓
- Cap rate
- 7.79%
- Cash-on-cash
- 5.35%
- DSCR
- 1.24
- GRM
- 7.8
CMA / ARV
- ARV (on-the-fly)
- $106,966
- Comps found
- 3
Show comp detail 3 sales within ~0.75 mi
| Address | Dist | Beds/Ba | Sqft | Sold | Price | $/sf | Match |
|---|---|---|---|---|---|---|---|
| 5217 N 9th St | 0.48mi | 2/1.0 (+1) | 711 (+5%) | 18mo | $110,000 | $155 | 49 |
| 1001 E Fort St | 0.51mi | 1/1.0 | 729 (+8%) | 18mo | $115,000 | $158 | 48 |
| 5210 N 9th St E | 0.45mi | 1/1.0 | 576 (-15%) | 24mo | $115,000 | $200 | 34 |
Match score weights: distance 35% · size 25% · config 20% · recency 20%. Top-matched comps best support the ARV.
Projected returns pro-forma
3.0% appreciation · 3.0% rent growth · sell at horizon
- IRR
- 12.5%
- Equity multiple
- 1.72×
- Total profit
- $20,031
- Equity at exit
- $44,964
- IRR
- 14.5%
- Equity multiple
- 3.15×
- Total profit
- $60,228
- Equity at exit
- $69,295
Cash invested: $28,000 (down + closing). Projections, not guarantees.
Landlord ↔ Tenant lean methodology
- Overall (STATE)
- 83 Strongly Landlord-Friendly
- State Nebraska
- 83 Strongly Landlord-Friendly · R+13
- County
- — inherits STATE
- City
- — inherits STATE
ZIP-level market 68110-9999
- Active inventory
- 1
- Price-to-rent
- 7.8×
Monthly cashflow live
- Estimated rent
- $1,069 medium interval (Pro) →
- Mortgage (P&I)
- −$524
- Tax from tax record
- −$154 /mo · $1,843/yr
- Insurance
- −$42
- HOA
- −$0
- Vacancy / Maint / Mgmt
- −$224
- Net cashflow
- $125
Break-even live
UW: 25.0% down · 7.5% · 30yr · 1.5% tax · 5.0% vac · 8.0% maint · 8.0% mgmt
Financing live
Cash to close
- Down payment
- $25,000
- Closing costs
- $3,000
- Reserves months
- —
- Total cash needed
- —
Loan-product check · same deal, 3 products live
Conventional
25% down · 7.5% · 30yr
- Down + closing
- —
- Monthly P&I
- —
- Monthly cashflow
- —
- DSCR
- —
- Eligible?
- —
Personal DTI + credit; lowest rate.
DSCR
20% down · 8.5% · 30yr
- Down + closing
- —
- Monthly P&I
- —
- Monthly cashflow
- —
- DSCR
- —
- Eligible?
- —
No personal income docs; deal must DSCR.
Hard money
10% down · 12.0% · 12mo
- Down + closing
- —
- Monthly P&I
- —
- Monthly cashflow
- —
- DSCR
- —
- Eligible?
- —
Short-term bridge; refi at stabilization.
Listing history 6 events
-
2026-06-13statusdays on market $100,000 Pending 9 DOM
-
2026-06-10days on market $100,000 Active 7 DOM
-
2026-06-09days on market $100,000 Active 6 DOM
-
2026-06-08statusdays on market $100,000 Active 5 DOM
-
2026-06-07remarks 699-char remark
-
2026-06-07$100,000 New 4 DOM
ⓘ Source: listings_history table (triggers on properties + properties_extension) + one-shot
backfill from property_details.listing_events for pre-trigger history.
Tax reassessment forecast NE · Resets to sale price
- Current annual tax
- $1,843 · $154/mo
- Projected year-2 tax
- $1,843 · $154/mo
- Expected delta
- $0/yr ($0/mo · 0.0%)
ⓘ Screening estimate from a state-policy table — verify with the county assessor before closing.
Climate risk First Street
- Flood 1/10 Low FEMA zone X · 0% chance over 30 yrs
- Wildfire 1/10 Low
- Heat 3/10 Moderate 7 d/yr ≥105°F today · 14 d/yr by 30 yrs out
- Wind 2/10 Low
- Air quality 2/10 Low 1 unhealthy d/yr today · 1 by 30 yrs out
Nearby sold comps map
Loading sold comps map…
Walkable amenities ~0.75 mi
Loading nearby amenities…
Taxation est. · year 1
- Rental income
- $12,827
- − Mortgage interest
- −$5,602
- − Property taxes
- −$1,843
- − Insurance
- −$500
- − Repairs & maintenance
- −$1,026
- − Management
- −$1,026
- − Depreciation
- −$2,909
- Taxable loss
- −$78
- Est. tax savings @ 24.0%
- +$19
- After-tax cash flow
- $1,517/yr
For passive investors: Depreciation is non-cash, so a rental often shows a tax loss while cash-flowing — sheltering income. Rental losses are passive: they offset passive income freely, and up to $25,000/yr can offset ordinary (W-2) income if you actively participate and your MAGI is under $100k (phasing out to $0 by $150k); unused losses carry forward. On sale, claimed depreciation is recaptured at up to 25%, and gains may owe capital-gains tax (a 1031 exchange can defer both). Figures are a year-1 estimate at your 24.0% rate — not tax advice; consult a CPA.
Schools (NCES district)
- District
- Omaha Public Schools
- NCES district ID
- 3174820
- Math proficiency
- 20% ▼ -10.00%
- Reading proficiency
- 28% ▼ -5.00%
- Median HH income
- $46,039
- Composite
- 20.83/100
- National rank
- #8502
- State rank
- #110 of 111 in NE
Livability — Omaha
- Score
- 84/100
- State rank
- #7
- US rank
- #663
Category grades
Schools grade is shown separately in the Schools card above.
Census & demographics
- Census place
- Omaha, NE
Population outlook (Douglas County) Hauer SSP2
- Today (2025)
- 625,245 people
- By 2030
- 661,613 · +5.8%
- By 2040
- 732,395 · +17.1%
- By 2050
- 801,988 · +28.3%
- By 2075
- 968,637 · +54.9%
- By 2100
- 1,101,871 · +76.2%
Not yet ingested
- Political lean
- —
- Race & ethnicity
- —
- Common origin
- —
- Civics
- —
Market trends
- HPI YoY
- —
- Current HPI
- —
- Rent YoY
- —
- Metro
- —
- State GDP YoY
- ▲ 0.68%
- F500 in state
- 2
Industry mix (Fortune 500 HQ in NE)
| Industry | F500 HQs | Revenue |
|---|---|---|
| Conglomerate | 1 | $371B |
|
||
Price history
+186.1% since first listed19 events — show timeline
- 2026-06-03 Listed $100,000 GPRMLS
- 2012-07-31 Sold (Public Records) $42,000 Public Records
- 2009-06-01 Listing Removed — GPRMLS
- 2008-07-15 Listed $49,900 GPRMLS
- 2008-01-14 Sold (MLS) $15,000 GPRMLS
- 2008-01-07 Listing Removed — GPRMLS
- 2007-10-24 Listed $19,500 GPRMLS
- 2007-08-30 Listing Removed — GPRMLS
- 2007-01-03 Listed $35,500 GPRMLS
- 2006-12-01 Listing Removed — GPRMLS
- 2006-08-31 Listed $39,000 GPRMLS
- 2005-12-21 Sold (Public Records) $36,000 Public Records
- 2005-12-08 Sold (MLS) $35,500 GPRMLS
- 2005-11-28 Listing Removed — GPRMLS
- 2005-10-11 Listed $39,500 GPRMLS
- 2002-04-24 Sold (Public Records) $34,000 Public Records
- 2002-04-17 Sold (MLS) $34,000 GPRMLS
- 2002-03-27 Listing Removed — GPRMLS
- 2002-03-04 Listed $34,950 GPRMLS
Property tax history
+16.5%/yrLatest (2025): $1,843 · +1.7% YoY. Source: county tax records.
Cash-flow waterfall
monthlySold comps — $/sqft
last 12 mo · ≤1 miLoading sold comps…