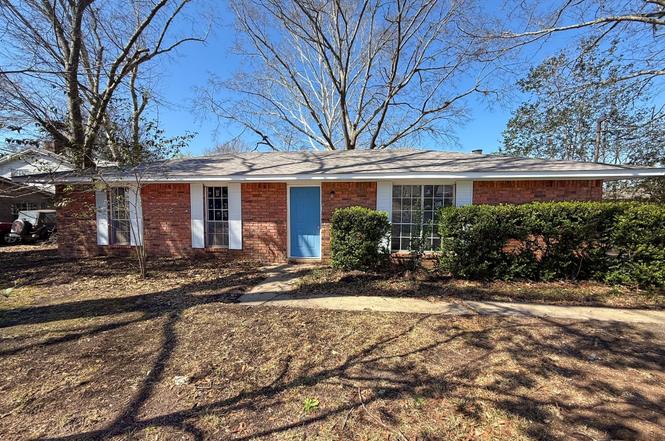
6835 Sanders Dr · Millbrook, AL
Flood risk 1/10 · Minimal
- FEMA flood zone
- X (unshaded)
- Chance of flooding over 30 yrs
- 0.0%
- Est. flood insurance / yr
- $507 – $1,088
Fire risk 4/10 · Minor
- Est. fire insurance / yr
- $916 – $1,700
Heat risk 7/10 · Major
- Hot days now (above 108°F)
- 7 days/yr
- Hot days in 30 yrs
- 20 days/yr
Wind risk 6/10 · Moderate
- Chance of severe wind over 30 yrs
- 76.0%
Air-quality risk 3/10 · Minor
- Unhealthy air days now
- 3 days/yr
- Unhealthy air days in 30 yrs
- 4 days/yr
Risk factors via First Street. Map © Google.
Why this score? — see what drove the B- grade
The composite is a weighted blend of 9 inputs, each scored 0–100. Each bar is that input's sub-score; the figure is the points it added to the 100-point composite (weight × sub-score).
- Cash flow +29.4/30.0
- DSCR +10.0/10.0
- ARV discount +9.0/15.0
- 1% rule +6.9/10.0
- Schools +3.5/10.0
- Livability +3.3/5.0
- Rent growth +2.5/5.0
- Condition / age +2.5/5.0
- Appreciation +0.0/10.0
$184,900
🖨 Deal sheet 📄 Offer letter ✓ Due diligence
Listing remarks MLS
3 BEDROOM 2 BATH HOME WITH CARPET!! KITCHEN/DEN COMBINATION AND SEPARATE ROOM THAT COULD BE DINING ROOM OR LIVING ROOM, EIK. FENCED BACKYARD
Key facts
- Large lot
- Updated vanities
- Updated flooring
Tags
Property features AI
Exterior
- Parking: Driveway
- Utilities: Public water; Public sewer; Cable available
- Home design: Single-story home
- Construction: Brick and wood siding exterior; Slab foundation
- Exterior features: Fully fenced yard; Patio; City lot with mature trees
Interior
- Kitchen: Kitchen included (open to family room)
- Bedrooms: Bedrooms located on the first floor
- Flooring: Plank flooring; Tile flooring; Vinyl flooring
- Bathrooms: 2 full bathrooms on the first floor
- Heating & cooling: Central heating (electric); Central air conditioning (electric); Electric water heater
- Interior features: One fireplace; Kitchen/Family room combo
- Laundry & utility: First-floor laundry
Neighborhood map
What this means for you Summary
Snapshot
- This is a 3-bed/2.0-bath single-family listed at $185k.
Deal economics
- At list price, monthly cash flow is $658 ($8k/yr) — positive.
- The deal already cash-flows at list — no discount required.
- Meets the 1% rule at list price ($2k rent vs $185k).
- Recommended offer: $174k (6.0% below list) — sets the bar for market timing.
- Cap rate 10.6% vs local median 4.4% in Millbrook — top-decile yield for the area; either an underpriced asset or a hidden risk that comps aren't pricing in. Stress-test before assuming the spread holds.
Location & tenants
- Location reads 66/100 on livability (#110 in AL) — a middle-class / working-renter tenant base. Strengths: cost of living A+, housing A+; Watch: crime D+, amenities F, commute F.
- Elmore County (town): math 27% / reading 54% proficiency, ranked #21 of 129 in AL (top 16%) — families likely to look elsewhere, expect single-tenant / working-renter base with shorter leases.
- Market conditions: 19 active listings in the ZIP; 1 comparable units currently listed for rent nearby; 92 units permitted in Elmore County in 2024 (0 in 5+ unit buildings).
Forward outlook
- Local home prices are declining (-3.0%/yr); year-one equity from $1k of loan paydown is wiped out by about $6k of value loss. Plan a longer hold.
- Elmore County population projected at +6% by 2050 — modest demand growth; plan on rents tracking national, not racing it.
- At projected returns (-3.0% appreciation + 3.0% rent growth), your $52k cash investment doubles in ~8 years — after that, you're playing with house money.
Negotiation context
- It's been on market 83 days — a 6% lower offer ($174k) is reasonable based on typical stale-listing flexibility.
- 4 sale attempts since 24y ago with the ask held roughly flat each time — persistent listings suggest the price (not the market) is what's stuck; bring a comps-based counter.
- Current owner paid $91k; list at $185k implies a 103% gain — meaningful room to come down on a strong offer.
Risks & watch-outs
- Climate carrying-cost: major wind risk, 76% chance of damaging wind over 30y; extreme-heat days projected 7→20/yr by 2055 (HVAC capex compounding) — expect insurance premiums to compound above CPI over the hold.
Questions for the listing agent
- It's been on market 83 days. Have you received any prior offers? Is the seller open to a 6% concession, seller financing, or rate buy-down credit?
- Built in 1972 — when were the roof, HVAC, electrical panel, plumbing, and water heater last replaced?
- Why hasn't it sold? Are there any deal-killer items the seller is aware of (foundation, flood, title, zoning, code violations)?
- Is there a deadline driving the sale (1031 exchange, divorce, estate, relocation)? That informs how much negotiation room exists.
- Crime grade is D in this area — have there been break-ins, vandalism, or insurance claims at this property in the last 3 years? What carrier currently insures it and at what premium?
- What's the average days-on-market for RENTAL listings here right now (not sales)? A rising rental-DOM trend means longer vacancies and softer asking-rent achievability than the comps imply.
- What's the recent tenant-quality profile in this submarket — average credit score on applications, eviction rate, late-payment / NSF rate, and stable-employment percentage? A property-management company in the area should have these aggregated.
- How much new for-sale + rental construction is in the pipeline within 1–3 miles? Heavy new supply typically softens prices + rents 12–24 months out; constrained supply supports both.
Investment metrics
- 1% rule
- 1.19% ✓
- Cap rate
- 10.57%
- Cash-on-cash
- 15.26%
- DSCR
- 1.68
- GRM
- 7.0
CMA / ARV
- ARV (on-the-fly)
- $191,403
- Comps found
- 12
Show comp detail 12 sales within ~0.75 mi
| Address | Dist | Beds/Ba | Sqft | Sold | Price | $/sf | Match |
|---|---|---|---|---|---|---|---|
| 6835 Sanders Dr | 0.00mi | 3/2.0 | 1,382 (+0%) | 0mo | $195,000 | $141 | 99 |
| 6730 Governors Dr | 0.19mi | 3/2.0 | 1,314 (-5%) | 5mo | $179,900 | $137 | 79 |
| 6715 Governors Dr | 0.24mi | 3/2.0 | 1,358 (-1%) | 14mo | $177,000 | $130 | 75 |
| 105 Brownstone Loop | 0.18mi | 3/2.0 | 1,515 (+10%) | 3mo | $277,900 | $183 | 73 |
| 6735 Pineleaf Dr | 0.45mi | 3/2.0 | 1,473 (+7%) | 1mo | $202,000 | $137 | 66 |
| 6731 Buttercup Dr | 0.19mi | 3/2.0 | 1,543 (+12%) | 6mo | $215,000 | $139 | 66 |
| 5060 Paige Hills Dr | 0.20mi | 3/2.5 | 1,485 (+8%) | 15mo | $194,500 | $131 | 63 |
| 39 Turtle Dr | 0.69mi | 3/2.0 | 1,460 (+6%) | 3mo | $239,900 | $164 | 55 |
| 100 Silver Crest Dr | 0.47mi | 3/2.0 | 1,464 (+6%) | 18mo | $215,000 | $147 | 53 |
| 4760 Longview Rd | 0.56mi | 3/2.0 | 1,481 (+8%) | 11mo | $193,500 | $131 | 53 |
| 79 Turtle Dr | 0.68mi | 3/2.0 | 1,470 (+7%) | 13mo | $229,000 | $156 | 46 |
| 195 Meadow Lane Dr | 0.70mi | 3/1.0 | 1,200 (-13%) | 5mo | $140,000 | $117 | 38 |
Match score weights: distance 35% · size 25% · config 20% · recency 20%. Top-matched comps best support the ARV.
Projected returns pro-forma
-3.0% appreciation · 3.0% rent growth · sell at horizon
- IRR
- 5.9%
- Equity multiple
- 1.23×
- Total profit
- $11,877
- Equity at exit
- $27,569
- IRR
- 15.3%
- Equity multiple
- 2.24×
- Total profit
- $63,970
- Equity at exit
- $15,987
Cash invested: $51,772 (down + closing). Projections, not guarantees.
Landlord ↔ Tenant lean methodology
- Overall (STATE)
- 90 Strongly Landlord-Friendly
- State Alabama
- 90 Strongly Landlord-Friendly · R+15
- County
- — inherits STATE
- City
- — inherits STATE
ZIP-level market 36025
- Home prices YoY
- -14.9%
- Active inventory
- 19
- Price-to-rent
- 7.0×
Monthly cashflow live
- Estimated rent
- $2,200 medium interval (Pro) →
- Mortgage (P&I)
- −$970
- Tax from tax record
- −$33 /mo · $396/yr
- Insurance
- −$77
- HOA
- −$0
- Vacancy / Maint / Mgmt
- −$462
- Net cashflow
- $658
Break-even live
UW: 25.0% down · 7.5% · 30yr · 1.5% tax · 5.0% vac · 8.0% maint · 8.0% mgmt
Financing live
Cash to close
- Down payment
- $46,225
- Closing costs
- $5,547
- Reserves months
- —
- Total cash needed
- —
Loan-product check · same deal, 3 products live
Conventional
25% down · 7.5% · 30yr
- Down + closing
- —
- Monthly P&I
- —
- Monthly cashflow
- —
- DSCR
- —
- Eligible?
- —
Personal DTI + credit; lowest rate.
DSCR
20% down · 8.5% · 30yr
- Down + closing
- —
- Monthly P&I
- —
- Monthly cashflow
- —
- DSCR
- —
- Eligible?
- —
No personal income docs; deal must DSCR.
Hard money
10% down · 12.0% · 12mo
- Down + closing
- —
- Monthly P&I
- —
- Monthly cashflow
- —
- DSCR
- —
- Eligible?
- —
Short-term bridge; refi at stabilization.
Rent comps 1 comps
| Address | Beds | Baths | Sqft | Rent | $/sqft | DOM | Units | Dist |
|---|---|---|---|---|---|---|---|---|
| 80 Blackmon Dr Coosada, AL | 3.0 | 2.5 | 1845 | $2,200 | $1.19 | 13d | 1 | 1.02mi |
Listing history 10 events
-
2026-05-11historical Contingent
-
2026-05-08status Active
-
2026-05-06status Pending
-
2026-04-11historical Contingent
-
2026-03-03$184,900 Active
-
2026-01-16soldstatus $91,000 Closed 141-char remark
Show marketing remark (141 chars)
3 BEDROOM 2 BATH HOME WITH CARPET!! KITCHEN/DEN COMBINATION AND SEPARATE ROOM THAT COULD BE DINING ROOM OR LIVING ROOM, EIK. FENCED BACKYARD
-
2025-12-22status Pending 141-char remark
Show marketing remark (141 chars)
3 BEDROOM 2 BATH HOME WITH CARPET!! KITCHEN/DEN COMBINATION AND SEPARATE ROOM THAT COULD BE DINING ROOM OR LIVING ROOM, EIK. FENCED BACKYARD
-
2025-11-12$93,600 Active 141-char remark
Show marketing remark (141 chars)
3 BEDROOM 2 BATH HOME WITH CARPET!! KITCHEN/DEN COMBINATION AND SEPARATE ROOM THAT COULD BE DINING ROOM OR LIVING ROOM, EIK. FENCED BACKYARD
-
2003-04-29soldstatus $81,000 281-char remark
Show marketing remark (281 chars)
3 BEDROOM 2 BATH HOME WITH NEW TILE IN KITCHEN AND NEW CARPET!! KITCHEN/DEN COMBINATION AND SEPARATE ROOM THAT COULD BE DINING ROOM OR LIVING ROOM, EIK. FENCED BACKYARD WITH WIRED STORAGE BUILDING. INSIDE DOG'S NAME IS "SHADOW", CALL HIS NAME AND HE SHOULD BE FRIENDLY!!
-
2002-10-07$81,500 281-char remark
Show marketing remark (281 chars)
3 BEDROOM 2 BATH HOME WITH NEW TILE IN KITCHEN AND NEW CARPET!! KITCHEN/DEN COMBINATION AND SEPARATE ROOM THAT COULD BE DINING ROOM OR LIVING ROOM, EIK. FENCED BACKYARD WITH WIRED STORAGE BUILDING. INSIDE DOG'S NAME IS "SHADOW", CALL HIS NAME AND HE SHOULD BE FRIENDLY!!
ⓘ Source: listings_history table (triggers on properties + properties_extension) + one-shot
backfill from property_details.listing_events for pre-trigger history.
Tax reassessment forecast AL · Resets to sale price
- Current annual tax
- $396 · $33/mo
- Projected year-2 tax
- $758 · $63/mo
- Expected delta
- +$362/yr (+$30/mo · 91.2%)
ⓘ Screening estimate from a state-policy table — verify with the county assessor before closing.
Climate risk First Street
- Flood 1/10 Low FEMA zone X (unshaded) · 0% chance over 30 yrs
- Wildfire 4/10 Moderate
- Heat 7/10 Severe 7 d/yr ≥108°F today · 20 d/yr by 30 yrs out
- Wind 6/10 Major 76% chance of damaging wind over 30 yrs
- Air quality 3/10 Moderate 3 unhealthy d/yr today · 4 by 30 yrs out
Nearby sold comps map
Loading sold comps map…
Walkable amenities ~0.75 mi
Loading nearby amenities…
Taxation est. · year 1
- Rental income
- $26,400
- − Mortgage interest
- −$10,357
- − Property taxes
- −$396
- − Insurance
- −$924
- − Repairs & maintenance
- −$2,112
- − Management
- −$2,112
- − Depreciation
- −$5,379
- Taxable income
- $5,119
- Est. tax owed @ 24.0%
- −$1,229
- After-tax cash flow
- $6,671/yr
For passive investors: Depreciation is non-cash, so a rental often shows a tax loss while cash-flowing — sheltering income. Rental losses are passive: they offset passive income freely, and up to $25,000/yr can offset ordinary (W-2) income if you actively participate and your MAGI is under $100k (phasing out to $0 by $150k); unused losses carry forward. On sale, claimed depreciation is recaptured at up to 25%, and gains may owe capital-gains tax (a 1031 exchange can defer both). Figures are a year-1 estimate at your 24.0% rate — not tax advice; consult a CPA.
Schools (NCES district)
- District
- Elmore County
- NCES district ID
- 0101290
- Math proficiency
- 27% ▼ -25.00%
- Reading proficiency
- 54% ▲ 3.00%
- Median HH income
- $54,898
- Composite
- 35.27/100
- National rank
- #4974
- State rank
- #21 of 129 in AL
Livability — Millbrook
- Score
- 66/100
- State rank
- #110
- US rank
- #12087
Category grades
Schools grade is shown separately in the Schools card above.
Census & demographics
- Census place
- Millbrook, AL
- City population
- 14,600
- Population (ZIP)
- 7,083
Population outlook (Elmore County) Hauer SSP2
- Today (2025)
- 85,154 people
- By 2030
- 86,667 · +1.8%
- By 2040
- 89,014 · +4.5%
- By 2050
- 90,331 · +6.1%
- By 2075
- 96,096 · +12.8%
- By 2100
- 95,290 · +11.9%
Race, ethnicity, and origin ACS 2023
- Neighborhood character
- Majority White (51%)
- Race & ethnicity
- White 51% Black 44% Hispanic / Latino 3% Two or more races 2%
- Common ancestry
- Slovak 2% Serbian 1% Italian 1%
- Foreign-born
- 3% · Canada
- Languages at home
- 97% English-only · Spanish 1% German/W. Germanic 1%
Political lean MEDSL · Elmore
- 2024 margin
- Solid R (+52.1) · D 23.6% · R 75.6%
- 2008→2024 swing
- -1.1pp toward R · 2008: -50.9pp · 2024: -52.1pp
- All cycles
- 2024: R+52.1 2020: R+48.2 2016: R+52.0 2012: R+48.8 2008: R+50.9
Not yet ingested
- Civics
- —
Market trends
- HPI YoY
- ▼ -25.66%
- Current HPI
- 146.5191
- Rent YoY
- —
- Metro
- —
- State GDP YoY
- ▲ 2.94%
- F500 in state
- 4
Industry mix (Fortune 500 HQ in AL)
| Industry | F500 HQs | Revenue |
|---|---|---|
| Financial Services | 1 | $8B |
|
||
| Healthcare | 1 | $5B |
|
||
Price history
+126.9% since first listed10 events — show timeline
- 2026-05-11 Contingent — MAAR
- 2026-05-08 Relisted — MAAR
- 2026-05-06 Pending — MAAR
- 2026-04-11 Contingent — MAAR
- 2026-03-03 Listed $184,900 MAAR
- 2026-01-16 Sold (MLS) $91,000 MAAR
- 2025-12-22 Pending — MAAR
- 2025-11-12 Listed $93,600 MAAR
- 2003-04-29 Sold (MLS) $81,000 MAAR
- 2002-10-07 Listed $81,500 MAAR
Property tax history
+2.6%/yrLatest (2025): $396 · +0.0% YoY. Source: county tax records.
Cash-flow waterfall
monthlySold comps — $/sqft
last 12 mo · ≤1 miLoading sold comps…