11500 Douglas Dr N · Champlin, MN
Flood risk 1/10 · Minimal
- FEMA flood zone
- X (unshaded)
- Chance of flooding over 30 yrs
- 0.0%
- Est. flood insurance / yr
- $473 – $860
Fire risk 1/10 · Minimal
- Est. fire insurance / yr
- $888 – $1,650
Heat risk 2/10 · Minimal
- Hot days now (above 99°F)
- 7 days/yr
- Hot days in 30 yrs
- 14 days/yr
Wind risk 2/10 · Minimal
- Chance of severe wind over 30 yrs
- —
Air-quality risk 2/10 · Minimal
- Unhealthy air days now
- 2 days/yr
- Unhealthy air days in 30 yrs
- 2 days/yr
Risk factors via First Street. Map © Google.
Why this score? — see what drove the D grade
The composite is a weighted blend of 9 inputs, each scored 0–100. Each bar is that input's sub-score; the figure is the points it added to the 100-point composite (weight × sub-score).
- ARV discount +15.0/15.0
- Cash flow +8.9/30.0
- Schools +4.7/10.0
- Livability +4.5/5.0
- DSCR +2.5/10.0
- Rent growth +2.5/5.0
- Condition / age +2.5/5.0
- 1% rule +2.3/10.0
- Appreciation +0.0/10.0
$349,900
🖨 Deal sheet (PDF) 📄 Offer letter ✓ Due diligence
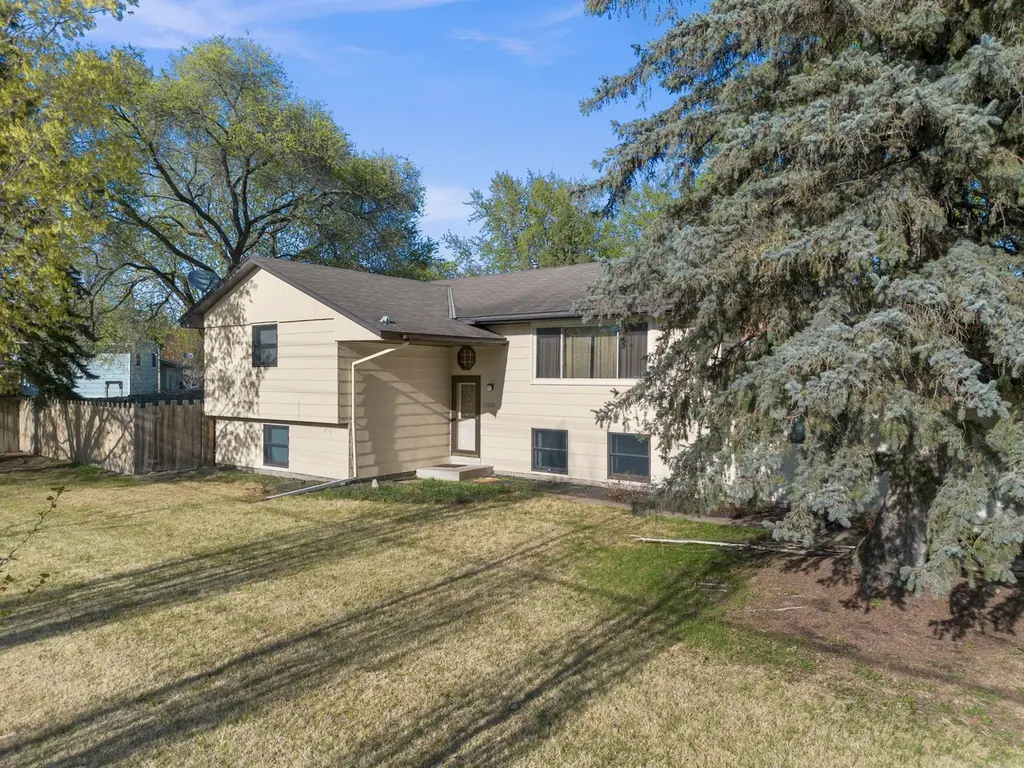
Listing remarks
Spacious split-entry home with a large footprint, ideally located on a corner lot. Three bedrooms are conveniently situated on one level, while the lower level offers a generous family room and a separate amusement room—perfect for entertaining or flexible living space. Tile flooring adds durability throughout, and two fireplaces provide warmth and comfort. Easy access to Highway 169 makes commuting a breeze, with shopping, restaurants, and everyday conveniences just minutes away.
Key facts
- 0.33 acre lot
- 2 garage spots
- Built 1975
Property features AI
Exterior
- Parking: Attached 2-car garage
- Utilities: City water (connected); City sewer (connected); Natural gas service; Electric service with circuit breakers
- Home design: Residential property; Split entry (bi-level) design; Two levels (main and lower)
- Construction: Block foundation; Asphalt roof (over 8 years old)
- Exterior features: Deck; Storage shed; Corner lot with sidewalks and city street frontage
Interior
- Kitchen: Eat-in kitchen / kitchen-dining room layout; Range; Microwave; Dishwasher
- Bedrooms: 4 bedrooms (three on the upper/main level, one on the lower level)
- Bathrooms: One full bathroom on the upper level; One three-quarter bathroom in the basement
- Heating & cooling: Forced air heating; Fireplace heating options; Central air conditioning
- Interior features: Ceiling fans; Kitchen window; Finished basement with daylight/lookout windows; Block foundation in basement; Two fireplaces (wood burning and electric) serving family room, living room and amusement room; 3 bedrooms on one level
- Laundry & utility: Washer located in the basement; Gas water heater
Neighborhood map
What this means for you Summary
Snapshot
- This is a 4-bed/2.0-bath single-family listed at $350k.
Deal economics
- At list price, monthly cash flow is $-281 ($-3k/yr) — negative.
- To cash-flow at today's rent, offer at most $300k (14.2% below list).
- To meet the 1% rule (rent ≥ 1% of price), the offer needs to be $256k (26.8% below list).
- Recommended offer: $256k (26.8% below list) — sets the bar for 1% rule.
- Cap rate 5.3% vs local median 4.2% in Champlin — meaningfully above typical; check what's discounted (condition, days-on-market, listing class) to confirm the premium yield is real.
Location & tenants
- Location reads 90/100 on livability (#4 in MN, #106 nationally) — a professional / high-income tenant draw. Strengths: commute A+, employment A+, housing A+.
- Anoka-Hennepin Public School District (suburban): math 49% / reading 55% proficiency, ranked #71 of 301 in MN (top 24%) — acceptable for families but not a draw, mixed tenant base, ~2y average lease.
- Zoned schools: Oxbow Creek Elementary (math 71% / reading 65%, grade B+, #96 of 857 statewide, top 11%, 1,028 students, 31% FRL); Jackson Middle (math 39% / reading 51%, grade D, #113 of 258 statewide, top 45%, 1,981 students, 43% FRL); Champlin Park High School (math 48% / reading 63%, grade C, #80 of 471 statewide, top 17%, 2,983 students, 41% FRL).
- Market conditions: 105 active listings in the ZIP; 4 comparable units currently listed for rent nearby; rentals at typical pace (median 22d on market — plan ~3-4 weeks tenant-placement turnaround); high-income renter base; 4,651 units permitted in Hennepin County in 2024 (2,443 in 5+ unit buildings).
Forward outlook
- Local home prices are declining (-3.0%/yr); year-one equity from $2k of loan paydown is wiped out by about $10k of value loss. Plan a longer hold.
- Hennepin County population projected at +30% by 2050 — long-run rental-demand tailwind backs the buy-and-hold thesis.
Negotiation context
- Only 8 days on market — expect competitive offers; lowballing is unlikely to land.
- 3 sale attempts since 33y ago with the ask held roughly flat each time — persistent listings suggest the price (not the market) is what's stuck; bring a comps-based counter.
Questions for the listing agent
- What do current leases actually rent for vs. the listed asking? Can we see a recent rent roll and the last 12 months of T-12 income?
- Built in 1975 — when were the roof, HVAC, electrical panel, plumbing, and water heater last replaced?
- Is there a deadline driving the sale (1031 exchange, divorce, estate, relocation)? That informs how much negotiation room exists.
- Schools are A-rated — typically a magnet for longer-tenancy family renters. What's the average tenant stay here, and is there a school-zone premium baked into asking?
- The area grade is low — what's the realistic commute time and amenity access for the typical tenant pool here? Any planned neighborhood developments (good or bad) we should know about?
- What's the average days-on-market for RENTAL listings here right now (not sales)? A rising rental-DOM trend means longer vacancies and softer asking-rent achievability than the comps imply.
- What's the recent tenant-quality profile in this submarket — average credit score on applications, eviction rate, late-payment / NSF rate, and stable-employment percentage? A property-management company in the area should have these aggregated.
- How much new for-sale + rental construction is in the pipeline within 1–3 miles? Heavy new supply typically softens prices + rents 12–24 months out; constrained supply supports both.
Investment metrics
- 1% rule
- 0.73% ✗
- Cap rate
- 5.33%
- Cash-on-cash
- -3.44%
- DSCR
- 0.85
- GRM
- 11.4
CMA / ARV
- ARV (median comp)
- $461,834
- List price
- $349,900
- Delta
- -24.24%
- Verdict
- UNDERPRICED
- Comps
- 5 within 1.0 mi
Projected returns pro-forma
-3.0% appreciation · 3.0% rent growth · sell at horizon
- IRR
- -22.1%
- Equity multiple
- 0.24×
- Total profit
- $-74,625
- Equity at exit
- $52,171
- IRR
- -16.1%
- Equity multiple
- 0.10×
- Total profit
- $-88,151
- Equity at exit
- $30,253
Cash invested: $97,972 (down + closing). Projections, not guarantees.
Landlord ↔ Tenant lean methodology
- Overall (STATE)
- 46 Balanced
- State Minnesota
- 46 Balanced · D+2
- County
- — inherits STATE
- City
- — inherits STATE
ZIP-level market 55316
- Active inventory
- 105
- Price-to-rent
- 11.4×
Monthly cashflow live
- Estimated rent
- $2,561 medium interval (Pro) →
- Mortgage (P&I)
- −$1,835
- Tax from tax record
- −$324 /mo · $3,883/yr
- Insurance
- −$146
- HOA
- −$0
- Vacancy / Maint / Mgmt
- −$538
- Net cashflow
- $-281
Break-even live
Sensitivity live
| Price | -10% $-83 | -5% $-182 | +0% $-281 | +5% $-380 | +10% $-479 |
|---|---|---|---|---|---|
| Rent | -10% $-483 | -5% $-382 | +0% $-281 | +5% $-180 | +10% $-79 |
| Rate | -1.0pp $-105 | -0.5pp $-192 | base $-281 | +0.5pp $-372 | +1.0pp $-464 |
UW: 25.0% down · 7.5% · 30yr · 1.5% tax · 5.0% vac · 8.0% maint · 8.0% mgmt
Financing live
Cash to close
- Down payment
- $87,475
- Closing costs
- $10,497
- Reserves months
- —
- Total cash needed
- —
Loan-product check · same deal, 3 products live
Conventional
25% down · 7.5% · 30yr
- Down + closing
- —
- Monthly P&I
- —
- Monthly cashflow
- —
- DSCR
- —
- Eligible?
- —
Personal DTI + credit; lowest rate.
DSCR
20% down · 8.5% · 30yr
- Down + closing
- —
- Monthly P&I
- —
- Monthly cashflow
- —
- DSCR
- —
- Eligible?
- —
No personal income docs; deal must DSCR.
Hard money
10% down · 12.0% · 12mo
- Down + closing
- —
- Monthly P&I
- —
- Monthly cashflow
- —
- DSCR
- —
- Eligible?
- —
Short-term bridge; refi at stabilization.
Rent comps 4 comps
| Address | Beds | Baths | Sqft | Rent | $/sqft | DOM | Units | Dist |
|---|---|---|---|---|---|---|---|---|
| 11209 Oregon Ave N Champlin, MN | 3.0 | 2.0 | 2144 | $2,695 | $1.26 | 18d | 1 | 0.88mi |
| 11408 Winnetka Ave N Champlin, MN | 3.0 | 1.0 | 1428 | $1,050 | $0.74 | 21d | 1 | 1.01mi |
| 11020 W River Rd Champlin, MN | 5.0 | 2.0 | 2046 | $2,500 | $1.22 | 12d | 1 | 1.10mi |
| 11960 Emery Village Dr N Champlin, MN | 3.0 | 3.0 | 1665 | $2,299 | $1.38 | 23d | 1 | 1.46mi |
Listing history 11 events
-
2026-05-08status Pending 491-char remark
-
2026-05-03historical Contingent - Inspection 491-char remark
-
2026-05-01$349,900 Active 491-char remark
-
2026-04-28historical $349,900 491-char remark
-
1996-12-10soldstatus $108,500
-
1996-11-27soldstatus $108,500
-
1996-09-30historical
-
1996-08-05$111,500
-
1993-09-29soldstatus $96,500
-
1993-09-29soldstatus $96,500
-
1993-06-09$99,450
ⓘ Source: listings_history table (triggers on properties + properties_extension) + one-shot
backfill from property_details.listing_events for pre-trigger history.
Tax reassessment forecast MN · Partial reset (capped growth)
- Current annual tax
- $3,883 · $324/mo
- Projected year-2 tax
- $3,901 · $325/mo
- Expected delta
- +$18/yr (+$1/mo · 0.5%)
ⓘ Screening estimate from a state-policy table — verify with the county assessor before closing.
Climate risk First Street
- Flood 1/10 Low FEMA zone X (unshaded) · 0% chance over 30 yrs
- Wildfire 1/10 Low
- Heat 2/10 Low 7 d/yr ≥99°F today · 14 d/yr by 30 yrs out
- Wind 2/10 Low
- Air quality 2/10 Low 2 unhealthy d/yr today · 2 by 30 yrs out
Nearby sold comps map
Loading sold comps map…
Walkable amenities ~0.75 mi
Loading nearby amenities…
Taxation est. · year 1
- Rental income
- $30,734
- − Mortgage interest
- −$19,600
- − Property taxes
- −$3,883
- − Insurance
- −$1,750
- − Repairs & maintenance
- −$2,459
- − Management
- −$2,459
- − Depreciation
- −$10,179
- Taxable loss
- −$9,595
- Est. tax savings @ 24.0%
- +$2,303
- After-tax cash flow
- $-1,069/yr
For passive investors: Depreciation is non-cash, so a rental often shows a tax loss while cash-flowing — sheltering income. Rental losses are passive: they offset passive income freely, and up to $25,000/yr can offset ordinary (W-2) income if you actively participate and your MAGI is under $100k (phasing out to $0 by $150k); unused losses carry forward. On sale, claimed depreciation is recaptured at up to 25%, and gains may owe capital-gains tax (a 1031 exchange can defer both). Figures are a year-1 estimate at your 24.0% rate — not tax advice; consult a CPA.
Schools (NCES district)
- District
- Anoka-Hennepin Public School District
- NCES district ID
- 2703180
- Math proficiency
- 49% ▼ -14.00%
- Reading proficiency
- 55% ▼ -10.00%
- Median HH income
- $73,837
- Composite
- 46.7/100
- National rank
- #2400
- State rank
- #71 of 301 in MN
Livability — Champlin
- Score
- 90/100
- State rank
- #4
- US rank
- #106
Category grades
Schools grade is shown separately in the Schools card above.
Census & demographics
- Census place
- Champlin, MN
- County
- Hennepin County · 1,150,272 people
- City population
- 23,294
- Metro
- Minneapolis-St. Paul-Bloomington, MN-WI
- Population (ZIP)
- 23,294
- Household income
- $116,102
- Rent vs Own
- Severe rent burden
- 270.0
Population outlook (Hennepin County) Hauer SSP2
- Today (2025)
- 1,405,227 people
- By 2030
- 1,492,650 · +6.2%
- By 2040
- 1,660,157 · +18.1%
- By 2050
- 1,823,498 · +29.8%
- By 2075
- 2,221,283 · +58.1%
- By 2100
- 2,509,976 · +78.6%
Race, ethnicity, and origin ACS 2023
- Neighborhood character
- Predominantly White (78%)
- Race & ethnicity
- White 78% Black 11% Asian 4% Two or more races 4% Hispanic / Latino 2%
- Common ancestry
- Portuguese 12% Romanian 4% Lithuanian 3%
- Foreign-born
- 11% · Canada, Vietnam, South Korea
- Languages at home
- 88% English-only · Russian/Polish/Slavic 2% Other Asian/Pacific 2% Spanish 1%
Political lean MEDSL · Hennepin
- 2024 margin
- Solid D (+42.6) · D 70.2% · R 27.5% · Other 2.3%
- 2008→2024 swing
- +14.0pp toward D · 2008: 28.6pp · 2024: 42.6pp
- All cycles
- 2024: D+42.6 2020: D+43.2 2016: D+35.3 2012: D+27.1 2008: D+28.6
Not yet ingested
- Civics
- —
Market trends
- HPI YoY
- ▼ -311.30%
- Current HPI
- 229.5956
- Rent YoY
- —
- Metro
- Minneapolis-St. Paul-Bloomington, MN-WI
- State GDP YoY
- ▲ 2.41%
- F500 in state
- 34
Industry mix (Fortune 500 HQ in MN)
| Industry | F500 HQs | Revenue |
|---|---|---|
| Healthcare | 2 | $407B |
|
||
| Retail | 2 | $150B |
|
||
| Consumer Goods | 2 | $32B |
|
||
| Industrial Machinery | 2 | $6B |
|
||
| Agriculture | 1 | $40B |
|
||
| Healthcare / Medical Devices | 1 | $32B |
|
||
Price history
+257.0% since first listed12 events — show timeline
- 2026-06-12 Sold (MLS) $355,000 NORTHSTARMLS as Distributed by MLS Grid
- 2026-05-08 Pending — NORTHSTARMLS as Distributed by MLS Grid
- 2026-05-03 Contingent — NORTHSTARMLS as Distributed by MLS Grid
- 2026-05-01 Listed $349,900 NORTHSTARMLS as Distributed by MLS Grid
- 2026-04-28 Coming Soon $349,900 NORTHSTARMLS as Distributed by MLS Grid
- 1996-12-10 Sold (Public Records) $108,500 Public Records
- 1996-11-27 Sold (MLS) $108,500 NORTHSTARMLS as Distributed by MLS Grid
- 1996-09-30 Listing Removed — NORTHSTARMLS as Distributed by MLS Grid
- 1996-08-05 Listed $111,500 NORTHSTARMLS as Distributed by MLS Grid
- 1993-09-29 Sold (Public Records) $96,500 Public Records
- 1993-09-29 Sold (MLS) $96,500 NORTHSTARMLS as Distributed by MLS Grid
- 1993-06-09 Listed $99,450 NORTHSTARMLS as Distributed by MLS Grid
Property tax history
+3.5%/yrLatest (2025): $3,883 · -9.7% YoY. Source: county tax records.
Cash-flow waterfall
monthlySold comps — $/sqft
last 12 mo · ≤1 miLoading sold comps…