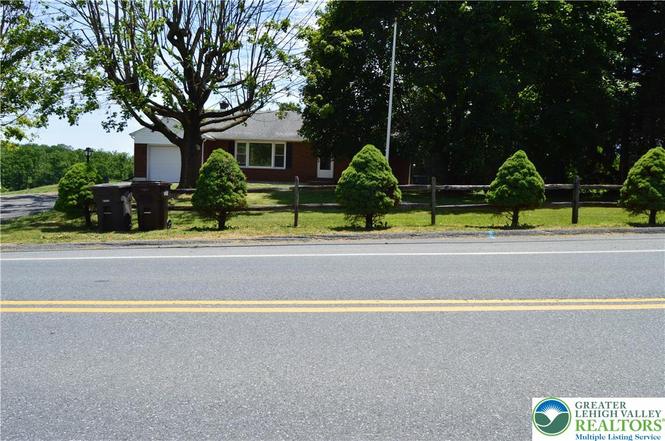
1819 Blue Barn Rd · South Whitehall, PA
Flood risk 1/10 · Minimal
- FEMA flood zone
- X (unshaded)
- Chance of flooding over 30 yrs
- 0.0%
- Est. flood insurance / yr
- $473 – $860
Fire risk 1/10 · Minimal
- Est. fire insurance / yr
- $511 – $949
Heat risk 4/10 · Minor
- Hot days now (above 99°F)
- 7 days/yr
- Hot days in 30 yrs
- 15 days/yr
Wind risk 4/10 · Minor
- Chance of severe wind over 30 yrs
- 17.0%
Air-quality risk 2/10 · Minimal
- Unhealthy air days now
- 1 days/yr
- Unhealthy air days in 30 yrs
- 3 days/yr
Risk factors via First Street. Map © Google.
Why this score? — see what drove the D+ grade
The composite is a weighted blend of 9 inputs, each scored 0–100. Each bar is that input's sub-score; the figure is the points it added to the 100-point composite (weight × sub-score).
- Cash flow +13.8/30.0
- ARV discount +7.5/15.0
- Schools +5.7/10.0
- Appreciation +5.4/10.0
- DSCR +4.2/10.0
- 1% rule +3.5/10.0
- Rent growth +2.5/5.0
- Livability +2.5/5.0
- Condition / age +2.5/5.0
$362,000
🖨 Deal sheet 📄 Offer letter ✓ Due diligence
Listing remarks MLS
Brick Ranch in South Whitehall. 3 bedrooms and 1 bath with new central air system with heat pump. Home is situated on half acre lot, country living but super close to the city. Schedule your showing today won't last long.
Key facts
- New septic system
- Private retreat
- New central air
Tags
Property features AI
Exterior
- Parking: Attached garage with 1 garage space; Driveway with garage door opener
- Utilities: 200+ amp electrical service with circuit breakers; Septic tank sewer; Community/cooperative water
- Home design: Single-story home; Above-grade finished area reported
- Construction: Brick and steel siding exterior; Asphalt/fiberglass roofing
- Exterior features: Sunroom (12 x 6); Lot approximately 0.547 acres; Zoned RR
Interior
- Kitchen: Electric oven; Electric range; Refrigerator
- Bedrooms: Bedroom on first level (8 x 10); Bedroom (10 x 11); Bedroom (10 x 13)
- Flooring: Hardwood; Laminate; Resilient flooring; Tile
- Bathrooms: One full bathroom (5 x 9)
- Heating & cooling: Heat pump; Oil heating; Central air conditioning
- Interior features: Dining area with a separate/formal dining room; Basement with exterior entry (full)
- Laundry & utility: Washer; Electric dryer; Electric dryer hookup; Electric water heater
Neighborhood map
What this means for you Summary
Snapshot
- This is a 3-bed/1.0-bath single-family listed at $362k.
Deal economics
- At list price, monthly cash flow is $36 ($429/yr) — positive.
- The deal already cash-flows at list — no discount required.
- To meet the 1% rule (rent ≥ 1% of price), the offer needs to be $308k (14.9% below list).
- Recommended offer: $308k (14.9% below list) — sets the bar for 1% rule.
Location & tenants
- Location reads: area grade D — affects rentability + tenant quality, not the cash-flow math above.
- Parkland SD (suburban): math 59% / reading 70% proficiency, ranked #40 of 539 in PA (top 7%) — acceptable for families but not a draw, mixed tenant base, ~2y average lease; only 15% free/reduced lunch — higher-income household profile.
- Market conditions: 51 active listings in the ZIP; 1 comparable units currently listed for rent nearby; 765 units permitted in Lehigh County in 2024 (286 in 5+ unit buildings).
Forward outlook
- In year one you build about $6k of equity ($3k loan paydown + $3k appreciation (0.9% local appreciation)).
- Lehigh County population projected at +21% by 2050 — long-run rental-demand tailwind backs the buy-and-hold thesis.
- At projected returns (0.9% appreciation + 3.0% rent growth), your $101k cash investment doubles in ~10 years — after that, you're playing with house money.
- By year 6, paydown + projected appreciation supports a ~$33k cash-out refi (75% LTV) — recoverable capital for the next deal without selling this one.
Negotiation context
- Only 4 days on market — expect competitive offers; lowballing is unlikely to land.
- 4 sale attempts since 22y ago with the ask held roughly flat each time — persistent listings suggest the price (not the market) is what's stuck; bring a comps-based counter.
Risks & watch-outs
- Watch-outs: built in 1956 — expect roof / HVAC / electrical / plumbing capex.
Questions for the listing agent
- Built in 1956 — when were the roof, HVAC, electrical panel, plumbing, and water heater last replaced?
- Is there a deadline driving the sale (1031 exchange, divorce, estate, relocation)? That informs how much negotiation room exists.
- The area grade is low — what's the realistic commute time and amenity access for the typical tenant pool here? Any planned neighborhood developments (good or bad) we should know about?
- What's the average days-on-market for RENTAL listings here right now (not sales)? A rising rental-DOM trend means longer vacancies and softer asking-rent achievability than the comps imply.
- What's the recent tenant-quality profile in this submarket — average credit score on applications, eviction rate, late-payment / NSF rate, and stable-employment percentage? A property-management company in the area should have these aggregated.
- How much new for-sale + rental construction is in the pipeline within 1–3 miles? Heavy new supply typically softens prices + rents 12–24 months out; constrained supply supports both.
Investment metrics
- 1% rule
- 0.85% ✗
- Cap rate
- 6.41%
- Cash-on-cash
- 0.42%
- DSCR
- 1.02
- GRM
- 9.8
CMA / ARV
No comps found within radius.
Projected returns pro-forma
0.88% appreciation · 3.0% rent growth · sell at horizon
- IRR
- 1.3%
- Equity multiple
- 1.07×
- Total profit
- $6,862
- Equity at exit
- $121,274
- IRR
- 6.1%
- Equity multiple
- 1.73×
- Total profit
- $74,160
- Equity at exit
- $159,393
Cash invested: $101,360 (down + closing). Projections, not guarantees.
Landlord ↔ Tenant lean methodology
- Overall (STATE)
- 62 Landlord-Friendly
- State Pennsylvania
- 62 Landlord-Friendly · EVEN
- County
- — inherits STATE
- City
- — inherits STATE
ZIP-level market 18069
- Home prices YoY
- 0.3%
- Active inventory
- 51
- Price-to-rent
- 9.8×
Monthly cashflow live
- Estimated rent
- $3,080 medium interval (Pro) →
- Mortgage (P&I)
- −$1,898
- Tax from tax record
- −$348 /mo · $4,179/yr
- Insurance
- −$151
- HOA
- −$0
- Vacancy / Maint / Mgmt
- −$647
- Net cashflow
- $36
Break-even live
UW: 25.0% down · 7.5% · 30yr · 1.5% tax · 5.0% vac · 8.0% maint · 8.0% mgmt
Financing live
Cash to close
- Down payment
- $90,500
- Closing costs
- $10,860
- Reserves months
- —
- Total cash needed
- —
Loan-product check · same deal, 3 products live
Conventional
25% down · 7.5% · 30yr
- Down + closing
- —
- Monthly P&I
- —
- Monthly cashflow
- —
- DSCR
- —
- Eligible?
- —
Personal DTI + credit; lowest rate.
DSCR
20% down · 8.5% · 30yr
- Down + closing
- —
- Monthly P&I
- —
- Monthly cashflow
- —
- DSCR
- —
- Eligible?
- —
No personal income docs; deal must DSCR.
Hard money
10% down · 12.0% · 12mo
- Down + closing
- —
- Monthly P&I
- —
- Monthly cashflow
- —
- DSCR
- —
- Eligible?
- —
Short-term bridge; refi at stabilization.
Rent comps 1 comps
| Address | Beds | Baths | Sqft | Rent | $/sqft | DOM | Units | Dist |
|---|---|---|---|---|---|---|---|---|
| 5265 Rockrose Ln Allentown, PA | 1.0–2.0 | 1.0–2.0 | 1400 | $3,080 | $2.20 | 2d | 21 | 1.48mi |
Listing history 5 events
-
2026-06-18days on market $362,000 Active 4 DOM
-
2026-06-17days on market $362,000 Active 3 DOM
-
2026-06-16days on market $362,000 Active 2 DOM
-
2026-06-15remarks 341-char remark
-
2026-06-15$362,000 Active 1 DOM
ⓘ Source: listings_history table (triggers on properties + properties_extension) + one-shot
backfill from property_details.listing_events for pre-trigger history.
Tax reassessment forecast PA · Partial reset (capped growth)
- Current annual tax
- $4,179 · $348/mo
- Projected year-2 tax
- $4,949 · $412/mo
- Expected delta
- +$770/yr (+$64/mo · 18.4%)
ⓘ Screening estimate from a state-policy table — verify with the county assessor before closing.
Climate risk First Street
- Flood 1/10 Low FEMA zone X (unshaded) · 0% chance over 30 yrs
- Wildfire 1/10 Low
- Heat 4/10 Moderate 7 d/yr ≥99°F today · 15 d/yr by 30 yrs out
- Wind 4/10 Moderate 17% chance of damaging wind over 30 yrs
- Air quality 2/10 Low 1 unhealthy d/yr today · 3 by 30 yrs out
Nearby sold comps map
Loading sold comps map…
Walkable amenities ~0.75 mi
Loading nearby amenities…
Taxation est. · year 1
- Rental income
- $36,960
- − Mortgage interest
- −$20,278
- − Property taxes
- −$4,179
- − Insurance
- −$1,810
- − Repairs & maintenance
- −$2,957
- − Management
- −$2,957
- − Depreciation
- −$10,531
- Taxable loss
- −$5,751
- Est. tax savings @ 24.0%
- +$1,380
- After-tax cash flow
- $1,809/yr
For passive investors: Depreciation is non-cash, so a rental often shows a tax loss while cash-flowing — sheltering income. Rental losses are passive: they offset passive income freely, and up to $25,000/yr can offset ordinary (W-2) income if you actively participate and your MAGI is under $100k (phasing out to $0 by $150k); unused losses carry forward. On sale, claimed depreciation is recaptured at up to 25%, and gains may owe capital-gains tax (a 1031 exchange can defer both). Figures are a year-1 estimate at your 24.0% rate — not tax advice; consult a CPA.
Schools (NCES district)
- District
- Parkland SD
- NCES district ID
- 4218510
- Math proficiency
- 59% ▼ -11.00%
- Reading proficiency
- 70% ▼ -12.00%
- Median HH income
- $77,976
- Composite
- 57.44/100
- National rank
- #1074
- State rank
- #40 of 539 in PA
Livability — South Whitehall
No livability data for this city. (Only ~50 U.S. cities are tracked.)
Census & demographics
- Population (ZIP)
- 8,804
Population outlook (Lehigh County) Hauer SSP2
- Today (2025)
- 392,957 people
- By 2030
- 408,319 · +3.9%
- By 2040
- 440,007 · +12.0%
- By 2050
- 475,940 · +21.1%
- By 2075
- 590,448 · +50.3%
- By 2100
- 690,314 · +75.7%
Race, ethnicity, and origin ACS 2023
- Neighborhood character
- Predominantly White (77%)
- Race & ethnicity
- White 77% Hispanic / Latino 9% Two or more races 8% Asian 8% Black 2%
- Hispanic origin (detail)
- Mexican 2% Puerto Rican 5%
- Common ancestry
- Scotch-Irish 6% Romanian 3% Lithuanian 3%
- Foreign-born
- 10% · Canada, South Korea, China
- Languages at home
- 87% English-only · Spanish 5% Other Indo-European 2% Chinese 2%
Political lean MEDSL · Lehigh
- 2024 margin
- Toss-up / Even · D 50.7% · R 48.0% · Other 1.2%
- 2008→2024 swing
- -12.9pp toward R · 2008: 15.6pp · 2024: 2.7pp
- All cycles
- 2024: D+2.7 2020: D+7.6 2016: D+4.4 2012: D+7.5 2008: D+15.6
Not yet ingested
- Civics
- —
Market trends
- HPI YoY
- ▲ 0.88%
- Current HPI
- 277.9781
- Rent YoY
- —
- Metro
- —
- State GDP YoY
- ▲ 1.68%
- F500 in state
- 34
Industry mix (Fortune 500 HQ in PA)
| Industry | F500 HQs | Revenue |
|---|---|---|
| Healthcare | 2 | $309B |
|
||
| Insurance | 2 | $27B |
|
||
| Telecommunications / Media | 1 | $124B |
|
||
| Industrial Distribution | 1 | $22B |
|
||
| Financial Services | 1 | $20B |
|
||
| Chemicals / Materials | 1 | $18B |
|
||
Price history
+126.4% since first listed12 events — show timeline
- 2026-06-14 Listed $362,000 GLVRMLS
- 2023-10-12 Sold (Public Records) $327,000 Public Records
- 2023-10-10 Sold (MLS) $327,000 GLVRMLS
- 2023-09-14 Pending — GLVRMLS
- 2023-09-11 Listed $320,000 GLVRMLS
- 2022-07-08 Sold (Public Records) $295,000 Public Records
- 2022-07-01 Sold (MLS) $295,000 GLVRMLS
- 2022-05-23 Pending — GLVRMLS
- 2022-05-03 Listed $295,000 GLVRMLS
- 2004-07-21 Sold (Public Records) $165,000 Public Records
- 2004-07-19 Sold (MLS) $165,000 GLVRMLS
- 2004-06-14 Listed $159,900 GLVRMLS
Property tax history
+2.1%/yrLatest (2026): $4,179 · +3.9% YoY. Source: county tax records.
Cash-flow waterfall
monthlySold comps — $/sqft
last 12 mo · ≤1 miLoading sold comps…