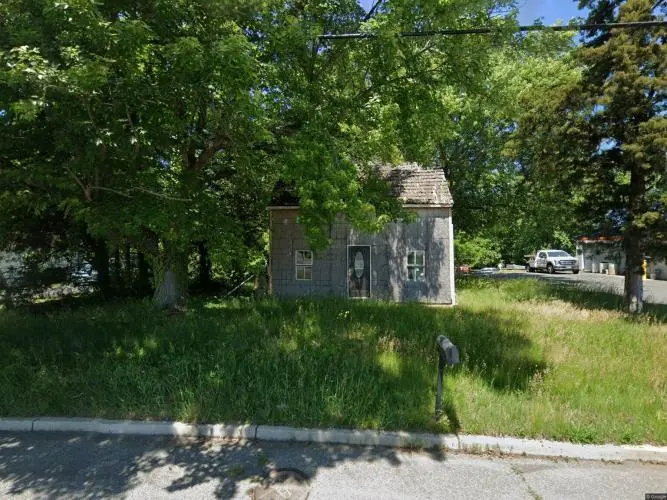
83 Coles Rd · Blackwood, NJ
Flood risk 1/10 · Minimal
- FEMA flood zone
- X (unshaded)
- Chance of flooding over 30 yrs
- 0.0%
- Est. flood insurance / yr
- $507 – $1,088
Fire risk 2/10 · Minimal
- Est. fire insurance / yr
- $526 – $976
Heat risk 7/10 · Major
- Hot days now (above 104°F)
- 7 days/yr
- Hot days in 30 yrs
- 15 days/yr
Wind risk 6/10 · Moderate
- Chance of severe wind over 30 yrs
- 57.0%
Air-quality risk 4/10 · Minor
- Unhealthy air days now
- 4 days/yr
- Unhealthy air days in 30 yrs
- 6 days/yr
Risk factors via First Street. Map © Google.
Why this score? — see what drove the B- grade
The composite is a weighted blend of 9 inputs, each scored 0–100. Each bar is that input's sub-score; the figure is the points it added to the 100-point composite (weight × sub-score).
- Cash flow +30.0/30.0
- 1% rule +10.0/10.0
- DSCR +10.0/10.0
- ARV discount +7.5/15.0
- Rent growth +3.5/5.0
- Livability +3.5/5.0
- Schools +2.6/10.0
- Condition / age +2.5/5.0
- Appreciation +0.0/10.0
$135,000
🖨 Deal sheet 📄 Offer letter ✓ Due diligence
Listing remarks MLS
This is Fannie Mae Homepath property. Make this house your home with tender loving care. This property is located near the major road, It has 2 bedrooms, 1 full bath and unfinished basement. Very good investment opportunity.
Key facts
- Built 1825
- Listed 101 days
Neighborhood map
What this means for you Summary
Snapshot
- This is a 2-bed/1.0-bath single-family listed at $135k.
Deal economics
- At list price, monthly cash flow is $599 ($7k/yr) — positive.
- The deal already cash-flows at list — no discount required.
- Meets the 1% rule at list price ($2k rent vs $135k).
- Recommended offer: $123k (9.0% below list) — sets the bar for market timing.
- Cap rate 11.6% vs local median 3.6% in Blackwood — top-decile yield for the area; either an underpriced asset or a hidden risk that comps aren't pricing in. Stress-test before assuming the spread holds.
Location & tenants
- Location reads 70/100 on livability (#269 in NJ) — a middle-class / working-renter tenant base. Strengths: housing A+, crime A-; Watch: schools C-, cost of living C-, amenities F.
- Gloucester Township Public Schools (suburban): math 14% / reading 41% proficiency, ranked #351 of 472 in NJ (top 74%) — low school quality limits family demand, transient renter base, plan for 1-2y turnover.
- Market conditions: Rents rising fast (+4.2%/yr); 174 active listings in the ZIP; 10 comparable units currently listed for rent nearby; rentals leasing fast (median 2d on market — plan ~1-2 weeks tenant-placement turnaround); solid renter incomes; 1,018 units permitted in Camden County in 2024 (509 in 5+ unit buildings).
Forward outlook
- Local home prices are declining (-3.0%/yr); year-one equity from $933 of loan paydown is wiped out by about $4k of value loss. Plan a longer hold.
- Camden County population projected to shrink 8% by 2050 — rents likely to lag national; underwrite the cash flow, not the appreciation.
- At projected returns (-3.0% appreciation + 4.2% rent growth), your $38k cash investment doubles in ~6 years — after that, you're playing with house money.
Negotiation context
- It's been on market 101 days — a 9% lower offer ($123k) is reasonable based on typical stale-listing flexibility.
- 6 sale attempts since 9y ago with the ask held roughly flat each time — persistent listings suggest the price (not the market) is what's stuck; bring a comps-based counter.
- Current owner paid $10k; list at $135k implies a 1250% gain — meaningful room to come down on a strong offer.
Risks & watch-outs
- Watch-outs: property tax is 2.8% of price; built in 1825 — expect roof / HVAC / electrical / plumbing capex.
- Climate carrying-cost: major wind risk, 57% chance of damaging wind over 30y; extreme-heat days projected 7→15/yr by 2055 (HVAC capex compounding) — expect insurance premiums to compound above CPI over the hold.
Questions for the listing agent
- It's been on market 101 days. Have you received any prior offers? Is the seller open to a 9% concession, seller financing, or rate buy-down credit?
- Built in 1825 — when were the roof, HVAC, electrical panel, plumbing, and water heater last replaced?
- Property tax is high relative to price — has the assessment been appealed recently, and will the sale trigger a re-assessment?
- Why hasn't it sold? Are there any deal-killer items the seller is aware of (foundation, flood, title, zoning, code violations)?
- Is there a deadline driving the sale (1031 exchange, divorce, estate, relocation)? That informs how much negotiation room exists.
- What's the average days-on-market for RENTAL listings here right now (not sales)? A rising rental-DOM trend means longer vacancies and softer asking-rent achievability than the comps imply.
- What's the recent tenant-quality profile in this submarket — average credit score on applications, eviction rate, late-payment / NSF rate, and stable-employment percentage? A property-management company in the area should have these aggregated.
- How much new for-sale + rental construction is in the pipeline within 1–3 miles? Heavy new supply typically softens prices + rents 12–24 months out; constrained supply supports both.
Investment metrics
- 1% rule
- 1.58% ✓
- Cap rate
- 11.62%
- Cash-on-cash
- 19.01%
- DSCR
- 1.85
- GRM
- 5.3
CMA / ARV
- ARV (on-the-fly)
- $302,376
- Comps found
- 8
Show comp detail 8 sales within ~0.75 mi
| Address | Dist | Beds/Ba | Sqft | Sold | Price | $/sf | Match |
|---|---|---|---|---|---|---|---|
| 342 Empire Ave | 0.44mi | 3/2.0 (+1) | 1,091 (+6%) | 1mo | $185,000 | $170 | 60 |
| 531 Cloverdale Rd | 0.64mi | 3/1.0 (+1) | 1,008 (-2%) | 11mo | $295,000 | $293 | 52 |
| 326 Hillcrest Ln | 0.56mi | 3/1.0 (+1) | 1,120 (+8%) | 8mo | $335,000 | $299 | 48 |
| 529 E Blenheim Ave | 0.62mi | 3/2.0 (+1) | 1,155 (+12%) | 11mo | $350,000 | $303 | 34 |
| 307 North Dr | 0.46mi | 3/1.5 (+1) | 912 (-12%) | 23mo | $207,000 | $227 | 32 |
| 242 Cedar Ave | 0.71mi | 3/1.0 (+1) | 1,161 (+12%) | 12mo | $286,000 | $246 | 31 |
| 122 Keystone Ave | 0.69mi | 2/1.0 | 1,152 (+12%) | 21mo | $230,000 | $200 | 31 |
| 116 Keystone Ave | 0.72mi | 3/2.0 (+1) | 1,176 (+14%) | 6mo | $350,000 | $298 | 29 |
Match score weights: distance 35% · size 25% · config 20% · recency 20%. Top-matched comps best support the ARV.
Projected returns pro-forma
-3.0% appreciation · 4.16% rent growth · sell at horizon
- IRR
- 12.4%
- Equity multiple
- 1.50×
- Total profit
- $18,903
- Equity at exit
- $20,129
- IRR
- 22.3%
- Equity multiple
- 3.03×
- Total profit
- $76,642
- Equity at exit
- $11,672
Cash invested: $37,800 (down + closing). Projections, not guarantees.
Landlord ↔ Tenant lean methodology
- Overall (STATE)
- 21 Tenant-Leaning
- State New Jersey
- 21 Tenant-Leaning · D+6
- County
- — inherits STATE
- City
- — inherits STATE
ZIP-level market 08012
- Rents YoY
- 4.2%
- Active inventory
- 174
- Price-to-rent
- 5.3×
Monthly cashflow live
- Estimated rent
- $2,130 high interval (Pro) →
- Mortgage (P&I)
- −$708
- Tax from tax record
- −$319 /mo · $3,832/yr
- Insurance
- −$56
- HOA
- −$0
- Vacancy / Maint / Mgmt
- −$447
- Net cashflow
- $599
Break-even live
UW: 25.0% down · 7.5% · 30yr · 1.5% tax · 5.0% vac · 8.0% maint · 8.0% mgmt
Financing live
Cash to close
- Down payment
- $33,750
- Closing costs
- $4,050
- Reserves months
- —
- Total cash needed
- —
Loan-product check · same deal, 3 products live
Conventional
25% down · 7.5% · 30yr
- Down + closing
- —
- Monthly P&I
- —
- Monthly cashflow
- —
- DSCR
- —
- Eligible?
- —
Personal DTI + credit; lowest rate.
DSCR
20% down · 8.5% · 30yr
- Down + closing
- —
- Monthly P&I
- —
- Monthly cashflow
- —
- DSCR
- —
- Eligible?
- —
No personal income docs; deal must DSCR.
Hard money
10% down · 12.0% · 12mo
- Down + closing
- —
- Monthly P&I
- —
- Monthly cashflow
- —
- DSCR
- —
- Eligible?
- —
Short-term bridge; refi at stabilization.
Rent comps 10 comps
| Address | Beds | Baths | Sqft | Rent | $/sqft | DOM | Units | Dist |
|---|---|---|---|---|---|---|---|---|
| 100 Blenheim-Erial Rd Blackwood, NJ | 1.0–2.0 | 1.0–2.0 | 1439 | $2,670 | $1.85 | 1d | 1 | 0.32mi |
| 230 Almonesson Rd Unit A Blackwood, NJ | 2.0 | 1.0 | 900 | $1,900 | $2.11 | 10d | 1 | 0.73mi |
| 1501 Old Black Horse Pike Blackwood, NJ | 1.0–2.0 | 1.0–1.5 | 1045 | $2,170 | $2.08 | 1d | 25 | 0.90mi |
| 227 Washington Ave Apt D2 Blackwood, NJ | 1.0 | 1.0 | 700 | $1,395 | $1.99 | 10d | 1 | 0.90mi |
| 227 Washington Ave Blackwood, NJ | 1.0 | 1.0 | 700 | $1,375 | $1.96 | 1d | 1 | 0.91mi |
| 432 Highland Ests Clementon, NJ | 1.0 | 1.0 | 827 | $1,500 | $1.81 | 12d | 1 | 1.21mi |
| 1341 Blackwood Clementon Rd Clementon, NJ | 1.0–2.0 | 1.0 | 925 | $2,564 | $2.77 | 1d | 26 | 1.23mi |
| 590 Lower Landing Rd Blackwood, NJ | 3.0 | 1.0–1.5 | 1030 | $2,087 | $2.03 | 1d | 10 | 1.39mi |
| 752 Davistown Rd Blackwood, NJ | 1.0–2.0 | 1.0–2.0 | 950 | $2,817 | $2.96 | 1d | 19 | 1.42mi |
| 1200 Little Gloucester Rd Clementon, NJ | 1.0–2.0 | 1.0 | 875 | $3,100 | $3.54 | 1d | 1 | 1.47mi |
Listing history 37 events
-
2026-06-18days on market $135,000 Active 101 DOM
-
2026-06-17days on market $135,000 Active 100 DOM
-
2026-06-16days on market $135,000 Active 99 DOM
-
2026-06-15days on market $135,000 Active 98 DOM
-
2026-06-13days on market $135,000 Active 96 DOM
-
2026-06-13days on market $135,000 Active 95 DOM
-
2026-06-09days on market $135,000 Active 92 DOM
-
2026-06-08days on market $135,000 Active 91 DOM
-
2026-06-07days on market $135,000 Active 90 DOM
-
2026-06-04days on market $135,000 Active 87 DOM
-
2026-06-03days on market $135,000 Active 86 DOM
-
2026-06-02days on market $135,000 Active 85 DOM
-
2026-06-01days on market $135,000 Active 84 DOM
-
2026-05-31days on market $135,000 Active 83 DOM
-
2026-03-05$135,000 Active 224-char remark
Show marketing remark (224 chars)
This is Fannie Mae Homepath property. Make this house your home with tender loving care. This property is located near the major road, It has 2 bedrooms, 1 full bath and unfinished basement. Very good investment opportunity.
-
2024-09-18historical
-
2024-07-11price $350,000
-
2024-07-02price $414,999
-
2024-06-18$415,000 Active
-
2024-04-09historical
-
2024-02-26historical Active Under Contract
-
2024-02-17price $75,000
-
2024-02-08price $89,000
-
2024-01-12$95,000 Active
-
2024-01-08historical
-
2023-12-01price $119,900
-
2023-11-21price $129,900
-
2023-11-09$139,900 Active
-
2018-02-28soldstatus $10,000 Sold
-
2018-02-28soldstatus $10,000
-
2018-02-20status Under Contract
-
2018-02-03price $13,900
-
2018-01-06price $16,900
-
2017-11-29$21,000 Active
-
2017-11-29$13,900
-
1986-08-07soldstatus $42,000
-
1984-01-01soldstatus $5,310,000
ⓘ Source: listings_history table (triggers on properties + properties_extension) + one-shot
backfill from property_details.listing_events for pre-trigger history.
Tax reassessment forecast NJ · Partial reset (capped growth)
- Current annual tax
- $3,832 · $319/mo
- Projected year-2 tax
- $3,832 · $319/mo
- Expected delta
- $0/yr ($0/mo · 0.0%)
ⓘ Screening estimate from a state-policy table — verify with the county assessor before closing.
Climate risk First Street
- Flood 1/10 Low FEMA zone X (unshaded) · 0% chance over 30 yrs
- Wildfire 2/10 Low
- Heat 7/10 Severe 7 d/yr ≥104°F today · 15 d/yr by 30 yrs out
- Wind 6/10 Major 57% chance of damaging wind over 30 yrs
- Air quality 4/10 Moderate 4 unhealthy d/yr today · 6 by 30 yrs out
Nearby sold comps map
Loading sold comps map…
Walkable amenities ~0.75 mi
Loading nearby amenities…
Taxation est. · year 1
- Rental income
- $25,554
- − Mortgage interest
- −$7,562
- − Property taxes
- −$3,832
- − Insurance
- −$675
- − Repairs & maintenance
- −$2,044
- − Management
- −$2,044
- − Depreciation
- −$3,927
- Taxable income
- $5,470
- Est. tax owed @ 24.0%
- −$1,313
- After-tax cash flow
- $5,873/yr
For passive investors: Depreciation is non-cash, so a rental often shows a tax loss while cash-flowing — sheltering income. Rental losses are passive: they offset passive income freely, and up to $25,000/yr can offset ordinary (W-2) income if you actively participate and your MAGI is under $100k (phasing out to $0 by $150k); unused losses carry forward. On sale, claimed depreciation is recaptured at up to 25%, and gains may owe capital-gains tax (a 1031 exchange can defer both). Figures are a year-1 estimate at your 24.0% rate — not tax advice; consult a CPA.
Schools (NCES district)
- District
- Gloucester Township Public Schools
- NCES district ID
- 3406030
- Math proficiency
- 14% ▼ -28.00%
- Reading proficiency
- 41% ▼ -13.00%
- Median HH income
- $72,539
- Composite
- 26.18/100
- National rank
- #7269
- State rank
- #351 of 472 in NJ
Livability — Blackwood
- Score
- 70/100
- State rank
- #269
- US rank
- #7928
Category grades
Schools grade is shown separately in the Schools card above.
Census & demographics
- County
- Camden County · 407,624 people
- Metro
- Philadelphia-Camden-Wilmington, PA-NJ-DE-MD
- Population (ZIP)
- 41,812
- Household income
- $95,451
- Rent vs Own
- Severe rent burden
- 1264.0
Population outlook (Camden County) Hauer SSP2
- Today (2025)
- 507,964 people
- By 2030
- 502,182 · -1.1%
- By 2040
- 485,602 · -4.4%
- By 2050
- 465,630 · -8.3%
- By 2075
- 419,986 · -17.3%
- By 2100
- 369,492 · -27.3%
Race, ethnicity, and origin ACS 2023
- Neighborhood character
- Predominantly White (71%)
- Race & ethnicity
- White 71% Black 10% Hispanic / Latino 9% Two or more races 8% Asian 5%
- Hispanic origin (detail)
- Mexican 1% Puerto Rican 4%
- Common ancestry
- Romanian 6% Lithuanian 2% Slovak 2%
- Foreign-born
- 9% · Canada, Jamaica, China
- Languages at home
- 87% English-only · Spanish 5% Other Indo-European 4% Tagalog/Filipino 1%
Political lean MEDSL · Camden
- 2024 margin
- Strong D (+27.4) · D 63.0% · R 35.5% · Other 1.5%
- 2008→2024 swing
- -8.8pp toward R · 2008: 36.2pp · 2024: 27.4pp
- All cycles
- 2024: D+27.4 2020: D+33.5 2016: D+32.4 2012: D+36.6 2008: D+36.2
Not yet ingested
- Civics
- —
Market trends
- HPI YoY
- ▼ -232.79%
- Current HPI
- 315.9676
- Rent YoY
- ▲ 4.16%
- Metro
- Philadelphia-Camden-Wilmington, PA-NJ-DE-MD
- State GDP YoY
- ▲ 2.05%
- F500 in state
- 34
Industry mix (Fortune 500 HQ in NJ)
| Industry | F500 HQs | Revenue |
|---|---|---|
| Consumer Goods | 3 | $31B |
|
||
| Pharmaceuticals | 2 | $153B |
|
||
| Technology | 2 | $21B |
|
||
| Insurance | 2 | $20B |
|
||
| Healthcare | 2 | $19B |
|
||
| Financial Services | 1 | $70B |
|
||
Price history
-97.5% since first listed23 events — show timeline
- 2026-03-05 Listed $135,000 Fizber.com
- 2024-09-18 Listing Removed — BRIGHT MLS
- 2024-07-11 Price Changed $350,000 BRIGHT MLS
- 2024-07-02 Price Changed $414,999 BRIGHT MLS
- 2024-06-18 Listed $415,000 BRIGHT MLS
- 2024-04-09 Listing Removed — BRIGHT MLS
- 2024-02-26 Contingent — BRIGHT MLS
- 2024-02-17 Price Changed $75,000 BRIGHT MLS
- 2024-02-08 Price Changed $89,000 BRIGHT MLS
- 2024-01-12 Listed $95,000 BRIGHT MLS
- 2024-01-08 Listing Removed — BRIGHT MLS
- 2023-12-01 Price Changed $119,900 BRIGHT MLS
- 2023-11-21 Price Changed $129,900 BRIGHT MLS
- 2023-11-09 Listed $139,900 BRIGHT MLS
- 2018-02-28 Sold (MLS) $10,000 BRIGHT MLS
- 2018-02-28 Sold (MLS) $10,000 TREND
- 2018-02-20 Pending — TREND
- 2018-02-03 Price Changed $13,900 TREND
- 2018-01-06 Price Changed $16,900 TREND
- 2017-11-29 Listed $13,900 BRIGHT MLS
- 2017-11-29 Listed $21,000 TREND
- 1986-08-07 Sold (Public Records) $42,000 Public Records
- 1984-01-01 Sold (Public Records) $5,310,000 Public Records
Property tax history
+2.7%/yrLatest (2025): $3,832 · +1.8% YoY. Source: county tax records.
Cash-flow waterfall
monthlySold comps — $/sqft
last 12 mo · ≤1 miLoading sold comps…