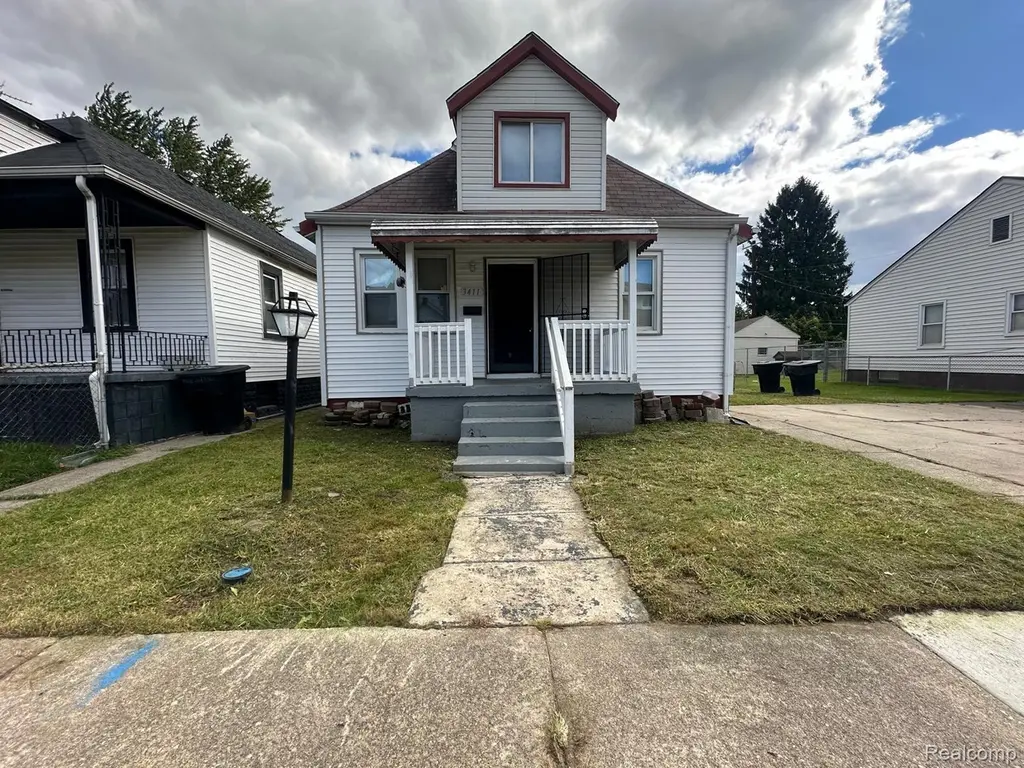
3411 S Edsel St · Detroit, MI
Flood risk 1/10 · Minimal
- FEMA flood zone
- X (unshaded)
- Chance of flooding over 30 yrs
- 0.0%
- Est. flood insurance / yr
- $507 – $1,088
Fire risk 1/10 · Minimal
- Est. fire insurance / yr
- $784 – $1,456
Heat risk 3/10 · Minor
- Hot days now (above 97°F)
- 7 days/yr
- Hot days in 30 yrs
- 15 days/yr
Wind risk 2/10 · Minimal
- Chance of severe wind over 30 yrs
- —
Air-quality risk 3/10 · Minor
- Unhealthy air days now
- 2 days/yr
- Unhealthy air days in 30 yrs
- 4 days/yr
Risk factors via First Street. Map © Google.
Why this score? — see what drove the C+ grade
The composite is a weighted blend of 9 inputs, each scored 0–100. Each bar is that input's sub-score; the figure is the points it added to the 100-point composite (weight × sub-score).
- Cash flow +24.1/30.0
- ARV discount +10.4/15.0
- DSCR +7.8/10.0
- 1% rule +7.0/10.0
- Appreciation +5.1/10.0
- Livability +3.7/5.0
- Rent growth +2.5/5.0
- Condition / age +2.5/5.0
- Schools +1.3/10.0
$109,000
🖨 Deal sheet (PDF) 📄 Offer letter ✓ Due diligence
Listing remarks MLS
Charming 3-Bedroom Starter Home in Detroit's Victory Park Neighborhood !! Discover this cozy single-family home at 3411 S Edsel St, Detroit, MI 48217, perfectly sized for comfortable living with classic Detroit character, this 3 bedrooms and 1 bathroom, ideal for first-time buyers, young families, or investors looking for a solid foundation in a convenient Southwest Detroit location. Spacious layout with three bedrooms for flexible use as family spaces, . shopping, dining, parks, and employment hubs – perfect for commuters or those wanting city convenience without the premium price tag. The neighborhood offers a mix of established homes and ongoing revitalization potential in ZIP 48217. Property is rented with a good paying tenant * * * photos taken when the tenants moved in * * *
Key facts
- 4,356 sq ft lot
- Built 1923
- Listed 9 days
Property features AI
Finance
- Other: Located in Victory Park subdivision; Directions: I-75 and north of Outer Drive
- Financial info: Annual tax information available
Exterior
- Parking: No garage
- Utilities: Public water available; Public sewer available
- Home design: Single-family residence; One-and-a-half stories; Ground-level entry with steps; Vinyl siding
- Construction: Vinyl siding exterior
- Exterior features: Paved road frontage; Lot approximately 45 x 100 (0.1 acre)
Interior
- Bathrooms: One full bathroom
- Heating & cooling: Forced air heating (natural gas); No central cooling
- Interior features: Crawl space basement; Six total rooms
Neighborhood map
What this means for you Summary
Snapshot
- This is a 3-bed/1.0-bath single-family listed at $109k.
Deal economics
- At list price, monthly cash flow is $216 ($3k/yr) — positive.
- The deal already cash-flows at list — no discount required.
- Meets the 1% rule at list price ($1k rent vs $109k).
Location & tenants
- Location reads 73/100 on livability (#218 in MI) — a middle-class / working-renter tenant base. Strengths: amenities A+, commute A+, cost of living A+; Watch: schools F, crime F, employment F.
- Detroit Public Schools Community District (urban): math 10% / reading 24% proficiency, ranked #499 of 540 in MI (top 92%) — low school quality limits family demand, transient renter base, plan for 1-2y turnover; 90% free/reduced lunch — lower-income household profile, screen leases tightly.
- Market conditions: 26 active listings in the ZIP; 11 comparable units currently listed for rent nearby; rentals at typical pace (median 18d on market — plan ~3-4 weeks tenant-placement turnaround); 2,639 units permitted in Wayne County in 2024 (1,216 in 5+ unit buildings).
Forward outlook
- In year one you build about $872 of equity ($754 loan paydown + $118 appreciation (0.1% local appreciation)).
- Wayne County population projected at -17% by 2050 — secular population decline; favor cash flow + early exit over multi-decade hold.
- At projected returns (0.1% appreciation + 3.0% rent growth), your $31k cash investment doubles in ~7 years — after that, you're playing with house money.
Negotiation context
- Only 10 days on market — expect competitive offers; lowballing is unlikely to land.
- 2 sale attempts with the ask held roughly flat each time — persistent listings suggest the price (not the market) is what's stuck; bring a comps-based counter.
Risks & watch-outs
- Watch-outs: built in 1923 — expect roof / HVAC / electrical / plumbing capex.
Questions for the listing agent
- Built in 1923 — when were the roof, HVAC, electrical panel, plumbing, and water heater last replaced?
- Is there a deadline driving the sale (1031 exchange, divorce, estate, relocation)? That informs how much negotiation room exists.
- Schools are F-rated, which usually means shorter tenancies and higher turnover. Who's the typical renter profile here, and what's been the actual vacancy rate?
- Crime grade is F in this area — have there been break-ins, vandalism, or insurance claims at this property in the last 3 years? What carrier currently insures it and at what premium?
- What's the average days-on-market for RENTAL listings here right now (not sales)? A rising rental-DOM trend means longer vacancies and softer asking-rent achievability than the comps imply.
- What's the recent tenant-quality profile in this submarket — average credit score on applications, eviction rate, late-payment / NSF rate, and stable-employment percentage? A property-management company in the area should have these aggregated.
- How much new for-sale + rental construction is in the pipeline within 1–3 miles? Heavy new supply typically softens prices + rents 12–24 months out; constrained supply supports both.
Investment metrics
- 1% rule
- 1.20% ✓
- Cap rate
- 8.67%
- Cash-on-cash
- 8.51%
- DSCR
- 1.38
- GRM
- 7.0
CMA / ARV
- ARV (on-the-fly)
- $116,550
- Comps found
- 12
Show comp detail 12 sales within ~0.75 mi
| Address | Dist | Beds/Ba | Sqft | Sold | Price | $/sf | Match |
|---|---|---|---|---|---|---|---|
| 12901 Visger St | 0.43mi | 3/1.0 | 862 (-7%) | 1mo | $85,000 | $99 | 68 |
| 3027 Bassett St | 0.52mi | 3/1.0 | 962 (+4%) | 3mo | $55,000 | $57 | 67 |
| 1312 Ferris Ave | 0.62mi | 3/1.5 | 930 (+0%) | 4mo | $117,000 | $126 | 65 |
| 1260 Marion Ave | 0.58mi | 3/1.0 | 874 (-6%) | 1mo | $155,000 | $177 | 63 |
| 2544 S Beatrice St | 0.62mi | 3/1.0 | 956 (+3%) | 3mo | $115,000 | $120 | 63 |
| 1368 Wilson Ave | 0.73mi | 3/1.0 | 912 (-1%) | 5mo | $165,000 | $181 | 60 |
| 2906 S Ethel St | 0.53mi | 2/1.0 (-1) | 892 (-4%) | 6mo | $67,800 | $76 | 60 |
| 2900 S Ethel St | 0.53mi | 2/1.0 (-1) | 892 (-4%) | 6mo | $67,800 | $76 | 60 |
| 1383 Cicotte Ave | 0.66mi | 3/1.0 | 850 (-8%) | 6mo | $135,000 | $159 | 50 |
| 1587 Reo Ave | 0.59mi | 3/1.0 | 816 (-12%) | 5mo | $122,000 | $150 | 49 |
| 4134 17th St | 0.64mi | 3/2.0 | 822 (-11%) | 5mo | $59,000 | $72 | 44 |
| 1565 University Ave | 0.72mi | 3/1.0 | 816 (-12%) | 7mo | $120,000 | $147 | 41 |
Match score weights: distance 35% · size 25% · config 20% · recency 20%. Top-matched comps best support the ARV.
Projected returns pro-forma
0.11% appreciation · 3.0% rent growth · sell at horizon
- IRR
- 7.6%
- Equity multiple
- 1.37×
- Total profit
- $11,204
- Equity at exit
- $32,242
- IRR
- 12.6%
- Equity multiple
- 2.40×
- Total profit
- $42,661
- Equity at exit
- $39,232
Cash invested: $30,520 (down + closing). Projections, not guarantees.
Landlord ↔ Tenant lean methodology
- Overall (STATE)
- 62 Landlord-Friendly
- State Michigan
- 62 Landlord-Friendly · EVEN
- County
- — inherits STATE
- City
- — inherits STATE
ZIP-level market 48217
- Home prices YoY
- 0.0%
- Active inventory
- 26
- Price-to-rent
- 7.0×
Monthly cashflow live
- Estimated rent
- $1,304 high interval (Pro) →
- Mortgage (P&I)
- −$572
- Tax from tax record
- −$197 /mo · $2,364/yr
- Insurance
- −$45
- HOA
- −$0
- Vacancy / Maint / Mgmt
- −$274
- Net cashflow
- $216
Break-even live
Sensitivity live
| Price | -10% $278 | -5% $247 | +0% $216 | +5% $185 | +10% $155 |
|---|---|---|---|---|---|
| Rent | -10% $113 | -5% $165 | +0% $216 | +5% $268 | +10% $319 |
| Rate | -1.0pp $271 | -0.5pp $244 | base $216 | +0.5pp $188 | +1.0pp $159 |
UW: 25.0% down · 7.5% · 30yr · 1.5% tax · 5.0% vac · 8.0% maint · 8.0% mgmt
Financing live
Cash to close
- Down payment
- $27,250
- Closing costs
- $3,270
- Reserves months
- —
- Total cash needed
- —
Loan-product check · same deal, 3 products live
Conventional
25% down · 7.5% · 30yr
- Down + closing
- —
- Monthly P&I
- —
- Monthly cashflow
- —
- DSCR
- —
- Eligible?
- —
Personal DTI + credit; lowest rate.
DSCR
20% down · 8.5% · 30yr
- Down + closing
- —
- Monthly P&I
- —
- Monthly cashflow
- —
- DSCR
- —
- Eligible?
- —
No personal income docs; deal must DSCR.
Hard money
10% down · 12.0% · 12mo
- Down + closing
- —
- Monthly P&I
- —
- Monthly cashflow
- —
- DSCR
- —
- Eligible?
- —
Short-term bridge; refi at stabilization.
Rent comps 11 comps
| Address | Beds | Baths | Sqft | Rent | $/sqft | DOM | Units | Dist |
|---|---|---|---|---|---|---|---|---|
| 3575 S Ethel St Detroit, MI | 3.0 | 1.0 | 894 | $1,350 | $1.51 | 18d | 1 | 0.41mi |
| 1524 Cicotte Ave Lincoln Park, MI | 2.0 | 1.0 | 900 | $1,250 | $1.39 | 15d | 1 | 0.70mi |
| 1774 Council Ave Lincoln Park, MI | 3.0 | 1.0 | 864 | $1,500 | $1.74 | 0d | 1 | 0.75mi |
| 3748 15th St Ecorse, MI | 2.0 | 1.0 | 528 | $1,099 | $2.08 | 17d | 1 | 0.77mi |
| 1537 Chandler Ave Lincoln Park, MI | 2.0 | 1.0 | 725 | $1,100 | $1.52 | 18d | 1 | 0.81mi |
| 1774 College Ave Lincoln Park, MI | 3.0 | 1.0 | 944 | $1,525 | $1.62 | 0d | 1 | 0.84mi |
| 1331 Pingree Ave Lincoln Park, MI | 2.0 | 1.0 | 725 | $1,300 | $1.79 | 0d | 1 | 0.86mi |
| 875 Raupp Pl Unit 2 Lincoln Park, MI | 2.0 | 1.0 | 800 | $970 | $1.21 | 17d | 1 | 0.88mi |
| 1532 Euclid St #1 Lincoln Park, MI | 2.0 | 1.0 | 850 | $1,450 | $1.71 | 25d | 1 | 0.89mi |
| 1581 Empire Ave Lincoln Park, MI | 2.0 | 1.0 | 900 | $1,350 | $1.50 | 25d | 1 | 1.03mi |
| 1552 Hanover St Lincoln Park, MI | 2.0 | 1.0 | 800 | $1,250 | $1.56 | 25d | 1 | 1.14mi |
Listing history 8 events
-
2026-06-21days on market $109,000 Active 10 DOM
-
2026-06-18days on market $109,000 Active 7 DOM
-
2026-06-17days on market $109,000 Active 6 DOM
-
2026-06-16days on market $109,000 Active 5 DOM
-
2026-06-15days on market $109,000 Active 4 DOM
-
2026-06-13days on market $109,000 Active 2 DOM
-
2026-06-13remarks 693-char remark
-
2026-06-13$109,000 Active 1 DOM
ⓘ Source: listings_history table (triggers on properties + properties_extension) + one-shot
backfill from property_details.listing_events for pre-trigger history.
Tax reassessment forecast MI · Partial reset (capped growth)
- Current annual tax
- $2,364 · $197/mo
- Projected year-2 tax
- $2,364 · $197/mo
- Expected delta
- $0/yr ($0/mo · 0.0%)
ⓘ Screening estimate from a state-policy table — verify with the county assessor before closing.
Climate risk First Street
- Flood 1/10 Low FEMA zone X (unshaded) · 0% chance over 30 yrs
- Wildfire 1/10 Low
- Heat 3/10 Moderate 7 d/yr ≥97°F today · 15 d/yr by 30 yrs out
- Wind 2/10 Low
- Air quality 3/10 Moderate 2 unhealthy d/yr today · 4 by 30 yrs out
Nearby sold comps map
Loading sold comps map…
Walkable amenities ~0.75 mi
Loading nearby amenities…
Taxation est. · year 1
- Rental income
- $15,651
- − Mortgage interest
- −$6,106
- − Property taxes
- −$2,364
- − Insurance
- −$545
- − Repairs & maintenance
- −$1,252
- − Management
- −$1,252
- − Depreciation
- −$3,171
- Taxable income
- $961
- Est. tax owed @ 24.0%
- −$231
- After-tax cash flow
- $2,365/yr
For passive investors: Depreciation is non-cash, so a rental often shows a tax loss while cash-flowing — sheltering income. Rental losses are passive: they offset passive income freely, and up to $25,000/yr can offset ordinary (W-2) income if you actively participate and your MAGI is under $100k (phasing out to $0 by $150k); unused losses carry forward. On sale, claimed depreciation is recaptured at up to 25%, and gains may owe capital-gains tax (a 1031 exchange can defer both). Figures are a year-1 estimate at your 24.0% rate — not tax advice; consult a CPA.
Schools (NCES district)
- District
- Detroit Public Schools Community District
- NCES district ID
- 2601103
- Math proficiency
- 10% ▼ -2.00%
- Reading proficiency
- 24% ▲ 6.00%
- Median HH income
- $25,815
- Composite
- 13.06/100
- National rank
- #9564
- State rank
- #499 of 540 in MI
Livability — Detroit
- Score
- 73/100
- State rank
- #218
- US rank
- #5427
Category grades
Schools grade is shown separately in the Schools card above.
Census & demographics
- Census place
- Detroit, MI
- City population
- 572,865
- Population (ZIP)
- 6,437
Population outlook (Wayne County) Hauer SSP2
- Today (2025)
- 1,675,273 people
- By 2030
- 1,620,300 · -3.3%
- By 2040
- 1,502,341 · -10.3%
- By 2050
- 1,384,039 · -17.4%
- By 2075
- 1,124,592 · -32.9%
- By 2100
- 881,193 · -47.4%
Race, ethnicity, and origin ACS 2023
- Neighborhood character
- Predominantly Black (78%)
- Race & ethnicity
- Black 78% Hispanic / Latino 12% Two or more races 10% White 4%
- Hispanic origin (detail)
- Mexican 5% Dominican 4%
- Common ancestry
- Lithuanian 6% Romanian 1%
- Foreign-born
- 3% · Canada
- Languages at home
- 94% English-only · Spanish 6%
Political lean MEDSL · Wayne
- 2024 margin
- Strong D (+29.0) · D 62.7% · R 33.7% · Other 3.6%
- 2008→2024 swing
- -20.5pp toward R · 2008: 49.5pp · 2024: 29.0pp
- All cycles
- 2024: D+29.0 2020: D+38.1 2016: D+37.3 2012: D+46.9 2008: D+49.5
Not yet ingested
- Civics
- —
Market trends
- HPI YoY
- ▲ 0.11%
- Current HPI
- 366.479
- Rent YoY
- —
- Metro
- —
- State GDP YoY
- ▲ 1.37%
- F500 in state
- 28
Industry mix (Fortune 500 HQ in MI)
| Industry | F500 HQs | Revenue |
|---|---|---|
| Automotive Parts | 3 | $48B |
|
||
| Automotive | 2 | $372B |
|
||
| Chemicals | 1 | $45B |
|
||
| Automotive Retail | 1 | $29B |
|
||
| Healthcare / Medical Devices | 1 | $23B |
|
||
| Automotive Technology | 1 | $20B |
|
||
Price history
+9.5% since first listed3 events — show timeline
- 2026-06-11 Listed $109,000 MiRealSource-MiMLS
- 2026-06-11 Listed $109,000 REALCOMP
- 2023-06-20 Sold (Public Records) $99,500 Public Records
Property tax history
+9.6%/yrLatest (2025): $2,364 · +95.7% YoY. Source: county tax records.
Cash-flow waterfall
monthlySold comps — $/sqft
last 12 mo · ≤1 miLoading sold comps…