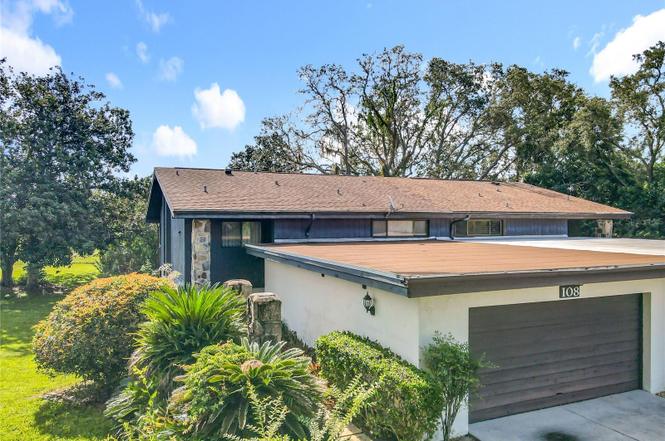
108 Canterbury Dr · Grenelefe, FL
Flood risk 1/10 · Minimal
- FEMA flood zone
- X (unshaded)
- Chance of flooding over 30 yrs
- 0.0%
- Est. flood insurance / yr
- $507 – $1,088
Fire risk 5/10 · Moderate
- Est. fire insurance / yr
- $947 – $1,759
Heat risk 8/10 · Major
- Hot days now (above 108°F)
- 7 days/yr
- Hot days in 30 yrs
- 22 days/yr
Wind risk 10/10 · Severe
- Chance of severe wind over 30 yrs
- 99.0%
Air-quality risk 2/10 · Minimal
- Unhealthy air days now
- 0 days/yr
- Unhealthy air days in 30 yrs
- 1 days/yr
Risk factors via First Street. Map © Google.
Why this score? — see what drove the D grade
The composite is a weighted blend of 9 inputs, each scored 0–100. Each bar is that input's sub-score; the figure is the points it added to the 100-point composite (weight × sub-score).
- Cash flow +13.0/30.0
- ARV discount +7.5/15.0
- 1% rule +4.3/10.0
- DSCR +3.9/10.0
- Schools +3.5/10.0
- Livability +3.2/5.0
- Rent growth +2.8/5.0
- Condition / age +2.5/5.0
- Appreciation +0.0/10.0
$200,000
🖨 Deal sheet 📄 Offer letter ✓ Due diligence
Listing remarks
Under contract-accepting backup offers. IF YOUR LOOKING FOR PEACE AND QUIET AND A SECURE AREA THAN COUNTRY HOMES IN GRENELEFE IS THE PLACE FOR YOU. THIS GATED COMMUNITY IS PERFECT TO ACHIEVE THOSE GOALS. WITH ITS LANDSCAPING AND TREES IT IS LIKE AN OASIS FROM THE STRESS OF EVERYDAY LIFE. THIS TOWNHOUSE IS LOCATED ON A STREET THAT DEAD ENDS FIVE HOUSE DOWN SO VERY LITTLE TRAFFIC. IT HAS AN UPPER AND LOWER FLOOR WITH THE UPPER MADE UP OF KITCHEN, LIVING ROOM/DININGROOM AND A WET BAR. ALSO HAS A OFFICE/DEN AND A HUGE DECK OVERLOOKING FLORIDA NATURE. THE LOWER FLOOR HAS 2 BEDROOM SUITES BOTH WITH WALKIN CLOSETS. IT COMES FURNISHED MINUS A WASHER AND DRYER SO READY TO MOVE INTO. MOVE THIS TO TOP
Key facts
- Gated community
- Wet bar
- Office den
Tags
Neighborhood map
What this means for you Summary
Snapshot
- This is a 2-bed/2.0-bath single-family listed at $200k.
Deal economics
- At list price, monthly cash flow is $-10 ($-117/yr) — negative.
- To cash-flow at today's rent, offer at most $198k (0.9% below list).
- To meet the 1% rule (rent ≥ 1% of price), the offer needs to be $186k (7.1% below list).
- Recommended offer: $176k (12.0% below list) — sets the bar for market timing.
Location & tenants
- Location reads 63/100 on livability (#728 in FL) — a middle-class / working-renter tenant base. Strengths: crime A+, cost of living A+, housing A+; Watch: schools D-, amenities F, commute F.
- Polk (suburban): math 39% / reading 43% proficiency, ranked #62 of 73 in FL (top 85%) — families likely to look elsewhere, expect single-tenant / working-renter base with shorter leases.
- Market conditions: Rents rising (+1.2%/yr); 1333 active listings in the ZIP; 6 comparable units currently listed for rent nearby; rentals at typical pace (median 24d on market — plan ~3-4 weeks tenant-placement turnaround); 10,384 units permitted in Polk County in 2024 (1,716 in 5+ unit buildings).
- This rent runs 35% of the median local income ($64k/yr) — at the standard rent-burdened threshold; future hikes will face affordability resistance.
Forward outlook
- Local home prices are declining (-3.0%/yr); year-one equity from $1k of loan paydown is wiped out by about $6k of value loss. Plan a longer hold.
- Polk County population projected at +33% by 2050 — long-run rental-demand tailwind backs the buy-and-hold thesis.
Negotiation context
- It's been on market 221 days — a 12% lower offer ($176k) is reasonable based on typical stale-listing flexibility.
- 3 sale attempts since 30y ago; this cycle's ask has dropped $59k (23%) from the opening price — seller is motivated, your offer sets the floor, not the list.
- Current owner paid $113k; list at $200k implies a 77% gain — meaningful room to come down on a strong offer.
Risks & watch-outs
- Climate carrying-cost: severe wind risk, 99% chance of damaging wind over 30y; moderate wildfire risk; extreme-heat days projected 7→22/yr by 2055 (HVAC capex compounding) — expect insurance premiums to compound above CPI over the hold.
Questions for the listing agent
- What do current leases actually rent for vs. the listed asking? Can we see a recent rent roll and the last 12 months of T-12 income?
- It's been on market 221 days. Have you received any prior offers? Is the seller open to a 12% concession, seller financing, or rate buy-down credit?
- What does the HOA fee cover, when was the last increase, and are there any pending special assessments or reserve-fund shortfalls?
- Why hasn't it sold? Are there any deal-killer items the seller is aware of (foundation, flood, title, zoning, code violations)?
- Is there a deadline driving the sale (1031 exchange, divorce, estate, relocation)? That informs how much negotiation room exists.
- Schools are D-rated, which usually means shorter tenancies and higher turnover. Who's the typical renter profile here, and what's been the actual vacancy rate?
- The area grade is low — what's the realistic commute time and amenity access for the typical tenant pool here? Any planned neighborhood developments (good or bad) we should know about?
- What's the average days-on-market for RENTAL listings here right now (not sales)? A rising rental-DOM trend means longer vacancies and softer asking-rent achievability than the comps imply.
- What's the recent tenant-quality profile in this submarket — average credit score on applications, eviction rate, late-payment / NSF rate, and stable-employment percentage? A property-management company in the area should have these aggregated.
- How much new for-sale + rental construction is in the pipeline within 1–3 miles? Heavy new supply typically softens prices + rents 12–24 months out; constrained supply supports both.
Investment metrics
- 1% rule
- 0.93% ✗
- Cap rate
- 6.23%
- Cash-on-cash
- -0.21%
- DSCR
- 0.99
- GRM
- 9.0
CMA / ARV
No comps found within radius.
Projected returns pro-forma
-3.0% appreciation · 1.16% rent growth · sell at horizon
- IRR
- -18.8%
- Equity multiple
- 0.35×
- Total profit
- $-36,320
- Equity at exit
- $29,821
- IRR
- -15.8%
- Equity multiple
- 0.19×
- Total profit
- $-45,430
- Equity at exit
- $17,292
Cash invested: $56,000 (down + closing). Projections, not guarantees.
Landlord ↔ Tenant lean methodology
- Overall (STATE)
- 87 Strongly Landlord-Friendly
- State Florida
- 87 Strongly Landlord-Friendly · R+3
- County
- — inherits STATE
- City
- — inherits STATE
ZIP-level market 33844
- Home prices YoY
- -26.7%
- Rents YoY
- 1.2%
- Active inventory
- 1333
- Price-to-rent
- 9.0×
Monthly cashflow live
- Estimated rent
- $1,857 high interval (Pro) →
- Mortgage (P&I)
- −$1,049
- Tax from tax record
- −$283 /mo · $3,394/yr
- Insurance
- −$83
- HOA
- −$62
- Vacancy / Maint / Mgmt
- −$390
- Net cashflow
- $-10
Break-even live
UW: 25.0% down · 7.5% · 30yr · 1.5% tax · 5.0% vac · 8.0% maint · 8.0% mgmt
Financing live
Cash to close
- Down payment
- $50,000
- Closing costs
- $6,000
- Reserves months
- —
- Total cash needed
- —
Loan-product check · same deal, 3 products live
Conventional
25% down · 7.5% · 30yr
- Down + closing
- —
- Monthly P&I
- —
- Monthly cashflow
- —
- DSCR
- —
- Eligible?
- —
Personal DTI + credit; lowest rate.
DSCR
20% down · 8.5% · 30yr
- Down + closing
- —
- Monthly P&I
- —
- Monthly cashflow
- —
- DSCR
- —
- Eligible?
- —
No personal income docs; deal must DSCR.
Hard money
10% down · 12.0% · 12mo
- Down + closing
- —
- Monthly P&I
- —
- Monthly cashflow
- —
- DSCR
- —
- Eligible?
- —
Short-term bridge; refi at stabilization.
Rent comps 6 comps
| Address | Beds | Baths | Sqft | Rent | $/sqft | DOM | Units | Dist |
|---|---|---|---|---|---|---|---|---|
| 20 Nottingham Way Haines City, FL | 2.0 | 2.0 | 2295 | $1,950 | $0.85 | 23d | 1 | 0.18mi |
| 167 Palm View Ct Haines City, FL | 1.0 | 1.0 | 1226 | $999 | $0.81 | 23d | 1 | 0.66mi |
| 8 Huntley Ct Unit 8 Haines City, FL | 2.0 | 2.0 | 1267 | $1,600 | $1.26 | 23d | 1 | 1.11mi |
| 2837 Pond View Dr Haines City, FL | 3.0 | 2.0 | 1739 | $1,985 | $1.14 | 23d | 1 | 1.22mi |
| 157 Coventry Cir Haines City, FL | 2.0 | 2.0 | 1226 | $1,995 | $1.63 | 3d | 1 | 1.22mi |
| 1155 Shady Cove Rd E Haines City, FL | 3.0 | 2.0 | 1792 | $1,850 | $1.03 | 23d | 1 | 1.43mi |
HOA detail
- Monthly dues
- $62 · $744/yr
- Likely covers
- landscapingsecurity
Listing history 12 events
-
2026-03-27status Pending
-
2026-03-21price $200,000
-
2026-02-16price $219,000
-
2025-12-15price $229,000
-
2025-10-29price $245,000
-
2025-09-11status Active
-
2025-08-30status Pending
-
2025-08-06$259,000 Active
-
1999-02-10soldstatus $113,000
-
1997-01-26historical
-
1996-08-26$145,000
-
1986-12-01soldstatus $115,000
ⓘ Source: listings_history table (triggers on properties + properties_extension) + one-shot
backfill from property_details.listing_events for pre-trigger history.
Tax reassessment forecast FL · Resets to sale price
- Current annual tax
- $3,394 · $283/mo
- Projected year-2 tax
- $3,394 · $283/mo
- Expected delta
- $0/yr ($0/mo · 0.0%)
ⓘ Screening estimate from a state-policy table — verify with the county assessor before closing.
Climate risk First Street
- Flood 1/10 Low FEMA zone X (unshaded) · 0% chance over 30 yrs
- Wildfire 5/10 Major
- Heat 8/10 Severe 7 d/yr ≥108°F today · 22 d/yr by 30 yrs out
- Wind 10/10 Extreme 99% chance of damaging wind over 30 yrs
- Air quality 2/10 Low 0 unhealthy d/yr today · 1 by 30 yrs out
Nearby sold comps map
Loading sold comps map…
Walkable amenities ~0.75 mi
Loading nearby amenities…
Taxation est. · year 1
- Rental income
- $22,287
- − Mortgage interest
- −$11,203
- − Property taxes
- −$3,394
- − Insurance
- −$1,000
- − Repairs & maintenance
- −$1,783
- − Management
- −$1,783
- − HOA
- −$744
- − Depreciation
- −$5,818
- Taxable loss
- −$3,438
- Est. tax savings @ 24.0%
- +$825
- After-tax cash flow
- $708/yr
For passive investors: Depreciation is non-cash, so a rental often shows a tax loss while cash-flowing — sheltering income. Rental losses are passive: they offset passive income freely, and up to $25,000/yr can offset ordinary (W-2) income if you actively participate and your MAGI is under $100k (phasing out to $0 by $150k); unused losses carry forward. On sale, claimed depreciation is recaptured at up to 25%, and gains may owe capital-gains tax (a 1031 exchange can defer both). Figures are a year-1 estimate at your 24.0% rate — not tax advice; consult a CPA.
Schools (NCES district)
- District
- Polk
- NCES district ID
- 1201590
- Math proficiency
- 39% ▼ -11.00%
- Reading proficiency
- 43% ▼ -4.00%
- Median HH income
- $43,979
- Composite
- 34.74/100
- National rank
- #5132
- State rank
- #62 of 73 in FL
Livability — Grenelefe
- Score
- 63/100
- State rank
- #728
- US rank
- #15600
Category grades
Schools grade is shown separately in the Schools card above.
Census & demographics
- Census place
- Grenelefe, FL
- County
- Polk County · 740,051 people
- Metro
- Lakeland-Winter Haven, FL
- Population (ZIP)
- 51,255
- Household income
- $63,650
- Rent vs Own
- Severe rent burden
- 1107.0
Population outlook (Polk County) Hauer SSP2
- Today (2025)
- 752,975 people
- By 2030
- 804,621 · +6.9%
- By 2040
- 906,117 · +20.3%
- By 2050
- 1,000,476 · +32.9%
- By 2075
- 1,197,520 · +59.0%
- By 2100
- 1,271,518 · +68.9%
Race, ethnicity, and origin ACS 2023
- Neighborhood character
- Diverse neighborhood (Simpson 0.64)
- Race & ethnicity
- Hispanic / Latino 48% White 31% Black 18% Two or more races 12% Asian 1%
- Hispanic origin (detail)
- Mexican 19% Puerto Rican 19% Cuban 1% Dominican 3%
- Common ancestry
- Hispanic 4% Lithuanian 1% Romanian 1%
- Foreign-born
- 15% · Canada, Jamaica, Guatemala
- Languages at home
- 55% English-only · Spanish 39% French/Haitian/Cajun 4% Other Indo-European 0%
Political lean MEDSL · Polk
- 2024 margin
- Strong R (+20.7) · D 39.2% · R 59.9%
- 2008→2024 swing
- -14.6pp toward R · 2008: -6.1pp · 2024: -20.7pp
- All cycles
- 2024: R+20.7 2020: R+14.4 2016: R+14.1 2012: R+6.8 2008: R+6.1
Not yet ingested
- Civics
- —
Market trends
- HPI YoY
- ▼ -105.94%
- Current HPI
- 291.0798
- Rent YoY
- ▲ 1.16%
- Metro
- Lakeland-Winter Haven, FL
- State GDP YoY
- ▲ 3.28%
- F500 in state
- 36
Industry mix (Fortune 500 HQ in FL)
| Industry | F500 HQs | Revenue |
|---|---|---|
| Industrial Technology | 2 | $29B |
|
||
| Insurance | 2 | $17B |
|
||
| Retail | 1 | $60B |
|
||
| Technology Distribution | 1 | $58B |
|
||
| Homebuilding | 1 | $35B |
|
||
| Technology Manufacturing | 1 | $35B |
|
||
Price history
+73.9% since first listed12 events — show timeline
- 2026-03-27 Pending — Stellar MLS as Distributed by MLS Grid
- 2026-03-21 Price Changed $200,000 Stellar MLS as Distributed by MLS Grid
- 2026-02-16 Price Changed $219,000 Stellar MLS as Distributed by MLS Grid
- 2025-12-15 Price Changed $229,000 Stellar MLS as Distributed by MLS Grid
- 2025-10-29 Price Changed $245,000 Stellar MLS as Distributed by MLS Grid
- 2025-09-11 Relisted — Stellar MLS as Distributed by MLS Grid
- 2025-08-30 Pending — Stellar MLS as Distributed by MLS Grid
- 2025-08-06 Listed $259,000 Stellar MLS as Distributed by MLS Grid
- 1999-02-10 Sold (Public Records) $113,000 Public Records
- 1997-01-26 Listing Removed — REALCOMP
- 1996-08-26 Listed $145,000 REALCOMP
- 1986-12-01 Sold (Public Records) $115,000 Public Records
Property tax history
+8.8%/yrLatest (2025): $3,394 · +5.7% YoY. Source: county tax records.
Cash-flow waterfall
monthlySold comps — $/sqft
last 12 mo · ≤1 miLoading sold comps…