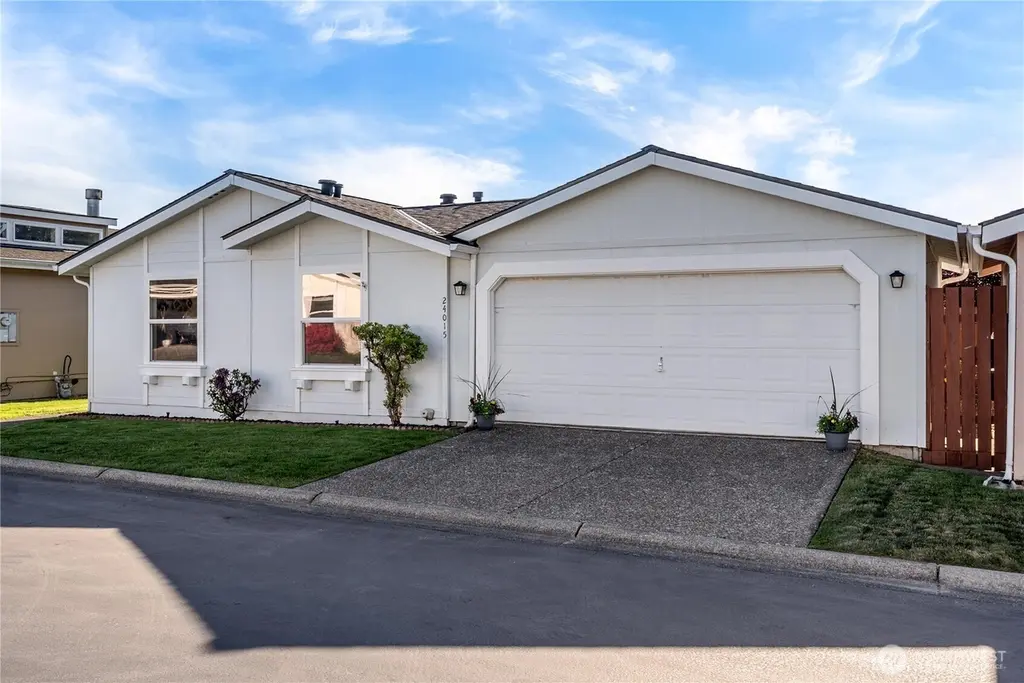
24015 222nd Ave SE #53 · Maple Valley, WA
Flood risk 1/10 · Minimal
- FEMA flood zone
- X (unshaded)
- Chance of flooding over 30 yrs
- 0.0%
- Est. flood insurance / yr
- $507 – $1,088
Fire risk 3/10 · Minor
- Est. fire insurance / yr
- $604 – $1,122
Heat risk 3/10 · Minor
- Hot days now (above 87°F)
- 8 days/yr
- Hot days in 30 yrs
- 17 days/yr
Wind risk 1/10 · Minimal
- Chance of severe wind over 30 yrs
- —
Air-quality risk 7/10 · Major
- Unhealthy air days now
- 11 days/yr
- Unhealthy air days in 30 yrs
- 16 days/yr
Risk factors via First Street. Map © Google.
Why this score? — see what drove the C- grade
The composite is a weighted blend of 9 inputs, each scored 0–100. Each bar is that input's sub-score; the figure is the points it added to the 100-point composite (weight × sub-score).
- Cash flow +15.7/30.0
- ARV discount +9.1/15.0
- Schools +6.6/10.0
- DSCR +4.8/10.0
- Livability +4.2/5.0
- 1% rule +4.1/10.0
- Rent growth +3.2/5.0
- Condition / age +2.5/5.0
- Appreciation +0.0/10.0
$498,990
🖨 Deal sheet 📄 Offer letter ✓ Due diligence
Listing remarks
Beautiful light bright & updated. New roof, updated kitchen, baths, appliances and fixtures, freshly painted interiors and recently painted exterior, real hardwood floors, new carpet and durable rigid core vinyl tile. Updated trim, counter tops and outlets. Highly desirable Maple Valley location; Walk to all amenities- Lake Wilderness park, golf course, arboretum, trails. Enjoy social gatherings at the Maple Valley community center, Walk to Wilderness village for morning coffee, convenient shopping and pharmacy pick up. Several top-rated medical facilities nearby and a plethora of community events and services. Just a short drive to scenic Mt Rainier, major commuter routes and abundan
Key facts
- Updated appliances
- Updated baths
- Real hardwood floors
Tags
Property features AI
Finance
- Other: On-market date: May 14, 2026; Building name: Lake Wilderness Villa; Calculated living area: 1530 square feet; Unit is on the first floor; Bus line nearby
- Financial info: Financing accepted: Cash, Conventional, FHA, VA
- HOA & community: Monthly HOA fee of $118; HOA covers common area maintenance, lawn service, road maintenance and snow removal; Community amenities include clubhouse, game/rec room, athletic court, garden space, RV parking and gated entry; Age-restricted / senior community; Pets allowed (cats and dogs); 152 units in community
Exterior
- Parking: 2 covered spaces; 1 uncovered space; Individual garage; Off-street parking; RV parking available
- Security: Security gate; Gated community
- Utilities: Water service: Cedar River; Power: PSE; Sewer: Soos Creek; Gas water heater; Cable: Xfinity; Internet: Xfinity
- Home design: Detached condominium (manufactured double wide); One story; Main entry
- Construction: Cement plank construction; Composition roof; Manufactured house (double wide); Remodeled/updated
- Exterior features: Cement planked exterior; Balcony/deck/patio; Yard; Curbs, paved streets and sidewalk; Ground-floor unit; Unit has a view
Interior
- Kitchen: Dishwasher; Refrigerator; Stove/Range; Ice maker
- Bedrooms: 3 bedrooms (all on main level)
- Flooring: Hardwood; Laminate; Vinyl; Carpet
- Bathrooms: 2 full bathrooms; Bathtub(s) and shower(s) included; Jetted/soaking tub (unit feature)
- Heating & cooling: Forced air heating; Central air conditioning; Natural gas energy source
- Interior features: Vaulted ceilings; Ice maker; Water heater; Insulated windows; Cooking gas
- Laundry & utility: Washer hookup; Electric dryer hookup; Washer and dryer hookups available
Neighborhood map
What this means for you Summary
Snapshot
- This is a 3-bed/2.0-bath condo listed at $499k.
Deal economics
- At list price, monthly cash flow is $220 ($3k/yr) — positive.
- The deal already cash-flows at list — no discount required.
- To meet the 1% rule (rent ≥ 1% of price), the offer needs to be $456k (8.5% below list).
- Recommended offer: $456k (8.5% below list) — sets the bar for 1% rule.
- Cap rate 6.8% vs local median 3.2% in Maple Valley — top-decile yield for the area; either an underpriced asset or a hidden risk that comps aren't pricing in. Stress-test before assuming the spread holds.
Location & tenants
- Location reads 85/100 on livability (#24 in WA, #461 nationally) — a professional / high-income tenant draw. Strengths: schools A+, employment A+, housing A+; Watch: cost of living F.
- Tahoma School District (suburban): math 68% / reading 76% proficiency, ranked #10 of 291 in WA (top 3%) — strong family-tenant draw, lease renewals of 3-5y typical; only 11% free/reduced lunch — higher-income household profile.
- Market conditions: Rents rising (+2.8%/yr); 221 active listings in the ZIP; 4 comparable units currently listed for rent nearby; rentals lingering (median 44d on market — plan ~5-8 weeks vacancy on turnover, expect pricing pressure); 50% of comp listings sitting > 30 days — soft ceiling on asking rent; high-income renter base; 10,555 units permitted in King County in 2024 (7,119 in 5+ unit buildings).
- This rent runs 36% of the median local income ($152k/yr) — at the standard rent-burdened threshold; future hikes will face affordability resistance.
Forward outlook
- Local home prices are declining (-3.0%/yr); year-one equity from $3k of loan paydown is wiped out by about $15k of value loss. Plan a longer hold.
- King County population projected at +44% by 2050 — long-run rental-demand tailwind backs the buy-and-hold thesis.
Negotiation context
- It's been on market 29 days — a 2% lower offer ($492k) is reasonable based on typical stale-listing flexibility.
- 3 sale attempts since 9y ago with the ask held roughly flat each time — persistent listings suggest the price (not the market) is what's stuck; bring a comps-based counter.
- Current owner paid $315k; list at $499k implies a 58% gain — meaningful room to come down on a strong offer.
Questions for the listing agent
- What does the HOA fee cover, when was the last increase, and are there any pending special assessments or reserve-fund shortfalls?
- Any open or pending special assessments — roof, HVAC, plumbing, elevator, façade? What's the per-unit balance and payoff schedule, and is the seller paying it off at close or rolling it to the buyer?
- Is there a deadline driving the sale (1031 exchange, divorce, estate, relocation)? That informs how much negotiation room exists.
- Schools are A-rated — typically a magnet for longer-tenancy family renters. What's the average tenant stay here, and is there a school-zone premium baked into asking?
- What's the average days-on-market for RENTAL listings here right now (not sales)? A rising rental-DOM trend means longer vacancies and softer asking-rent achievability than the comps imply.
- What's the recent tenant-quality profile in this submarket — average credit score on applications, eviction rate, late-payment / NSF rate, and stable-employment percentage? A property-management company in the area should have these aggregated.
- How much new apartment / multifamily construction is in the pipeline within 1–3 miles? Heavy new supply (>2% of stock underway) typically softens rents 12–24 months out; light construction supports rent growth.
Investment metrics
- 1% rule
- 0.91% ✗
- Cap rate
- 6.82%
- Cash-on-cash
- 1.89%
- DSCR
- 1.08
- GRM
- 9.1
CMA / ARV
- ARV (median comp)
- $517,098
- List price
- $498,990
- Delta
- -3.50%
- Verdict
- FAIR
- Comps
- 5 within 1.0 mi
Projected returns pro-forma
-3.0% appreciation · 2.76% rent growth · sell at horizon
- IRR
- -13.6%
- Equity multiple
- 0.51×
- Total profit
- $-67,905
- Equity at exit
- $74,401
- IRR
- -5.0%
- Equity multiple
- 0.67×
- Total profit
- $-45,442
- Equity at exit
- $43,144
Cash invested: $139,717 (down + closing). Projections, not guarantees.
Landlord ↔ Tenant lean methodology
- Overall (STATE)
- 28 Tenant-Leaning
- State Washington
- 28 Tenant-Leaning · D+8
- County
- — inherits STATE
- City
- — inherits STATE
ZIP-level market 98038
- Rents YoY
- 2.8%
- Active inventory
- 221
- Price-to-rent
- 9.1×
Monthly cashflow live
- Estimated rent
- $4,564 medium interval (Pro) →
- Mortgage (P&I)
- −$2,617
- Tax from tax record
- −$442 /mo · $5,309/yr
- Insurance
- −$208
- HOA
- −$118
- Vacancy / Maint / Mgmt
- −$958
- Net cashflow
- $220
Break-even live
UW: 25.0% down · 7.5% · 30yr · 1.5% tax · 5.0% vac · 8.0% maint · 8.0% mgmt
Financing live
Cash to close
- Down payment
- $124,748
- Closing costs
- $14,970
- Reserves months
- —
- Total cash needed
- —
Loan-product check · same deal, 3 products live
Conventional
25% down · 7.5% · 30yr
- Down + closing
- —
- Monthly P&I
- —
- Monthly cashflow
- —
- DSCR
- —
- Eligible?
- —
Personal DTI + credit; lowest rate.
DSCR
20% down · 8.5% · 30yr
- Down + closing
- —
- Monthly P&I
- —
- Monthly cashflow
- —
- DSCR
- —
- Eligible?
- —
No personal income docs; deal must DSCR.
Hard money
10% down · 12.0% · 12mo
- Down + closing
- —
- Monthly P&I
- —
- Monthly cashflow
- —
- DSCR
- —
- Eligible?
- —
Short-term bridge; refi at stabilization.
Rent comps 4 comps
| Address | Beds | Baths | Sqft | Rent | $/sqft | DOM | Units | Dist |
|---|---|---|---|---|---|---|---|---|
| 24212 224th Ave SE Unit 4 Maple Valley, WA | 2.0 | 2.0 | 1320 | $5,400 | $4.09 | 43d | 1 | 0.17mi |
| 24202 224th Ave SE Unit 3 Maple Valley, WA | 2.0 | 2.0 | 1320 | $5,400 | $4.09 | 43d | 1 | 0.18mi |
| 22435 SE 240th St Maple Valley, WA | 1.0–3.0 | 1.0–2.0 | 1004 | $2,725 | $2.71 | 1d | 5 | 0.29mi |
| 24116 235th Ave SE Maple Valley, WA | 3.0 | 3.0 | 1680 | $3,272 | $1.95 | 24d | 1 | 0.84mi |
HOA detail condo
- Monthly dues
- $118 · $1,416/yr
- Assessments
- None detected in remarks — confirm with the listing agent.
Listing history 19 events
-
2026-06-13statusdays on market $498,990 Pending 29 DOM
-
2026-06-09days on market $498,990 Active 26 DOM
-
2026-06-08days on market $498,990 Active 25 DOM
-
2026-06-07days on market $498,990 Active 24 DOM
-
2026-06-04days on market $498,990 Active 21 DOM
-
2026-06-03days on market $498,990 Active 20 DOM
-
2026-06-02days on market $498,990 Active 19 DOM
-
2026-06-01days on market $498,990 Active 18 DOM
-
2026-05-31days on market $498,990 Active 17 DOM
-
2026-05-14$498,990 Active
-
2026-05-14$498,990 Active
-
2017-04-14soldstatus $315,000
-
2017-03-18status Pending
-
2017-03-01status Pending Inspection
-
2017-02-27$320,000 Active
-
2017-02-27soldstatus $315,000 Sold
-
2006-12-08soldstatus $280,000
-
2001-05-31soldstatus $166,800
-
1998-03-05soldstatus $38,000
ⓘ Source: listings_history table (triggers on properties + properties_extension) + one-shot
backfill from property_details.listing_events for pre-trigger history.
Tax reassessment forecast WA · Resets to sale price
- Current annual tax
- $5,309 · $442/mo
- Projected year-2 tax
- $5,309 · $442/mo
- Expected delta
- $0/yr ($0/mo · 0.0%)
ⓘ Screening estimate from a state-policy table — verify with the county assessor before closing.
Climate risk First Street
- Flood 1/10 Low FEMA zone X (unshaded) · 0% chance over 30 yrs
- Wildfire 3/10 Moderate
- Heat 3/10 Moderate 8 d/yr ≥87°F today · 17 d/yr by 30 yrs out
- Wind 1/10 Low
- Air quality 7/10 Severe 11 unhealthy d/yr today · 16 by 30 yrs out
Nearby sold comps map
Loading sold comps map…
Walkable amenities ~0.75 mi
Loading nearby amenities…
Taxation est. · year 1
- Rental income
- $54,764
- − Mortgage interest
- −$27,951
- − Property taxes
- −$5,309
- − Insurance
- −$2,495
- − Repairs & maintenance
- −$4,381
- − Management
- −$4,381
- − HOA
- −$1,416
- − Depreciation
- −$14,516
- Taxable loss
- −$5,686
- Est. tax savings @ 24.0%
- +$1,365
- After-tax cash flow
- $4,007/yr
For passive investors: Depreciation is non-cash, so a rental often shows a tax loss while cash-flowing — sheltering income. Rental losses are passive: they offset passive income freely, and up to $25,000/yr can offset ordinary (W-2) income if you actively participate and your MAGI is under $100k (phasing out to $0 by $150k); unused losses carry forward. On sale, claimed depreciation is recaptured at up to 25%, and gains may owe capital-gains tax (a 1031 exchange can defer both). Figures are a year-1 estimate at your 24.0% rate — not tax advice; consult a CPA.
Schools (NCES district)
- District
- Tahoma School District
- NCES district ID
- 5308760
- Math proficiency
- 68% ▬ 0.00%
- Reading proficiency
- 76% ▬ 0.00%
- Median HH income
- $94,834
- Composite
- 66.41/100
- National rank
- #925
- State rank
- #10 of 291 in WA
Livability — Maple Valley
- Score
- 85/100
- State rank
- #24
- US rank
- #461
Category grades
Schools grade is shown separately in the Schools card above.
Census & demographics
- Census place
- Maple Valley, WA
- County
- King County · 2,251,916 people
- City population
- 37,324
- Metro
- Seattle-Tacoma-Bellevue, WA
- Population (ZIP)
- 37,324
- Household income
- $152,261
- Rent vs Own
- Severe rent burden
- 580.0
Population outlook (King County) Hauer SSP2
- Today (2025)
- 2,576,485 people
- By 2030
- 2,803,316 · +8.8%
- By 2040
- 3,255,921 · +26.4%
- By 2050
- 3,706,444 · +43.9%
- By 2075
- 4,746,063 · +84.2%
- By 2100
- 5,407,730 · +109.9%
Race, ethnicity, and origin ACS 2023
- Neighborhood character
- Predominantly White (73%)
- Race & ethnicity
- White 73% Asian 10% Two or more races 9% Hispanic / Latino 6% Black 2%
- Hispanic origin (detail)
- Mexican 3%
- Common ancestry
- Portuguese 5% Italian 4% Romanian 3%
- Foreign-born
- 13% · Canada, China, South Korea
- Languages at home
- 86% English-only · Other Asian/Pacific 4% Russian/Polish/Slavic 3% Other Indo-European 2%
Political lean MEDSL · King
- 2024 margin
- Solid D (+51.7) · D 74.2% · R 22.5% · Other 3.4%
- 2008→2024 swing
- +9.6pp toward D · 2008: 42.1pp · 2024: 51.7pp
- All cycles
- 2024: D+51.7 2020: D+52.7 2016: D+50.4 2012: D+39.9 2008: D+42.1
Not yet ingested
- Civics
- —
Market trends
- HPI YoY
- ▼ -588.79%
- Current HPI
- 310.7428
- Rent YoY
- ▲ 2.76%
- Metro
- Seattle-Tacoma-Bellevue, WA
- State GDP YoY
- ▲ 4.65%
- F500 in state
- 22
Industry mix (Fortune 500 HQ in WA)
| Industry | F500 HQs | Revenue |
|---|---|---|
| Retail | 2 | $269B |
|
||
| Technology / Retail | 1 | $638B |
|
||
| Technology | 1 | $245B |
|
||
| Telecommunications | 1 | $38B |
|
||
| Food / Beverage | 1 | $36B |
|
||
| Automotive / Trucks | 1 | $34B |
|
||
Price history
+1213.1% since first listed12 events — show timeline
- 2026-06-12 Pending — NWMLS as Distributed by MLS Grid
- 2026-06-12 Pending — NWMLS as Distributed by MLS Grid
- 2026-05-14 Listed $498,990 NWMLS as Distributed by MLS Grid
- 2026-05-14 Listed $498,990 NWMLS as Distributed by MLS Grid
- 2017-04-14 Sold (Public Records) $315,000 Public Records
- 2017-03-18 Pending — NWMLS as Distributed by MLS Grid
- 2017-03-01 Pending — NWMLS as Distributed by MLS Grid
- 2017-02-27 Listed $320,000 NWMLS as Distributed by MLS Grid
- 2017-02-27 Sold (MLS) $315,000 NWMLS as Distributed by MLS Grid
- 2006-12-08 Sold (Public Records) $280,000 Public Records
- 2001-05-31 Sold (Public Records) $166,800 Public Records
- 1998-03-05 Sold (Public Records) $38,000 Public Records
Property tax history
+4.4%/yrLatest (2025): $5,309 · +3.0% YoY. Source: county tax records.
Cash-flow waterfall
monthlySold comps — $/sqft
last 12 mo · ≤1 miLoading sold comps…