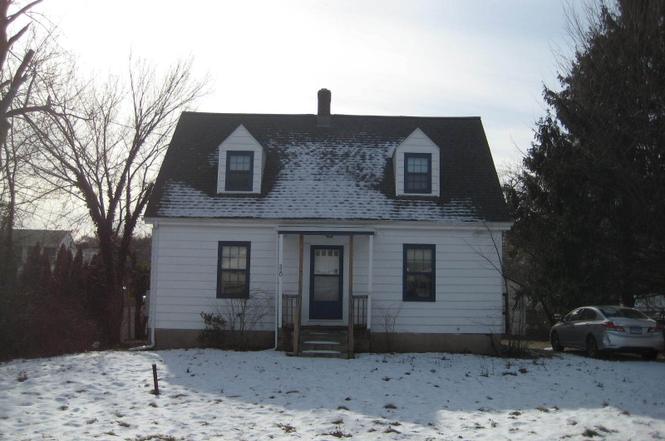
320 Maple St · Branford Center, CT
Flood risk 1/10 · Minimal
- FEMA flood zone
- X (unshaded)
- Chance of flooding over 30 yrs
- 0.0%
- Est. flood insurance / yr
- $473 – $860
Fire risk 1/10 · Minimal
- Est. fire insurance / yr
- $829 – $1,539
Heat risk 7/10 · Major
- Hot days now (above 95°F)
- 7 days/yr
- Hot days in 30 yrs
- 17 days/yr
Wind risk 6/10 · Moderate
- Chance of severe wind over 30 yrs
- 68.0%
Air-quality risk 4/10 · Minor
- Unhealthy air days now
- 5 days/yr
- Unhealthy air days in 30 yrs
- 7 days/yr
Risk factors via First Street. Map © Google.
Why this score? — see what drove the B- grade
The composite is a weighted blend of 9 inputs, each scored 0–100. Each bar is that input's sub-score; the figure is the points it added to the 100-point composite (weight × sub-score).
- Cash flow +26.2/30.0
- DSCR +8.9/10.0
- 1% rule +7.8/10.0
- ARV discount +7.5/15.0
- Rent growth +5.0/5.0
- Schools +4.2/10.0
- Livability +4.0/5.0
- Condition / age +2.5/5.0
- Appreciation +0.0/10.0
$219,900
🖨 Deal sheet 📄 Offer letter ✓ Due diligence
Listing remarks
Home is being cleaned out. Please be careful when entering the property, there is no electricity. The property is subject to Probate approval. The property is sold in as-is condition and inspections are for informational purposes only.
Key facts
- 0.4 acre lot
- Garage
- Built 1955
Neighborhood map
What this means for you Summary
Snapshot
- This is a 3-bed/1.5-bath single-family listed at $220k.
Deal economics
- At list price, monthly cash flow is $560 ($7k/yr) — positive.
- The deal already cash-flows at list — no discount required.
- Meets the 1% rule at list price ($3k rent vs $220k).
- Cap rate 9.4% vs local median 3.7% in Branford Center — top-decile yield for the area; either an underpriced asset or a hidden risk that comps aren't pricing in. Stress-test before assuming the spread holds.
Location & tenants
- Location reads 81/100 on livability (#16 in CT, #1,386 nationally) — a professional / high-income tenant draw. Strengths: crime A+, health & safety A+, housing B+; Watch: commute D+, cost of living D+.
- Branford School District (suburban): math 41% / reading 52% proficiency, ranked #85 of 153 in CT (top 56%) — families likely to look elsewhere, expect single-tenant / working-renter base with shorter leases; only 18% free/reduced lunch — higher-income household profile.
- Market conditions: Rents rising fast (+10.6%/yr); 114 active listings in the ZIP; 27 comparable units currently listed for rent nearby; rentals at typical pace (median 24d on market — plan ~3-4 weeks tenant-placement turnaround); 48% of comp listings sitting > 30 days — soft ceiling on asking rent; solid renter incomes; 1,059 units permitted in South Central Connecticut Planning Region in 2024 (779 in 5+ unit buildings).
- This rent runs 32% of the median local income ($105k/yr) — at the standard rent-burdened threshold; future hikes will face affordability resistance.
Forward outlook
- Local home prices are declining (-3.0%/yr); year-one equity from $2k of loan paydown is wiped out by about $7k of value loss. Plan a longer hold.
- At projected returns (-3.0% appreciation + 8.0% rent growth), your $62k cash investment doubles in ~7 years — after that, you're playing with house money.
Negotiation context
- Only 6 days on market — expect competitive offers; lowballing is unlikely to land.
Risks & watch-outs
- Watch-outs: built in 1955 — expect roof / HVAC / electrical / plumbing capex.
- Climate carrying-cost: major wind risk, 68% chance of damaging wind over 30y; extreme-heat days projected 7→17/yr by 2055 (HVAC capex compounding) — expect insurance premiums to compound above CPI over the hold.
Questions for the listing agent
- Built in 1955 — when were the roof, HVAC, electrical panel, plumbing, and water heater last replaced?
- Is there a deadline driving the sale (1031 exchange, divorce, estate, relocation)? That informs how much negotiation room exists.
- Schools are B-rated — typically a magnet for longer-tenancy family renters. What's the average tenant stay here, and is there a school-zone premium baked into asking?
- What's the average days-on-market for RENTAL listings here right now (not sales)? A rising rental-DOM trend means longer vacancies and softer asking-rent achievability than the comps imply.
- What's the recent tenant-quality profile in this submarket — average credit score on applications, eviction rate, late-payment / NSF rate, and stable-employment percentage? A property-management company in the area should have these aggregated.
- How much new for-sale + rental construction is in the pipeline within 1–3 miles? Heavy new supply typically softens prices + rents 12–24 months out; constrained supply supports both.
Investment metrics
- 1% rule
- 1.28% ✓
- Cap rate
- 9.35%
- Cash-on-cash
- 10.92%
- DSCR
- 1.49
- GRM
- 6.5
CMA / ARV
- ARV (on-the-fly)
- $471,900
- Comps found
- 12
Show comp detail 12 sales within ~0.75 mi
| Address | Dist | Beds/Ba | Sqft | Sold | Price | $/sf | Match |
|---|---|---|---|---|---|---|---|
| 10 Eli Yale Ter | 0.21mi | 3/1.5 | 1,456 (+2%) | 5mo | $399,000 | $274 | 83 |
| 7 Jourdan Rd | 0.16mi | 3/1.5 | 1,541 (+8%) | 8mo | $575,000 | $373 | 74 |
| 49 Stannard Ave | 0.44mi | 3/1.0 | 1,405 (-2%) | 1mo | $533,500 | $380 | 73 |
| 28 Short Beach Rd | 0.07mi | 2/1.0 (-1) | 1,488 (+4%) | 15mo | $455,000 | $306 | 71 |
| 17 Reynolds Ln | 0.31mi | 3/2.0 | 1,384 (-3%) | 13mo | $380,000 | $275 | 67 |
| 21 Berry Patch Rd | 0.08mi | 4/1.5 (+1) | 1,573 (+10%) | 18mo | $440,000 | $280 | 60 |
| 6 Reynolds Ave | 0.33mi | 3/1.0 | 1,508 (+6%) | 19mo | $425,000 | $282 | 58 |
| 11 Bryan Rd | 0.45mi | 3/2.0 | 1,564 (+9%) | 9mo | $637,500 | $408 | 54 |
| 10 Hammer Pl | 0.74mi | 4/1.5 (+1) | 1,311 (-8%) | 2mo | $450,000 | $343 | 45 |
| 11 Russell St | 0.67mi | 3/1.5 | 1,592 (+11%) | 8mo | $525,000 | $330 | 43 |
| 128 Burban Dr | 0.74mi | 3/2.0 | 1,300 (-9%) | 19mo | $450,000 | $346 | 32 |
| 48 Matthew Rd | 0.75mi | 3/1.5 | 1,216 (-15%) | 16mo | $400,000 | $329 | 26 |
Match score weights: distance 35% · size 25% · config 20% · recency 20%. Top-matched comps best support the ARV.
Projected returns pro-forma
-3.0% appreciation · 8.0% rent growth · sell at horizon
- IRR
- 5.9%
- Equity multiple
- 1.25×
- Total profit
- $15,094
- Equity at exit
- $32,788
- IRR
- 19.7%
- Equity multiple
- 3.07×
- Total profit
- $127,472
- Equity at exit
- $19,013
Cash invested: $61,572 (down + closing). Projections, not guarantees.
Landlord ↔ Tenant lean methodology
- Overall (STATE)
- 27 Tenant-Leaning
- State Connecticut
- 27 Tenant-Leaning · D+7
- County
- — inherits STATE
- City
- — inherits STATE
ZIP-level market 06405
- Rents YoY
- 10.6%
- Active inventory
- 114
- Price-to-rent
- 6.5×
Monthly cashflow live
- Estimated rent
- $2,820 high interval (Pro) →
- Mortgage (P&I)
- −$1,153
- Tax from tax record
- −$423 /mo · $5,071/yr
- Insurance
- −$92
- HOA
- −$0
- Vacancy / Maint / Mgmt
- −$592
- Net cashflow
- $560
Break-even live
UW: 25.0% down · 7.5% · 30yr · 1.5% tax · 5.0% vac · 8.0% maint · 8.0% mgmt
Financing live
Cash to close
- Down payment
- $54,975
- Closing costs
- $6,597
- Reserves months
- —
- Total cash needed
- —
Loan-product check · same deal, 3 products live
Conventional
25% down · 7.5% · 30yr
- Down + closing
- —
- Monthly P&I
- —
- Monthly cashflow
- —
- DSCR
- —
- Eligible?
- —
Personal DTI + credit; lowest rate.
DSCR
20% down · 8.5% · 30yr
- Down + closing
- —
- Monthly P&I
- —
- Monthly cashflow
- —
- DSCR
- —
- Eligible?
- —
No personal income docs; deal must DSCR.
Hard money
10% down · 12.0% · 12mo
- Down + closing
- —
- Monthly P&I
- —
- Monthly cashflow
- —
- DSCR
- —
- Eligible?
- —
Short-term bridge; refi at stabilization.
Rent comps 27 comps
| Address | Beds | Baths | Sqft | Rent | $/sqft | DOM | Units | Dist |
|---|---|---|---|---|---|---|---|---|
| 49 N Harbor St Unit 1 Branford, CT | 3.0 | 1.0 | 1118 | $2,150 | $1.92 | 44d | 1 | 0.46mi |
| 56 Maple St Branford, CT | 1.0–2.0 | 1.0–2.0 | 1083 | $4,100 | $3.79 | 2d | 6 | 0.58mi |
| 52 Maple St Unit 414 Branford, CT | 2.0 | 2.0 | 1029 | $3,700 | $3.60 | 44d | 1 | 0.59mi |
| 52 Maple St Unit 413 Branford, CT | 2.0 | 2.0 | 1332 | $4,800 | $3.60 | 44d | 1 | 0.59mi |
| 43-59 Briarwood Ln Branford, CT | 2.0 | 1.0 | 900 | $1,825 | $2.03 | 2d | 1 | 0.60mi |
| 57 Montoya Cir Branford, CT | 1.0–2.0 | 1.0–2.0 | 1180 | $2,698 | $2.29 | 2d | 1 | 0.61mi |
| 109 Florence Rd Unit A Branford, CT | 2.0 | 1.5 | 1240 | $2,300 | $1.85 | 23d | 1 | 0.66mi |
| 112 Montoya Dr Unit 112 Branford, CT | 2.0 | 2.0 | 1275 | $2,615 | $2.05 | 44d | 1 | 0.67mi |
| 1 Parker Memorial Dr Branford, CT | 3.0 | 1.5 | 1129 | $1,650 | $1.46 | 44d | 1 | 0.75mi |
| 40 Rogers St Unit 1 Branford, CT | 2.0 | 1.0 | 1081 | $2,400 | $2.22 | 44d | 1 | 0.81mi |
| 31 Brainerd Rd Unit 2 Branford, CT | 3.0 | 1.0 | 1250 | $2,500 | $2.00 | 10d | 1 | 0.82mi |
| 815 Main St Branford, CT | 3.0 | 1.5 | 1824 | $3,200 | $1.75 | 10d | 1 | 0.95mi |
| 30 Grove St Unit B Branford, CT | 2.0 | 1.0 | 900 | $1,825 | $2.03 | 44d | 1 | 0.98mi |
| 7 Mona Ave Unit 7 Branford, CT | 2.0 | 1.0 | 1000 | $2,200 | $2.20 | 44d | 1 | 1.02mi |
| 344 Monticello Dr #344 Branford, CT | 2.0 | 1.5 | 1419 | $2,500 | $1.76 | 21d | 1 | 1.07mi |
| 4 Turtle Bay Dr Branford, CT | 2.0 | 2.0 | 1289 | $5,750 | $4.46 | 23d | 1 | 1.18mi |
| 27 Gilbert Ln Branford, CT | 3.0 | 1.0 | 925 | $1,975 | $2.14 | 3d | 1 | 1.18mi |
| 15 Bradley Ave Branford, CT | 2.0 | 1.0 | 936 | $2,000 | $2.14 | 44d | 1 | 1.26mi |
| 14 Averill Pl Unit 8 Branford, CT | 2.0 | 1.0 | 1000 | $2,250 | $2.25 | 44d | 1 | 1.27mi |
| 53 Montowese St Unit 2 Branford, CT | 2.0 | 1.0 | 1000 | $2,550 | $2.55 | 3d | 1 | 1.27mi |
| 245 W Main St Unit 1 Branford, CT | 2.0 | 2.0 | 950 | $2,850 | $3.00 | 2d | 1 | 1.34mi |
| 322 Clark Ave Branford, CT | 2.0 | 2.0 | 960 | $2,500 | $2.60 | 2d | 1 | 1.39mi |
| 124 S Montowese St #10 Branford, CT | 3.0 | 2.0 | 1599 | $3,500 | $2.19 | 44d | 1 | 1.40mi |
| 155 W Main St Unit 2 Branford, CT | 3.0 | 1.5 | 1100 | $2,300 | $2.09 | 44d | 1 | 1.45mi |
| 58 Shore Dr Branford, CT | 2.0 | 1.5 | 1384 | $2,200 | $1.59 | 2d | 1 | 1.46mi |
| 45 Jefferson Pl Unit 15 Branford, CT | 2.0 | 1.0 | 900 | $1,999 | $2.22 | 2d | 1 | 1.46mi |
| 225 Clark Ave Branford, CT | 4.0 | 2.0 | 1712 | $4,700 | $2.75 | 44d | 1 | 1.50mi |
Listing history 2 events
-
2026-03-10status Under Contract
-
2026-03-04$219,900 Active
ⓘ Source: listings_history table (triggers on properties + properties_extension) + one-shot
backfill from property_details.listing_events for pre-trigger history.
Tax reassessment forecast CT · Partial reset (capped growth)
- Current annual tax
- $5,071 · $423/mo
- Projected year-2 tax
- $5,071 · $423/mo
- Expected delta
- $0/yr ($0/mo · 0.0%)
ⓘ Screening estimate from a state-policy table — verify with the county assessor before closing.
Climate risk First Street
- Flood 1/10 Low FEMA zone X (unshaded) · 0% chance over 30 yrs
- Wildfire 1/10 Low
- Heat 7/10 Severe 7 d/yr ≥95°F today · 17 d/yr by 30 yrs out
- Wind 6/10 Major 68% chance of damaging wind over 30 yrs
- Air quality 4/10 Moderate 5 unhealthy d/yr today · 7 by 30 yrs out
Nearby sold comps map
Loading sold comps map…
Walkable amenities ~0.75 mi
Loading nearby amenities…
Taxation est. · year 1
- Rental income
- $33,840
- − Mortgage interest
- −$12,318
- − Property taxes
- −$5,071
- − Insurance
- −$1,100
- − Repairs & maintenance
- −$2,707
- − Management
- −$2,707
- − Depreciation
- −$6,397
- Taxable income
- $3,540
- Est. tax owed @ 24.0%
- −$850
- After-tax cash flow
- $5,875/yr
For passive investors: Depreciation is non-cash, so a rental often shows a tax loss while cash-flowing — sheltering income. Rental losses are passive: they offset passive income freely, and up to $25,000/yr can offset ordinary (W-2) income if you actively participate and your MAGI is under $100k (phasing out to $0 by $150k); unused losses carry forward. On sale, claimed depreciation is recaptured at up to 25%, and gains may owe capital-gains tax (a 1031 exchange can defer both). Figures are a year-1 estimate at your 24.0% rate — not tax advice; consult a CPA.
Schools (NCES district)
- District
- Branford School District
- NCES district ID
- 0900420
- Math proficiency
- 41% ▼ -14.00%
- Reading proficiency
- 52% ▼ -10.00%
- Median HH income
- $70,979
- Composite
- 41.85/100
- National rank
- #3377
- State rank
- #85 of 153 in CT
Livability — Branford Center
- Score
- 81/100
- State rank
- #16
- US rank
- #1386
Category grades
Schools grade is shown separately in the Schools card above.
Census & demographics
- Census place
- Branford Center, CT
- County
- New Haven County · 688,236 people
- Metro
- New Haven-Milford, CT
- Population (ZIP)
- 28,217
- Household income
- $105,225
- Rent vs Own
- Severe rent burden
- 1132.0
Population outlook (South Central Connecticut County) Hauer SSP2
- By 2040
- 608,362
Race, ethnicity, and origin ACS 2023
- Neighborhood character
- Predominantly White (85%)
- Race & ethnicity
- White 85% Hispanic / Latino 5% Asian 4% Two or more races 4% Black 3%
- Hispanic origin (detail)
- Puerto Rican 1%
- Common ancestry
- Romanian 7% Lithuanian 2% Slovak 2%
- Foreign-born
- 10% · Canada, South Korea
- Languages at home
- 90% English-only · Spanish 4% Other Indo-European 3% Other Asian/Pacific 1%
Political lean MEDSL · South Central Connecticut
- 2024 margin
- Strong D (+20.1) · D 59.0% · R 38.9% · Other 2.1%
- All cycles
- 2024: D+20.1
Not yet ingested
- Civics
- —
Market trends
- HPI YoY
- ▼ -455.72%
- Current HPI
- 189.8481
- Rent YoY
- ▲ 10.58%
- Metro
- New Haven-Milford, CT
- State GDP YoY
- ▲ 1.06%
- F500 in state
- 38
Industry mix (Fortune 500 HQ in CT)
| Industry | F500 HQs | Revenue |
|---|---|---|
| Industrial Machinery | 4 | $38B |
|
||
| Insurance | 3 | $71B |
|
||
| Financial Services | 2 | $25B |
|
||
| Transportation / Logistics | 2 | $18B |
|
||
| Healthcare | 1 | $247B |
|
||
| Telecommunications | 1 | $55B |
|
||
Price history
2 events — show timeline
- 2026-03-10 Pending — Smart MLS
- 2026-03-04 Listed $219,900 Smart MLS
Property tax history
+0.8%/yrLatest (2022): $5,071 · +0.0% YoY. Source: county tax records.
Cash-flow waterfall
monthlySold comps — $/sqft
last 12 mo · ≤1 miLoading sold comps…