490 George Miller Rd · Hastings, FL
Flood risk 3/10 · Minor
- FEMA flood zone
- X (unshaded)
- Chance of flooding over 30 yrs
- 0.12%
- Est. flood insurance / yr
- $507 – $1,088
Fire risk 4/10 · Minor
- Est. fire insurance / yr
- $947 – $1,759
Heat risk 9/10 · Severe
- Hot days now (above 107°F)
- 7 days/yr
- Hot days in 30 yrs
- 21 days/yr
Wind risk 9/10 · Severe
- Chance of severe wind over 30 yrs
- 99.0%
Air-quality risk 2/10 · Minimal
- Unhealthy air days now
- 2 days/yr
- Unhealthy air days in 30 yrs
- 2 days/yr
Risk factors via First Street. Map © Google.
Why this score? — see what drove the D grade
The composite is a weighted blend of 9 inputs, each scored 0–100. Each bar is that input's sub-score; the figure is the points it added to the 100-point composite (weight × sub-score).
- Appreciation +10.0/10.0
- Cash flow +7.8/30.0
- Schools +6.4/10.0
- ARV discount +5.2/15.0
- Livability +3.6/5.0
- Rent growth +2.5/5.0
- Condition / age +2.5/5.0
- DSCR +1.8/10.0
- 1% rule +1.1/10.0
$295,000
🖨 Deal sheet (PDF) 📄 Offer letter ✓ Due diligence
Listing remarks
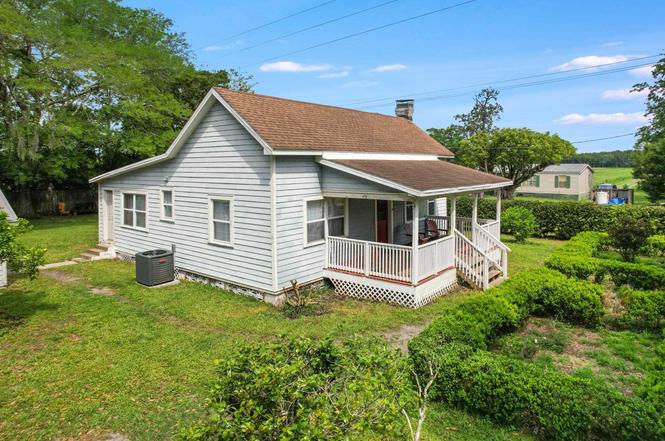
RARE opportunity on 1 acre in Hastings with Open Rural zoning, a pasture, and a barn out back. This 3-bedroom, 2-bath home needs work, but the property offers plenty of upside for the right buyer. Whether you are looking for a renovation project, a rural homestead, extra space for hobbies, or a place to enjoy a more laid-back farm-life setting, this property gives you room to work with. Enjoy the quieter side of St. Johns County while still being within driving distance of downtown St. Augustine, the beaches, shopping, dining, and everyday conveniences.
Key facts
- Rural homestead
- Open rural zoning
- Barn
Tags
Property features AI
Exterior
- Parking: Detached parking
- Home design: Single-family property; Ground-level entry
- Construction: Shingle roof
- Exterior features: Full fenced yard
Interior
- Kitchen: Range; Refrigerator
- Bedrooms: Primary bedroom on the ground level
- Flooring: Tile; Vinyl; Wood
- Bathrooms: Two bathrooms; Primary bathroom with tub/shower combo
- Heating & cooling: Central heating; Central air conditioning
- Interior features: Fireplace; Ceiling fans
- Laundry & utility: Washer; Dryer; Shed
Neighborhood map
What this means for you Summary
Snapshot
- This is a 3-bed/2.0-bath single-family listed at $295k.
Deal economics
- At list price, monthly cash flow is $-333 ($-4k/yr) — negative.
- To cash-flow at today's rent, offer at most $236k (19.9% below list).
- To meet the 1% rule (rent ≥ 1% of price), the offer needs to be $180k (38.8% below list).
- Recommended offer: $180k (38.8% below list) — sets the bar for 1% rule.
- Cap rate 4.9% vs local median 2.7% in Hastings — top-decile yield for the area; either an underpriced asset or a hidden risk that comps aren't pricing in. Stress-test before assuming the spread holds.
Location & tenants
- Location reads 71/100 on livability (#410 in FL) — a middle-class / working-renter tenant base. Strengths: crime A+, cost of living A+, housing A+; Watch: employment D+, amenities F, commute F.
- St. Johns (rural): math 75% / reading 73% proficiency, ranked #2 of 73 in FL (top 3%) — strong family-tenant draw, lease renewals of 3-5y typical; only 20% free/reduced lunch — higher-income household profile.
- Zoned schools: South Woods Elementary School (math 51% / reading 46%, grade D, #1,152 of 2,144 statewide, top 55%, 689 students, 66% FRL); Gamble Rogers Middle School (math 61% / reading 55%, grade B, #151 of 571 statewide, top 27%, 925 students, 47% FRL); Pedro Menendez High School (math 31% / reading 54%, grade F, #264 of 667 statewide, top 41%, 1,519 students, 39% FRL) — zoned schools average 51% FRL vs 20% district-wide (31 pts higher); higher-poverty schools than district average — tighter screening recommended.
- Zoned-school proficiency averages 50% at this address vs 74% district-wide (-24 pts) — the specific schools serving this property underperform the St. Johns average; the district grade overstates school quality for this exact location.
- Market conditions: 235 active listings in the ZIP; 4 comparable units currently listed for rent nearby; rentals leasing fast (median 4d on market — plan ~1-2 weeks tenant-placement turnaround); 5,575 units permitted in St. Johns County in 2024 (584 in 5+ unit buildings).
Forward outlook
- In year one you build about $32k of equity ($2k loan paydown + $30k appreciation (10.0% local appreciation)).
- St. Johns County population projected at +60% by 2050 — long-run rental-demand tailwind backs the buy-and-hold thesis.
- By year 2, paydown + projected appreciation supports a ~$51k cash-out refi (75% LTV) — recoverable capital for the next deal without selling this one.
Negotiation context
- Only 10 days on market — expect competitive offers; lowballing is unlikely to land.
- Current owner paid $87k; list at $295k implies a 239% gain — meaningful room to come down on a strong offer.
Risks & watch-outs
- Watch-outs: built in 1900 — expect roof / HVAC / electrical / plumbing capex.
- Climate carrying-cost: severe wind risk, 99% chance of damaging wind over 30y; extreme-heat days projected 7→21/yr by 2055 (HVAC capex compounding) — expect insurance premiums to compound above CPI over the hold.
Questions for the listing agent
- What do current leases actually rent for vs. the listed asking? Can we see a recent rent roll and the last 12 months of T-12 income?
- Built in 1900 — when were the roof, HVAC, electrical panel, plumbing, and water heater last replaced?
- Is there a deadline driving the sale (1031 exchange, divorce, estate, relocation)? That informs how much negotiation room exists.
- Schools are F-rated, which usually means shorter tenancies and higher turnover. Who's the typical renter profile here, and what's been the actual vacancy rate?
- The area grade is low — what's the realistic commute time and amenity access for the typical tenant pool here? Any planned neighborhood developments (good or bad) we should know about?
- What's the average days-on-market for RENTAL listings here right now (not sales)? A rising rental-DOM trend means longer vacancies and softer asking-rent achievability than the comps imply.
- What's the recent tenant-quality profile in this submarket — average credit score on applications, eviction rate, late-payment / NSF rate, and stable-employment percentage? A property-management company in the area should have these aggregated.
- How much new for-sale + rental construction is in the pipeline within 1–3 miles? Heavy new supply typically softens prices + rents 12–24 months out; constrained supply supports both.
Investment metrics
- 1% rule
- 0.61% ✗
- Cap rate
- 4.94%
- Cash-on-cash
- -4.83%
- DSCR
- 0.78
- GRM
- 13.6
CMA / ARV
- ARV (on-the-fly)
- $280,500
- Comps found
- 1
Show comp detail 1 sale within ~0.75 mi
| Address | Dist | Beds/Ba | Sqft | Sold | Price | $/sf | Match |
|---|---|---|---|---|---|---|---|
| 115 George Miller Rd | 0.63mi | 4/2.0 (+1) | 1,443 (-12%) | 18mo | $245,000 | $170 | 30 |
Match score weights: distance 35% · size 25% · config 20% · recency 20%. Top-matched comps best support the ARV.
Projected returns pro-forma
10.0% appreciation · 3.0% rent growth · sell at horizon
- IRR
- 20.8%
- Equity multiple
- 2.69×
- Total profit
- $139,334
- Equity at exit
- $265,759
- IRR
- 18.9%
- Equity multiple
- 6.17×
- Total profit
- $426,688
- Equity at exit
- $573,120
Cash invested: $82,600 (down + closing). Projections, not guarantees.
Landlord ↔ Tenant lean methodology
- Overall (STATE)
- 87 Strongly Landlord-Friendly
- State Florida
- 87 Strongly Landlord-Friendly · R+3
- County
- — inherits STATE
- City
- — inherits STATE
ZIP-level market 32145
- Home prices YoY
- 19.1%
- Active inventory
- 235
- Price-to-rent
- 13.6×
Monthly cashflow live
- Estimated rent
- $1,804 medium interval (Pro) →
- Mortgage (P&I)
- −$1,547
- Tax from tax record
- −$88 /mo · $1,055/yr
- Insurance
- −$123
- HOA
- −$0
- Vacancy / Maint / Mgmt
- −$379
- Net cashflow
- $-333
Break-even live
Sensitivity live
| Price | -10% $-166 | -5% $-249 | +0% $-333 | +5% $-416 | +10% $-500 |
|---|---|---|---|---|---|
| Rent | -10% $-475 | -5% $-404 | +0% $-333 | +5% $-261 | +10% $-190 |
| Rate | -1.0pp $-184 | -0.5pp $-258 | base $-333 | +0.5pp $-409 | +1.0pp $-487 |
UW: 25.0% down · 7.5% · 30yr · 1.5% tax · 5.0% vac · 8.0% maint · 8.0% mgmt
Financing live
Cash to close
- Down payment
- $73,750
- Closing costs
- $8,850
- Reserves months
- —
- Total cash needed
- —
Loan-product check · same deal, 3 products live
Conventional
25% down · 7.5% · 30yr
- Down + closing
- —
- Monthly P&I
- —
- Monthly cashflow
- —
- DSCR
- —
- Eligible?
- —
Personal DTI + credit; lowest rate.
DSCR
20% down · 8.5% · 30yr
- Down + closing
- —
- Monthly P&I
- —
- Monthly cashflow
- —
- DSCR
- —
- Eligible?
- —
No personal income docs; deal must DSCR.
Hard money
10% down · 12.0% · 12mo
- Down + closing
- —
- Monthly P&I
- —
- Monthly cashflow
- —
- DSCR
- —
- Eligible?
- —
Short-term bridge; refi at stabilization.
Rent comps 4 comps
| Address | Beds | Baths | Sqft | Rent | $/sqft | DOM | Units | Dist |
|---|---|---|---|---|---|---|---|---|
| 213 Park Ave Hastings, FL | 3.0 | 2.0 | 1256 | $1,665 | $1.33 | 5d | 1 | 0.82mi |
| 206 W Fox St Hastings, FL | 3.0 | 2.5 | 1356 | $1,985 | $1.46 | 3d | 1 | 0.96mi |
| 210 W Fox St Hastings, FL | 3.0 | 2.0 | 1185 | $1,750 | $1.48 | 3d | 1 | 0.98mi |
| 614 Hannah St Hastings, FL | 3.0 | 2.0 | 1397 | $1,825 | $1.31 | 3d | 1 | 1.23mi |
Listing history 8 events
-
2026-06-21days on market $295,000 Active 10 DOM
-
2026-06-18days on market $295,000 Active 7 DOM
-
2026-06-17days on market $295,000 Active 6 DOM
-
2026-06-16days on market $295,000 Active 5 DOM
-
2026-06-15days on market $295,000 Active 4 DOM
-
2026-06-13days on market $295,000 Active 2 DOM
-
2026-06-13remarks 559-char remark
-
2026-06-13$295,000 Active 1 DOM
ⓘ Source: listings_history table (triggers on properties + properties_extension) + one-shot
backfill from property_details.listing_events for pre-trigger history.
Tax reassessment forecast FL · Resets to sale price
- Current annual tax
- $1,055 · $88/mo
- Projected year-2 tax
- $2,448 · $204/mo
- Expected delta
- +$1,393/yr (+$116/mo · 132.1%)
ⓘ Screening estimate from a state-policy table — verify with the county assessor before closing.
Climate risk First Street
- Flood 3/10 Moderate FEMA zone X (unshaded) · 12% chance over 30 yrs
- Wildfire 4/10 Moderate
- Heat 9/10 Extreme 7 d/yr ≥107°F today · 21 d/yr by 30 yrs out
- Wind 9/10 Extreme 99% chance of damaging wind over 30 yrs
- Air quality 2/10 Low 2 unhealthy d/yr today · 2 by 30 yrs out
Nearby sold comps map
Loading sold comps map…
Walkable amenities ~0.75 mi
Loading nearby amenities…
Taxation est. · year 1
- Rental income
- $21,649
- − Mortgage interest
- −$16,525
- − Property taxes
- −$1,055
- − Insurance
- −$1,475
- − Repairs & maintenance
- −$1,732
- − Management
- −$1,732
- − Depreciation
- −$8,582
- Taxable loss
- −$9,451
- Est. tax savings @ 24.0%
- +$2,268
- After-tax cash flow
- $-1,723/yr
For passive investors: Depreciation is non-cash, so a rental often shows a tax loss while cash-flowing — sheltering income. Rental losses are passive: they offset passive income freely, and up to $25,000/yr can offset ordinary (W-2) income if you actively participate and your MAGI is under $100k (phasing out to $0 by $150k); unused losses carry forward. On sale, claimed depreciation is recaptured at up to 25%, and gains may owe capital-gains tax (a 1031 exchange can defer both). Figures are a year-1 estimate at your 24.0% rate — not tax advice; consult a CPA.
Schools (NCES district)
- District
- St. Johns
- NCES district ID
- 1201740
- Math proficiency
- 75% ▼ -5.00%
- Reading proficiency
- 73% ▼ -2.00%
- Median HH income
- $66,842
- Composite
- 64.31/100
- National rank
- #556
- State rank
- #2 of 73 in FL
Livability — Hastings
- Score
- 71/100
- State rank
- #410
- US rank
- #7309
Category grades
Schools grade is shown separately in the Schools card above.
Census & demographics
- Census place
- Hastings, FL
- Population (ZIP)
- 5,750
Population outlook (St. Johns County) Hauer SSP2
- Today (2025)
- 303,941 people
- By 2030
- 342,590 · +12.7%
- By 2040
- 417,328 · +37.3%
- By 2050
- 487,011 · +60.2%
- By 2075
- 635,395 · +109.1%
- By 2100
- 717,469 · +136.1%
Race, ethnicity, and origin ACS 2023
- Neighborhood character
- Predominantly White (76%)
- Race & ethnicity
- White 76% Two or more races 16% Hispanic / Latino 9% Black 7%
- Hispanic origin (detail)
- Mexican 8%
- Common ancestry
- Lithuanian 3% Romanian 3% Estonian 3%
- Foreign-born
- 12% · Canada
- Languages at home
- 86% English-only · Spanish 9% Other Indo-European 5%
Political lean MEDSL · St. Johns
- 2024 margin
- Solid R (+31.4) · D 33.9% · R 65.2%
- 2008→2024 swing
- +0.2pp no change · 2008: -31.6pp · 2024: -31.4pp
- All cycles
- 2024: R+31.4 2020: R+26.7 2016: R+33.4 2012: R+37.8 2008: R+31.6
Not yet ingested
- Civics
- —
Market trends
- HPI YoY
- ▲ 40.24%
- Current HPI
- 250.8035
- Rent YoY
- —
- Metro
- —
- State GDP YoY
- ▲ 3.28%
- F500 in state
- 36
Industry mix (Fortune 500 HQ in FL)
| Industry | F500 HQs | Revenue |
|---|---|---|
| Industrial Technology | 2 | $29B |
|
||
| Insurance | 2 | $17B |
|
||
| Retail | 1 | $60B |
|
||
| Technology Distribution | 1 | $58B |
|
||
| Homebuilding | 1 | $35B |
|
||
| Technology Manufacturing | 1 | $35B |
|
||
Price history
+436.4% since first listed3 events — show timeline
- 2026-06-11 Listed $295,000 St. Augustine and St. Johns County Board of REALTORS®
- 1999-06-24 Sold (Public Records) $87,000 Public Records
- 1998-02-19 Sold (Public Records) $55,000 Public Records
Property tax history
+2.6%/yrLatest (2025): $1,055 · +19.4% YoY. Source: county tax records.
Cash-flow waterfall
monthlySold comps — $/sqft
last 12 mo · ≤1 miLoading sold comps…