 Duplex
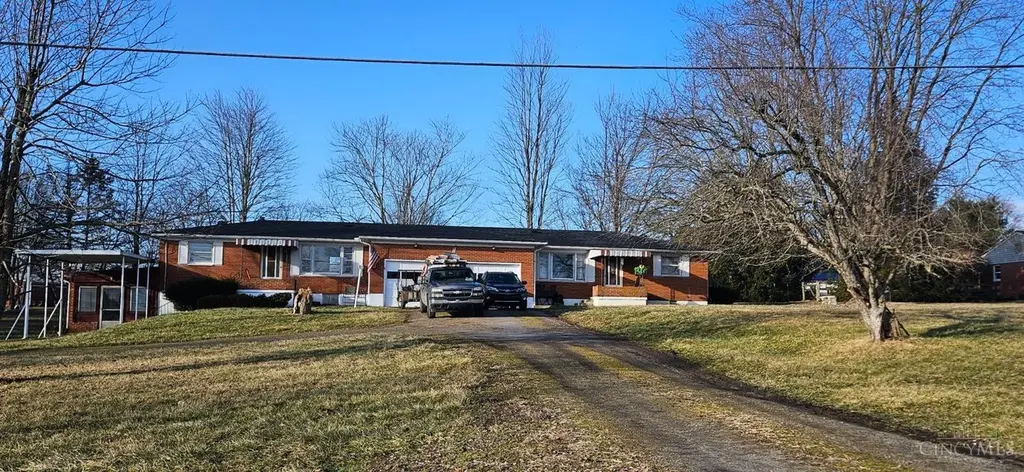
8509 St Rt 73 · Hillsboro, OH
Flood risk 1/10 · Minimal
- FEMA flood zone
- X (unshaded)
- Chance of flooding over 30 yrs
- 0.0%
- Est. flood insurance / yr
- $473 – $860
Fire risk 2/10 · Minimal
- Est. fire insurance / yr
- $713 – $1,323
Heat risk 3/10 · Minor
- Hot days now (above 98°F)
- 7 days/yr
- Hot days in 30 yrs
- 18 days/yr
Wind risk 2/10 · Minimal
- Chance of severe wind over 30 yrs
- 1.0%
Air-quality risk 2/10 · Minimal
- Unhealthy air days now
- 1 days/yr
- Unhealthy air days in 30 yrs
- 1 days/yr
Risk factors via First Street. Map © Google.
Why this score? — see what drove the B- grade
The composite is a weighted blend of 9 inputs, each scored 0–100. Each bar is that input's sub-score; the figure is the points it added to the 100-point composite (weight × sub-score).
- Cash flow +30.0/30.0
- DSCR +10.0/10.0
- 1% rule +8.0/10.0
- ARV discount +7.5/15.0
- Schools +5.8/10.0
- Livability +3.4/5.0
- Rent growth +2.5/5.0
- Condition / age +2.5/5.0
- Appreciation +0.0/10.0
$199,900
🖨 Deal sheet (PDF) 📄 Offer letter ✓ Due diligence
Multi-family units
County records classify this as Multi-Family (2-4 Unit). Listing-text estimate: 2 units. confirmed
Listing remarks MLS
Rare single story duplex located just outside of Hillsboro. Property has separate entrances, utilities. Each unit has 2 bedrooms and 1 full bathrooms with 1 car attached garage. Left side unit has full basement and attached enclosed porch.
Key facts
- Single story duplex
- Full basement
- Separate entrances
Tags
Neighborhood map
What this means for you Summary
Snapshot
- This is a 2 × 2-bed/1-bath units multifamily listed at $200k.
Deal economics
- At list price, monthly cash flow is $780 ($9k/yr) — positive. Per door: $390/mo.
- The deal already cash-flows at list — no discount required.
- Meets the 1% rule at list price ($3k rent vs $200k).
- Recommended offer: $188k (6.0% below list) — sets the bar for market timing.
- Cap rate 11.0% vs local median 3.2% in Hillsboro — top-decile yield for the area; either an underpriced asset or a hidden risk that comps aren't pricing in. Stress-test before assuming the spread holds.
Location & tenants
- Location reads 67/100 on livability (#621 in OH) — a middle-class / working-renter tenant base. Strengths: crime A+, cost of living A+, housing A+; Watch: amenities F, commute F, employment D-.
- Hillsboro City (rural): math 66% / reading 73% proficiency, ranked #175 of 656 in OH (top 27%) — acceptable for families but not a draw, mixed tenant base, ~2y average lease.
- Market conditions: 125 active listings in the ZIP; 20 units permitted in Highland County in 2024 (0 in 5+ unit buildings).
- At $2,594/mo this rent would consume 53% of the median local household income ($59k/yr) (locally 16% of renters already pay >50% of income on rent) — very limited rent-growth headroom before tenants either downsize or default.
Forward outlook
- Local home prices are declining (-3.0%/yr); year-one equity from $1k of loan paydown is wiped out by about $6k of value loss. Plan a longer hold.
- Highland County population projected at -21% by 2050 — secular population decline; favor cash flow + early exit over multi-decade hold.
- At projected returns (-3.0% appreciation + 3.0% rent growth), your $56k cash investment doubles in ~8 years — after that, you're playing with house money.
Negotiation context
- It's been on market 89 days — a 6% lower offer ($188k) is reasonable based on typical stale-listing flexibility.
- 2 sale attempts; this cycle's ask has dropped $120k (38%) from the opening price — seller is motivated, your offer sets the floor, not the list.
Questions for the listing agent
- It's been on market 89 days. Have you received any prior offers? Is the seller open to a 6% concession, seller financing, or rate buy-down credit?
- Can we see the unit-by-unit rent roll, current vacancy, and any below-market leases? What's the average tenancy length?
- What capital expenditures (roof, boiler, parking lot, exteriors) have been made in the last 5 years, and what's planned in the next 2?
- Built in 1966 — when were the roof, HVAC, electrical panel, plumbing, and water heater last replaced?
- Why hasn't it sold? Are there any deal-killer items the seller is aware of (foundation, flood, title, zoning, code violations)?
- Is there a deadline driving the sale (1031 exchange, divorce, estate, relocation)? That informs how much negotiation room exists.
- Schools are B-rated — typically a magnet for longer-tenancy family renters. What's the average tenant stay here, and is there a school-zone premium baked into asking?
- What's the average days-on-market for RENTAL listings here right now (not sales)? A rising rental-DOM trend means longer vacancies and softer asking-rent achievability than the comps imply.
- What's the recent tenant-quality profile in this submarket — average credit score on applications, eviction rate, late-payment / NSF rate, and stable-employment percentage? A property-management company in the area should have these aggregated.
- How much new apartment / multifamily construction is in the pipeline within 1–3 miles? Heavy new supply (>2% of stock underway) typically softens rents 12–24 months out; light construction supports rent growth.
Investment metrics
- 1% rule
- 1.30% ✓
- Cap rate
- 10.98%
- Cash-on-cash
- 16.73%
- DSCR
- 1.74
- GRM
- 6.4
CMA / ARV
No comps found within radius.
Projected returns pro-forma
-3.0% appreciation · 3.0% rent growth · sell at horizon
- IRR
- 7.9%
- Equity multiple
- 1.31×
- Total profit
- $17,279
- Equity at exit
- $29,806
- IRR
- 17.1%
- Equity multiple
- 2.41×
- Total profit
- $78,923
- Equity at exit
- $17,284
Cash invested: $55,972 (down + closing). Projections, not guarantees.
Landlord ↔ Tenant lean methodology
- Overall (STATE)
- 73 Landlord-Friendly
- State Ohio
- 73 Landlord-Friendly · R+6
- County
- — inherits STATE
- City
- — inherits STATE
ZIP-level market 45133
- Home prices YoY
- -19.4%
- Active inventory
- 125
- Price-to-rent
- 12.8×
Monthly cashflow live
- Estimated rent
- $2,594 medium interval (Pro) →
- Mortgage (P&I)
- −$1,048
- Tax from tax record
- −$137 /mo · $1,648/yr
- Insurance
- −$83
- HOA
- −$0
- Vacancy / Maint / Mgmt
- −$545
- Net cashflow
- $780
Break-even live
Sensitivity live
| Price | -10% $894 | -5% $837 | +0% $780 | +5% $724 | +10% $667 |
|---|---|---|---|---|---|
| Rent | -10% $575 | -5% $678 | +0% $780 | +5% $883 | +10% $985 |
| Rate | -1.0pp $881 | -0.5pp $831 | base $780 | +0.5pp $729 | +1.0pp $676 |
2-unit breakdown (identical units grouped — click to expand)
| Units | Beds | Baths | Est. rent |
|---|---|---|---|
| 2× units | 2 | 1 | $2,594 |
| #1 | 2 | 1 | $1,297 |
| #2 | 2 | 1 | $1,297 |
| Total (2 units) | $2,594 | ||
UW: 25.0% down · 7.5% · 30yr · 1.5% tax · 5.0% vac · 8.0% maint · 8.0% mgmt
Financing live
Cash to close
- Down payment
- $49,975
- Closing costs
- $5,997
- Reserves months
- —
- Total cash needed
- —
Loan-product check · same deal, 3 products live
Conventional
25% down · 7.5% · 30yr
- Down + closing
- —
- Monthly P&I
- —
- Monthly cashflow
- —
- DSCR
- —
- Eligible?
- —
Personal DTI + credit; lowest rate.
DSCR
20% down · 8.5% · 30yr
- Down + closing
- —
- Monthly P&I
- —
- Monthly cashflow
- —
- DSCR
- —
- Eligible?
- —
No personal income docs; deal must DSCR.
Hard money
10% down · 12.0% · 12mo
- Down + closing
- —
- Monthly P&I
- —
- Monthly cashflow
- —
- DSCR
- —
- Eligible?
- —
Short-term bridge; refi at stabilization.
Listing history 21 events
-
2026-06-21pricedays on market $199,900 Active 89 DOM
-
2026-06-18days on market $219,900 Active 87 DOM
-
2026-06-17days on market $219,900 Active 86 DOM
-
2026-06-16days on market $219,900 Active 85 DOM
-
2026-06-15days on market $219,900 Active 84 DOM
-
2026-06-13days on market $219,900 Active 82 DOM
-
2026-06-12days on market $219,900 Active 81 DOM
-
2026-06-09days on market $219,900 Active 78 DOM
-
2026-06-08days on market $219,900 Active 77 DOM
-
2026-06-08days on market $219,900 Active 76 DOM
-
2026-06-07days on market $219,900 Active 75 DOM
-
2026-06-04days on market $219,900 Active 72 DOM
-
2026-06-02days on market $219,900 Active 71 DOM
-
2026-06-01days on market $219,900 Active 70 DOM
-
2026-05-31days on market $219,900 Active 69 DOM
-
2026-04-19price $229,900 240-char remark
Show marketing remark (240 chars)
Rare single story duplex located just outside of Hillsboro. Property has separate entrances, utilities. Each unit has 2 bedrooms and 1 full bathrooms with 1 car attached garage. Left side unit has full basement and attached enclosed porch.
-
2026-04-17price $279,900 240-char remark
Show marketing remark (240 chars)
Rare single story duplex located just outside of Hillsboro. Property has separate entrances, utilities. Each unit has 2 bedrooms and 1 full bathrooms with 1 car attached garage. Left side unit has full basement and attached enclosed porch.
-
2026-03-31price $299,900 240-char remark
Show marketing remark (240 chars)
Rare single story duplex located just outside of Hillsboro. Property has separate entrances, utilities. Each unit has 2 bedrooms and 1 full bathrooms with 1 car attached garage. Left side unit has full basement and attached enclosed porch.
-
2026-03-23$319,900 Active 240-char remark
Show marketing remark (240 chars)
Rare single story duplex located just outside of Hillsboro. Property has separate entrances, utilities. Each unit has 2 bedrooms and 1 full bathrooms with 1 car attached garage. Left side unit has full basement and attached enclosed porch.
-
2025-05-19historical 240-char remark
Show marketing remark (240 chars)
Rare single story duplex located just outside of Hillsboro. Property has separate entrances, utilities. Each unit has 2 bedrooms and 1 full bathrooms with 1 car attached garage. Left side unit has full basement and attached enclosed porch.
-
2025-03-31$400,000 Active 240-char remark
Show marketing remark (240 chars)
Rare single story duplex located just outside of Hillsboro. Property has separate entrances, utilities. Each unit has 2 bedrooms and 1 full bathrooms with 1 car attached garage. Left side unit has full basement and attached enclosed porch.
ⓘ Source: listings_history table (triggers on properties + properties_extension) + one-shot
backfill from property_details.listing_events for pre-trigger history.
Tax reassessment forecast OH · Partial reset (capped growth)
- Current annual tax
- $1,648 · $137/mo
- Projected year-2 tax
- $2,383 · $199/mo
- Expected delta
- +$735/yr (+$61/mo · 44.6%)
ⓘ Screening estimate from a state-policy table — verify with the county assessor before closing.
Climate risk First Street
- Flood 1/10 Low FEMA zone X (unshaded) · 0% chance over 30 yrs
- Wildfire 2/10 Low
- Heat 3/10 Moderate 7 d/yr ≥98°F today · 18 d/yr by 30 yrs out
- Wind 2/10 Low 100% chance of damaging wind over 30 yrs
- Air quality 2/10 Low 1 unhealthy d/yr today · 1 by 30 yrs out
Nearby sold comps map
Loading sold comps map…
Walkable amenities ~0.75 mi
Loading nearby amenities…
Taxation est. · year 1
- Rental income
- $31,128
- − Mortgage interest
- −$11,198
- − Property taxes
- −$1,648
- − Insurance
- −$1,000
- − Repairs & maintenance
- −$2,490
- − Management
- −$2,490
- − Depreciation
- −$5,815
- Taxable income
- $6,487
- Est. tax owed @ 24.0%
- −$1,557
- After-tax cash flow
- $7,807/yr
For passive investors: Depreciation is non-cash, so a rental often shows a tax loss while cash-flowing — sheltering income. Rental losses are passive: they offset passive income freely, and up to $25,000/yr can offset ordinary (W-2) income if you actively participate and your MAGI is under $100k (phasing out to $0 by $150k); unused losses carry forward. On sale, claimed depreciation is recaptured at up to 25%, and gains may owe capital-gains tax (a 1031 exchange can defer both). Figures are a year-1 estimate at your 24.0% rate — not tax advice; consult a CPA.
Schools (NCES district)
- District
- Hillsboro City
- NCES district ID
- 3904412
- Math proficiency
- 66% ▬ 0.00%
- Reading proficiency
- 73% ▲ 1.00%
- Median HH income
- $37,342
- Composite
- 57.72/100
- National rank
- #1056
- State rank
- #175 of 656 in OH
Livability — Hillsboro
- Score
- 67/100
- State rank
- #621
- US rank
- #10783
Category grades
Schools grade is shown separately in the Schools card above.
Census & demographics
- County
- Highland · 42,279 people
- Population (ZIP)
- 23,604
- Household income
- $58,813
- Rent vs Own
- Severe rent burden
- 15.9
Population outlook (Highland County) Hauer SSP2
- Today (2025)
- 41,165 people
- By 2030
- 39,726 · -3.5%
- By 2040
- 36,377 · -11.6%
- By 2050
- 32,572 · -20.9%
- By 2075
- 23,690 · -42.5%
- By 2100
- 16,220 · -60.6%
Race, ethnicity, and origin ACS 2023
- Neighborhood character
- Predominantly White (94%)
- Race & ethnicity
- White 94% Two or more races 4% Hispanic / Latino 1% Black 1%
- Common ancestry
- Serbian 2% Slovak 1% Iranian 1%
- Foreign-born
- 1% · Canada
- Languages at home
- 96% English-only · German/W. Germanic 3% Spanish 1%
Political lean MEDSL · Highland
- 2024 margin
- Solid R (+63.4) · D 18.1% · R 81.4%
- 2008→2024 swing
- -37.0pp toward R · 2008: -26.3pp · 2024: -63.4pp
- All cycles
- 2024: R+63.4 2020: R+60.4 2016: R+56.1 2012: R+30.7 2008: R+26.3
Not yet ingested
- Civics
- —
Market trends
- HPI YoY
- ▼ -66.94%
- Current HPI
- 278.012
- Rent YoY
- —
- Metro
- —
- State GDP YoY
- ▲ 1.98%
- F500 in state
- 48
Industry mix (Fortune 500 HQ in OH)
| Industry | F500 HQs | Revenue |
|---|---|---|
| Insurance | 3 | $145B |
|
||
| Industrial Machinery | 3 | $49B |
|
||
| Financial Services | 3 | $24B |
|
||
| Consumer Goods | 2 | $93B |
|
||
| Aerospace / Defense | 2 | $47B |
|
||
| Utilities | 2 | $33B |
|
||
Price history
-42.5% since first listed6 events — show timeline
- 2026-04-19 Price Changed $229,900 Cincy MLS
- 2026-04-17 Price Changed $279,900 Cincy MLS
- 2026-03-31 Price Changed $299,900 Cincy MLS
- 2026-03-23 Listed $319,900 Cincy MLS
- 2025-05-19 Listing Removed — Cincy MLS
- 2025-03-31 Listed $400,000 Cincy MLS
Property tax history
+5.2%/yrLatest (2025): $1,648 · +0.0% YoY. Source: county tax records.
Cash-flow waterfall
monthlySold comps — $/sqft
last 12 mo · ≤1 miLoading sold comps…