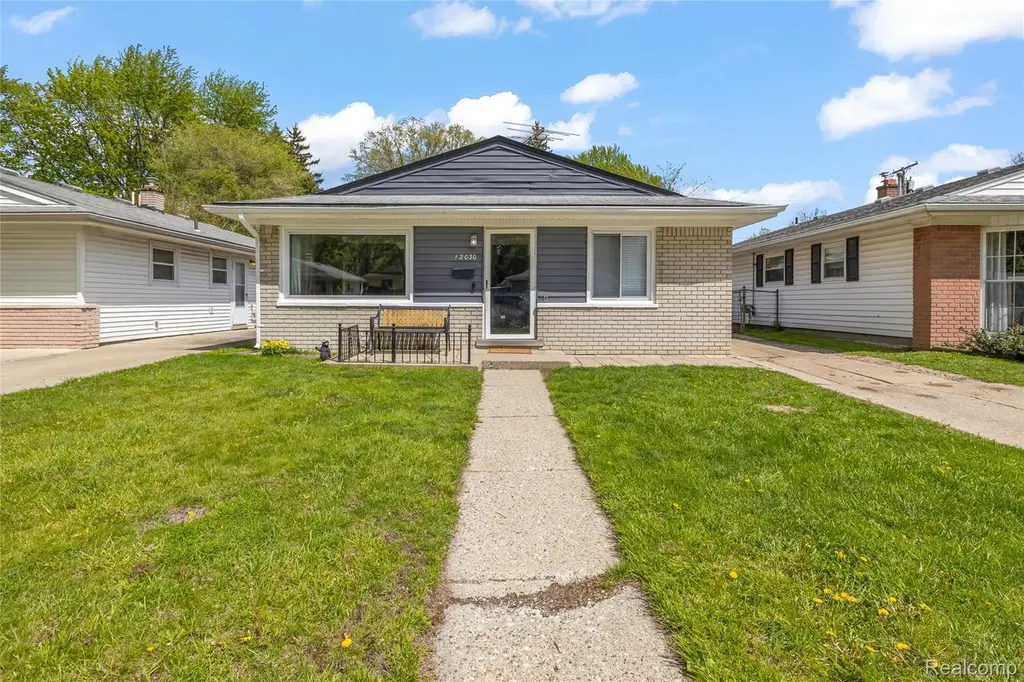
12030 Arcola St · Livonia, MI
Flood risk 6/10 · Moderate
- FEMA flood zone
- X (unshaded)
- Chance of flooding over 30 yrs
- 0.72%
- Est. flood insurance / yr
- $507 – $1,088
Fire risk 1/10 · Minimal
- Est. fire insurance / yr
- $784 – $1,456
Heat risk 3/10 · Minor
- Hot days now (above 98°F)
- 7 days/yr
- Hot days in 30 yrs
- 15 days/yr
Wind risk 2/10 · Minimal
- Chance of severe wind over 30 yrs
- —
Air-quality risk 3/10 · Minor
- Unhealthy air days now
- 2 days/yr
- Unhealthy air days in 30 yrs
- 3 days/yr
Risk factors via First Street. Map © Google.
Why this score? — see what drove the D+ grade
The composite is a weighted blend of 9 inputs, each scored 0–100. Each bar is that input's sub-score; the figure is the points it added to the 100-point composite (weight × sub-score).
- Cash flow +20.8/30.0
- DSCR +6.6/10.0
- Schools +4.6/10.0
- 1% rule +4.5/10.0
- Livability +3.9/5.0
- Rent growth +2.5/5.0
- Condition / age +2.5/5.0
- ARV discount +0.4/15.0
- Appreciation +0.0/10.0
$187,500
🖨 Deal sheet (PDF) 📄 Offer letter ✓ Due diligence
Listing remarks MLS
Welcome home to this beautiful 3 bedroom brick ranch in Livonia. Step into the bright and inviting living room filled with natural light and an open layout that flows seamlessly into the kitchen, creating the perfect space for everyday living and entertainment. The home offers 3 nicely sized bedrooms, ideal for family, guest, or a home office. Located in highly sought after Livonia school district. Enjoy a spacious backyard, ideal for relaxing or entertaining. Close to restaurants, shops, and freeway. Schedule your showing today.
Key facts
- 5,227 sq ft lot
- Garage
- Built 1957
Property features AI
Exterior
- Parking: Detached garage (1 car)
- Utilities: Public water; Public sewer
- Home design: Single-family residence; One story; Entry at ground level
- Construction: Aluminum siding and brick exterior; Slab foundation
- Exterior features: Paved road access; Lot approximately 0.12 acres (40 x 130)
Interior
- Bathrooms: 1 full bathroom
- Heating & cooling: Central air conditioning; Forced air heating (natural gas)
- Interior features: Total of 6 rooms; Ground-level entry
Neighborhood map
What this means for you Summary
Snapshot
- This is a 3-bed/1.0-bath single-family listed at $188k.
Deal economics
- At list price, monthly cash flow is $256 ($3k/yr) — positive.
- The deal already cash-flows at list — no discount required.
- To meet the 1% rule (rent ≥ 1% of price), the offer needs to be $178k (4.9% below list).
- Recommended offer: $178k (4.9% below list) — sets the bar for 1% rule.
- Cap rate 7.9% vs local median 4.9% in Livonia — top-decile yield for the area; either an underpriced asset or a hidden risk that comps aren't pricing in. Stress-test before assuming the spread holds.
Location & tenants
- Location reads 77/100 on livability (#116 in MI, #2,784 nationally) — a middle-class / working-renter tenant base. Strengths: employment A+, cost of living A+, housing A+; Watch: amenities D, health & safety D, commute F.
- Livonia Public Schools School District (urban): math 46% / reading 59% proficiency, ranked #77 of 540 in MI (top 14%) — acceptable for families but not a draw, mixed tenant base, ~2y average lease.
- Market conditions: 100 active listings in the ZIP; 6 comparable units currently listed for rent nearby; rentals leasing fast (median 11d on market — plan ~1-2 weeks tenant-placement turnaround); solid renter incomes; 2,639 units permitted in Wayne County in 2024 (1,216 in 5+ unit buildings).
Forward outlook
- Local home prices are declining (-3.0%/yr); year-one equity from $1k of loan paydown is wiped out by about $6k of value loss. Plan a longer hold.
- Wayne County population projected at -17% by 2050 — secular population decline; favor cash flow + early exit over multi-decade hold.
Negotiation context
- Only 11 days on market — expect competitive offers; lowballing is unlikely to land.
- 19 sale attempts since 23y ago with the ask held roughly flat each time — persistent listings suggest the price (not the market) is what's stuck; bring a comps-based counter.
- Current owner paid $90k; list at $188k implies a 109% gain — meaningful room to come down on a strong offer.
Risks & watch-outs
- Watch-outs: built in 1957 — expect roof / HVAC / electrical / plumbing capex.
- Climate carrying-cost: major flood risk — expect insurance premiums to compound above CPI over the hold.
Questions for the listing agent
- Built in 1957 — when were the roof, HVAC, electrical panel, plumbing, and water heater last replaced?
- Is there a deadline driving the sale (1031 exchange, divorce, estate, relocation)? That informs how much negotiation room exists.
- Schools are B-rated — typically a magnet for longer-tenancy family renters. What's the average tenant stay here, and is there a school-zone premium baked into asking?
- The area grade is low — what's the realistic commute time and amenity access for the typical tenant pool here? Any planned neighborhood developments (good or bad) we should know about?
- What's the average days-on-market for RENTAL listings here right now (not sales)? A rising rental-DOM trend means longer vacancies and softer asking-rent achievability than the comps imply.
- What's the recent tenant-quality profile in this submarket — average credit score on applications, eviction rate, late-payment / NSF rate, and stable-employment percentage? A property-management company in the area should have these aggregated.
- How much new for-sale + rental construction is in the pipeline within 1–3 miles? Heavy new supply typically softens prices + rents 12–24 months out; constrained supply supports both.
Investment metrics
- 1% rule
- 0.95% ✗
- Cap rate
- 7.93%
- Cash-on-cash
- 5.85%
- DSCR
- 1.26
- GRM
- 8.8
CMA / ARV
- ARV (on-the-fly)
- $161,862
- Comps found
- 12
Show comp detail 12 sales within ~0.75 mi
| Address | Dist | Beds/Ba | Sqft | Sold | Price | $/sf | Match |
|---|---|---|---|---|---|---|---|
| 11757 Eileen | 0.47mi | 3/1.0 | 1,040 (+2%) | 0mo | $220,000 | $212 | 74 |
| 12111 Inkster Rd | 0.06mi | 3/1.0 | 1,147 (+13%) | 3mo | $155,000 | $135 | 74 |
| 9624 Nathaline | 0.69mi | 3/1.0 | 1,019 (+0%) | 3mo | $209,000 | $205 | 66 |
| 10061 Seltzer St | 0.52mi | 3/2.0 | 972 (-4%) | 2mo | $290,000 | $298 | 63 |
| 9983 Hemingway | 0.64mi | 3/1.0 | 1,059 (+4%) | 3mo | $149,000 | $141 | 61 |
| 11748 Leverne | 0.59mi | 3/1.5 | 1,075 (+6%) | 4mo | $142,000 | $132 | 58 |
| 12135 Leverne | 0.57mi | 2/1.5 (-1) | 1,050 (+3%) | 6mo | $167,000 | $159 | 56 |
| 9656 Sioux | 0.60mi | 4/1.0 (+1) | 1,116 (+10%) | 2mo | $147,500 | $132 | 49 |
| 9968 Cavell St | 0.48mi | 3/1.0 | 1,162 (+14%) | 7mo | $225,000 | $194 | 48 |
| 9648 Nathaline Ave | 0.67mi | 3/1.0 | 894 (-12%) | 4mo | $145,000 | $162 | 46 |
| 9640 Nathaline | 0.67mi | 3/1.0 | 894 (-12%) | 5mo | $125,000 | $140 | 44 |
| 9560 Nathaline | 0.74mi | 4/1.5 (+1) | 1,125 (+10%) | 1mo | $142,500 | $127 | 40 |
Match score weights: distance 35% · size 25% · config 20% · recency 20%. Top-matched comps best support the ARV.
Projected returns pro-forma
-3.0% appreciation · 3.0% rent growth · sell at horizon
- IRR
- -7.3%
- Equity multiple
- 0.73×
- Total profit
- $-14,136
- Equity at exit
- $27,957
- IRR
- 2.3%
- Equity multiple
- 1.16×
- Total profit
- $8,442
- Equity at exit
- $16,212
Cash invested: $52,500 (down + closing). Projections, not guarantees.
Landlord ↔ Tenant lean methodology
- Overall (STATE)
- 62 Landlord-Friendly
- State Michigan
- 62 Landlord-Friendly · EVEN
- County
- — inherits STATE
- City
- — inherits STATE
ZIP-level market 48150
- Active inventory
- 100
- Price-to-rent
- 8.8×
Monthly cashflow live
- Estimated rent
- $1,783 high interval (Pro) →
- Mortgage (P&I)
- −$983
- Tax from tax record
- −$92 /mo · $1,098/yr
- Insurance
- −$78
- HOA
- −$0
- Vacancy / Maint / Mgmt
- −$375
- Net cashflow
- $256
Break-even live
Sensitivity live
| Price | -10% $362 | -5% $309 | +0% $256 | +5% $203 | +10% $150 |
|---|---|---|---|---|---|
| Rent | -10% $115 | -5% $186 | +0% $256 | +5% $326 | +10% $397 |
| Rate | -1.0pp $350 | -0.5pp $304 | base $256 | +0.5pp $207 | +1.0pp $158 |
UW: 25.0% down · 7.5% · 30yr · 1.5% tax · 5.0% vac · 8.0% maint · 8.0% mgmt
Financing live
Cash to close
- Down payment
- $46,875
- Closing costs
- $5,625
- Reserves months
- —
- Total cash needed
- —
Loan-product check · same deal, 3 products live
Conventional
25% down · 7.5% · 30yr
- Down + closing
- —
- Monthly P&I
- —
- Monthly cashflow
- —
- DSCR
- —
- Eligible?
- —
Personal DTI + credit; lowest rate.
DSCR
20% down · 8.5% · 30yr
- Down + closing
- —
- Monthly P&I
- —
- Monthly cashflow
- —
- DSCR
- —
- Eligible?
- —
No personal income docs; deal must DSCR.
Hard money
10% down · 12.0% · 12mo
- Down + closing
- —
- Monthly P&I
- —
- Monthly cashflow
- —
- DSCR
- —
- Eligible?
- —
Short-term bridge; refi at stabilization.
Rent comps 6 comps
| Address | Beds | Baths | Sqft | Rent | $/sqft | DOM | Units | Dist |
|---|---|---|---|---|---|---|---|---|
| 12097 Cavell St Livonia, MI | 3.0 | 1.0 | 985 | $1,200 | $1.22 | 3d | 1 | 0.08mi |
| 11726 Deering St Livonia, MI | 4.0 | 1.5 | 1248 | $2,125 | $1.70 | 0d | 1 | 0.21mi |
| 13231 Hemingway Redford, MI | 3.0 | 1.5 | 1074 | $1,700 | $1.58 | 17d | 1 | 0.88mi |
| 12107 Centralia Redford, MI | 3.0 | 1.0 | 912 | $1,800 | $1.97 | 44d | 1 | 0.95mi |
| 11141 Karen St Livonia, MI | 3.0 | 1.0 | 1322 | $1,950 | $1.48 | 11d | 1 | 0.97mi |
| 27201 Canfield St W Dearborn Heights, MI | 1.0–2.0 | 1.0–2.0 | 852 | $1,499 | $1.76 | 3d | 22 | 1.41mi |
Listing history 48 events
-
2026-06-21days on market $187,500 Active 11 DOM
-
2026-06-18days on market $187,500 Active 8 DOM
-
2026-06-17statusdays on market $187,500 Active 7 DOM
-
2026-05-13status Pending 535-char remark
Show marketing remark (535 chars)
Welcome home to this beautiful 3 bedroom brick ranch in Livonia. Step into the bright and inviting living room filled with natural light and an open layout that flows seamlessly into the kitchen, creating the perfect space for everyday living and entertainment. The home offers 3 nicely sized bedrooms, ideal for family, guest, or a home office. Located in highly sought after Livonia school district. Enjoy a spacious backyard, ideal for relaxing or entertaining. Close to restaurants, shops, and freeway. Schedule your showing today.
-
2026-05-13status Pending
Show marketing remark (535 chars)
Welcome home to this beautiful 3 bedroom brick ranch in Livonia. Step into the bright and inviting living room filled with natural light and an open layout that flows seamlessly into the kitchen, creating the perfect space for everyday living and entertainment. The home offers 3 nicely sized bedrooms, ideal for family, guest, or a home office. Located in highly sought after Livonia school district. Enjoy a spacious backyard, ideal for relaxing or entertaining. Close to restaurants, shops, and freeway. Schedule your showing today.
-
2026-05-07$187,500 Active 535-char remark
Show marketing remark (535 chars)
Welcome home to this beautiful 3 bedroom brick ranch in Livonia. Step into the bright and inviting living room filled with natural light and an open layout that flows seamlessly into the kitchen, creating the perfect space for everyday living and entertainment. The home offers 3 nicely sized bedrooms, ideal for family, guest, or a home office. Located in highly sought after Livonia school district. Enjoy a spacious backyard, ideal for relaxing or entertaining. Close to restaurants, shops, and freeway. Schedule your showing today.
-
2026-05-07$187,500 Active
Show marketing remark (535 chars)
Welcome home to this beautiful 3 bedroom brick ranch in Livonia. Step into the bright and inviting living room filled with natural light and an open layout that flows seamlessly into the kitchen, creating the perfect space for everyday living and entertainment. The home offers 3 nicely sized bedrooms, ideal for family, guest, or a home office. Located in highly sought after Livonia school district. Enjoy a spacious backyard, ideal for relaxing or entertaining. Close to restaurants, shops, and freeway. Schedule your showing today.
-
2025-09-30historical
-
2025-09-12status Active
-
2025-09-12status Active
-
2025-09-08status Pending
-
2025-09-08status Pending
-
2025-09-04$179,900 Active
-
2025-09-04$179,900 Active
-
2017-10-31soldstatus $89,900
-
2017-10-23soldstatus $89,900 Sold
-
2017-10-23soldstatus $89,900 Closed
-
2017-09-30status Pending
-
2017-09-30status Pending
-
2017-09-29status Active
-
2017-09-29status Active
-
2017-09-28status Pending
-
2017-09-28status Pending
-
2017-09-22$89,900 Active
-
2017-09-22$89,900 Active
-
2016-05-25historical
-
2016-05-25historical
-
2016-04-20price $92,900
-
2016-04-19price $92,900
-
2016-04-14status Active
-
2016-03-02historical
-
2016-03-01$94,900 Active
-
2015-05-09price $94,900
-
2015-04-19$99,900 Active
-
2009-06-09historical
-
2009-02-21$104,999
-
2008-04-30historical
-
2008-01-12$111,900
-
2007-12-31historical
-
2007-08-25$112,000
-
2007-08-25historical
-
2007-07-15$125,000
-
2007-07-15historical
-
2007-06-26$125,000
-
2004-02-06soldstatus $108,000
-
2003-12-03soldstatus $108,000
-
2003-09-04$112,900
-
1994-05-04soldstatus $64,000
ⓘ Source: listings_history table (triggers on properties + properties_extension) + one-shot
backfill from property_details.listing_events for pre-trigger history.
Tax reassessment forecast MI · Partial reset (capped growth)
- Current annual tax
- $1,098 · $92/mo
- Projected year-2 tax
- $1,993 · $166/mo
- Expected delta
- +$895/yr (+$75/mo · 81.5%)
ⓘ Screening estimate from a state-policy table — verify with the county assessor before closing.
Climate risk First Street
- Flood 6/10 Major FEMA zone X (unshaded) · 72% chance over 30 yrs
- Wildfire 1/10 Low
- Heat 3/10 Moderate 7 d/yr ≥98°F today · 15 d/yr by 30 yrs out
- Wind 2/10 Low
- Air quality 3/10 Moderate 2 unhealthy d/yr today · 3 by 30 yrs out
Nearby sold comps map
Loading sold comps map…
Walkable amenities ~0.75 mi
Loading nearby amenities…
Taxation est. · year 1
- Rental income
- $21,402
- − Mortgage interest
- −$10,503
- − Property taxes
- −$1,098
- − Insurance
- −$938
- − Repairs & maintenance
- −$1,712
- − Management
- −$1,712
- − Depreciation
- −$5,455
- Taxable loss
- −$16
- Est. tax savings @ 24.0%
- +$4
- After-tax cash flow
- $3,076/yr
For passive investors: Depreciation is non-cash, so a rental often shows a tax loss while cash-flowing — sheltering income. Rental losses are passive: they offset passive income freely, and up to $25,000/yr can offset ordinary (W-2) income if you actively participate and your MAGI is under $100k (phasing out to $0 by $150k); unused losses carry forward. On sale, claimed depreciation is recaptured at up to 25%, and gains may owe capital-gains tax (a 1031 exchange can defer both). Figures are a year-1 estimate at your 24.0% rate — not tax advice; consult a CPA.
Schools (NCES district)
- District
- Livonia Public Schools School District
- NCES district ID
- 2621840
- Math proficiency
- 46% ▼ -5.00%
- Reading proficiency
- 59% ▬ 0.00%
- Median HH income
- $65,268
- Composite
- 46.27/100
- National rank
- #2480
- State rank
- #77 of 540 in MI
Livability — Livonia
- Score
- 77/100
- State rank
- #116
- US rank
- #2784
Category grades
Schools grade is shown separately in the Schools card above.
Census & demographics
- Census place
- Livonia, MI
- County
- Wayne County · 1,562,939 people
- City population
- 56,806
- Metro
- Detroit-Warren-Dearborn, MI
- Population (ZIP)
- 26,687
- Household income
- $97,997
- Rent vs Own
- Severe rent burden
- 110.0
Population outlook (Wayne County) Hauer SSP2
- Today (2025)
- 1,675,273 people
- By 2030
- 1,620,300 · -3.3%
- By 2040
- 1,502,341 · -10.3%
- By 2050
- 1,384,039 · -17.4%
- By 2075
- 1,124,592 · -32.9%
- By 2100
- 881,193 · -47.4%
Race, ethnicity, and origin ACS 2023
- Neighborhood character
- Predominantly White (84%)
- Race & ethnicity
- White 84% Two or more races 7% Hispanic / Latino 5% Black 3% Asian 2%
- Common ancestry
- Romanian 13% Italian 5% Lithuanian 4%
- Foreign-born
- 7% · Canada, South Korea, China
- Languages at home
- 90% English-only · Other Indo-European 2% Spanish 2% Arabic 2%
Political lean MEDSL · Wayne
- 2024 margin
- Strong D (+29.0) · D 62.7% · R 33.7% · Other 3.6%
- 2008→2024 swing
- -20.5pp toward R · 2008: 49.5pp · 2024: 29.0pp
- All cycles
- 2024: D+29.0 2020: D+38.1 2016: D+37.3 2012: D+46.9 2008: D+49.5
Not yet ingested
- Civics
- —
Market trends
- HPI YoY
- ▼ -341.08%
- Current HPI
- 197.495
- Rent YoY
- —
- Metro
- Detroit-Warren-Dearborn, MI
- State GDP YoY
- ▲ 1.37%
- F500 in state
- 28
Industry mix (Fortune 500 HQ in MI)
| Industry | F500 HQs | Revenue |
|---|---|---|
| Automotive Parts | 3 | $48B |
|
||
| Automotive | 2 | $372B |
|
||
| Chemicals | 1 | $45B |
|
||
| Automotive Retail | 1 | $29B |
|
||
| Healthcare / Medical Devices | 1 | $23B |
|
||
| Automotive Technology | 1 | $20B |
|
||
Price history
+193.0% since first listed45 events — show timeline
- 2026-05-13 Pending — MiRealSource-MiMLS
- 2026-05-13 Pending — REALCOMP
- 2026-05-07 Listed $187,500 REALCOMP
- 2026-05-07 Listed $187,500 MiRealSource-MiMLS
- 2025-09-30 Listing Removed — MiRealSource-MiMLS
- 2025-09-12 Relisted — MiRealSource-MiMLS
- 2025-09-12 Relisted — REALCOMP
- 2025-09-08 Pending — MiRealSource-MiMLS
- 2025-09-08 Pending — REALCOMP
- 2025-09-04 Listed $179,900 REALCOMP
- 2025-09-04 Listed $179,900 MiRealSource-MiMLS
- 2017-10-31 Sold (Public Records) $89,900 Public Records
- 2017-10-23 Sold (MLS) $89,900 MiRealSource-MiMLS
- 2017-10-23 Sold (MLS) $89,900 REALCOMP
- 2017-09-30 Pending — MiRealSource-MiMLS
- 2017-09-30 Pending — REALCOMP
- 2017-09-29 Relisted — MiRealSource-MiMLS
- 2017-09-29 Relisted — REALCOMP
- 2017-09-28 Pending — MiRealSource-MiMLS
- 2017-09-28 Pending — REALCOMP
- 2017-09-22 Listed $89,900 MiRealSource-MiMLS
- 2017-09-22 Listed $89,900 REALCOMP
- 2016-05-25 Listing Removed — REALCOMP
- 2016-05-25 Listing Removed — MiRealSource-MiMLS
- 2016-04-20 Price Changed $92,900 MiRealSource-MiMLS
- 2016-04-19 Price Changed $92,900 REALCOMP
- 2016-04-14 Relisted — MiRealSource-MiMLS
- 2016-03-02 Listing Removed — MiRealSource-MiMLS
- 2016-03-01 Listed $94,900 MiRealSource-MiMLS
- 2015-05-09 Price Changed $94,900 REALCOMP
- 2015-04-19 Listed $99,900 REALCOMP
- 2009-06-09 Listing Removed — REALCOMP
- 2009-02-21 Listed $104,999 REALCOMP
- 2008-04-30 Listing Removed — REALCOMP
- 2008-01-12 Listed $111,900 REALCOMP
- 2007-12-31 Listing Removed — REALCOMP
- 2007-08-25 Listing Removed — REALCOMP
- 2007-08-25 Listed $112,000 REALCOMP
- 2007-07-15 Listing Removed — REALCOMP
- 2007-07-15 Listed $125,000 REALCOMP
- 2007-06-26 Listed $125,000 REALCOMP
- 2004-02-06 Sold (Public Records) $108,000 Public Records
- 2003-12-03 Sold (MLS) $108,000 REALCOMP
- 2003-09-04 Listed $112,900 REALCOMP
- 1994-05-04 Sold (Public Records) $64,000 Public Records
Property tax history
-3.9%/yrLatest (2025): $1,098 · -44.2% YoY. Source: county tax records.
Cash-flow waterfall
monthlySold comps — $/sqft
last 12 mo · ≤1 miLoading sold comps…