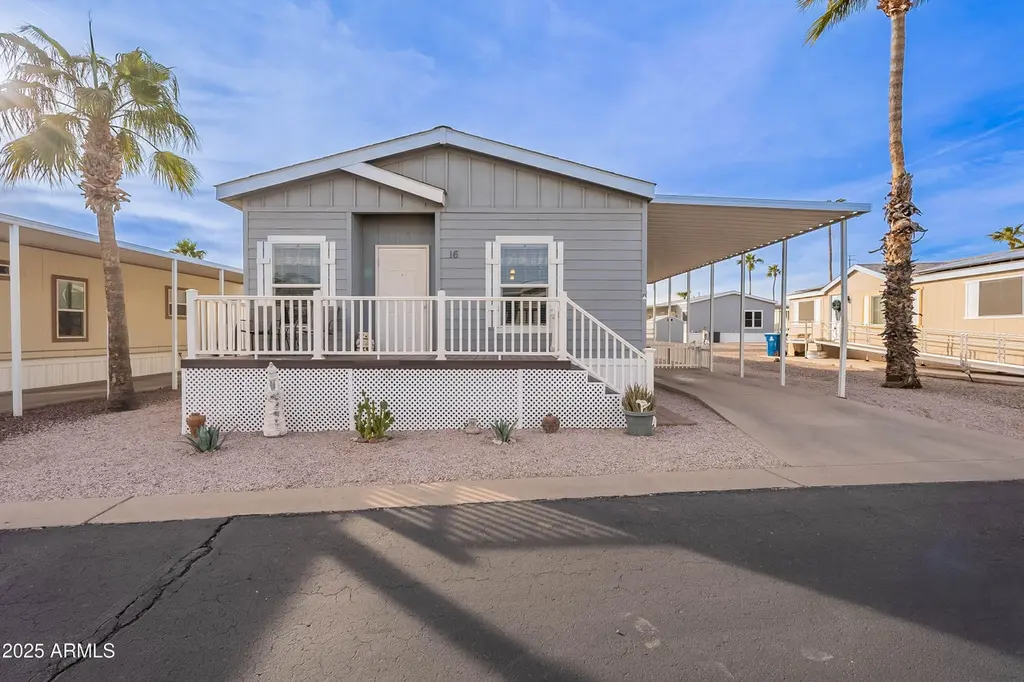
2000 S Apache Rd #16 · Buckeye, AZ
Flood risk No data
- FEMA flood zone
- —
- Chance of flooding over 30 yrs
- —
- Est. flood insurance / yr
- —
Fire risk No data
- Est. fire insurance / yr
- —
Heat risk No data
- Hot days now (above threshold)
- —
- Hot days in 30 yrs
- —
Wind risk No data
- Chance of severe wind over 30 yrs
- —
Air-quality risk No data
- Unhealthy air days now
- —
- Unhealthy air days in 30 yrs
- —
Risk factors via First Street. Map © Google.
Why this score? — see what drove the B- grade
The composite is a weighted blend of 9 inputs, each scored 0–100. Each bar is that input's sub-score; the figure is the points it added to the 100-point composite (weight × sub-score).
- Cash flow +30.0/30.0
- 1% rule +10.0/10.0
- DSCR +10.0/10.0
- ARV discount +7.5/15.0
- Condition / age +3.8/5.0
- Livability +3.4/5.0
- Rent growth +2.3/5.0
- Schools +2.3/10.0
- Appreciation +0.0/10.0
$119,900
🖨 Deal sheet 📄 Offer letter ✓ Due diligence
Listing remarks
Welcome home to this cozy and well-maintained 3-bedroom, 2-bathroom manufactured home, offering just over 1,200 square feet of comfortable living space. Perfectly situated in the heart of Buckeye, this property combines convenience and charm, making it an excellent choice for first-time buyers, down-sizers, or anyone looking for a low-maintenance lifestyle. Inside, you'll find an open and inviting layout with a functional kitchen, ample cabinetry, and a dedicated dining area. The living room is bright and welcoming, creating the perfect space for relaxing or entertaining guests. Each of the three bedrooms offers comfortable accommodations, while the two full bathrooms provide added convenie
Key facts
- 4 parking spots
- Community pool
- Built 2016
Property features AI
Finance
- HOA & community: Land lease community with monthly land lease fee of $561; Association maintains grounds; Community amenities: pool, playground, fitness center
Exterior
- Parking: 2 covered parking spaces; 2 open parking spaces; 2 carport spaces
- Utilities: City water; Public sewer
- Home design: Manufactured/mobile home; Leasehold ownership
- Construction: Wood frame construction; Painted exterior; Composition roof
- Exterior features: Gravel/stone front yard; Gravel/stone backyard; Fenced (other)
Interior
- Kitchen: Refrigerator; Dishwasher; Built-in microwave; Kitchen island
- Bedrooms: Up to 3 bedrooms
- Flooring: Carpet; Laminate
- Bathrooms: 2 full bathrooms
- Heating & cooling: Natural gas heating; Ceiling fans; Other cooling
- Interior features: Double vanity; Eat-in kitchen; Breakfast bar; Kitchen island
- Laundry & utility: Indoor laundry with washer/dryer hookup
Neighborhood map
What this means for you Summary
Snapshot
- This is a 3-bed/2.0-bath manufactured listed at $120k. Condition is rated good.
Deal economics
- At list price, monthly cash flow is $837 ($10k/yr) — positive.
- The deal already cash-flows at list — no discount required.
- Meets the 1% rule at list price ($2k rent vs $120k).
- Recommended offer: $116k (3.0% below list) — sets the bar for market timing.
- Cap rate 14.7% vs local median 3.1% in Buckeye — top-decile yield for the area; either an underpriced asset or a hidden risk that comps aren't pricing in. Stress-test before assuming the spread holds.
Location & tenants
- Location reads 68/100 on livability (#53 in AZ) — a middle-class / working-renter tenant base. Strengths: employment A+, housing A+, crime A; Watch: amenities F, commute F, health & safety F.
- Buckeye Union High School District (4284) (town): math 21% / reading 29% proficiency, ranked #129 of 249 in AZ (top 52%) — low school quality limits family demand, transient renter base, plan for 1-2y turnover.
- Zoned schools: Youngker High School (math 21% / reading 26%, grade F, #206 of 381 statewide, top 54%, 2,099 students, 49% FRL).
- Market conditions: Rents soft (-0.9%/yr); 1196 active listings in the ZIP; 9 comparable units currently listed for rent nearby; rentals leasing fast (median 1d on market — plan ~1-2 weeks tenant-placement turnaround); solid renter incomes; 36,011 units permitted in Maricopa County in 2024 (12,801 in 5+ unit buildings).
Forward outlook
- Local home prices are declining (-3.0%/yr); year-one equity from $829 of loan paydown is wiped out by about $4k of value loss. Plan a longer hold.
- Maricopa County population projected at +38% by 2050 — long-run rental-demand tailwind backs the buy-and-hold thesis.
- At projected returns (-3.0% appreciation + 0.0% rent growth), your $34k cash investment doubles in ~5 years — after that, you're playing with house money.
Negotiation context
- It's been on market 35 days — a 3% lower offer ($116k) is reasonable based on typical stale-listing flexibility.
- 3 sale attempts since 12y ago with the ask held roughly flat each time — persistent listings suggest the price (not the market) is what's stuck; bring a comps-based counter.
Questions for the listing agent
- It's been on market 35 days. Have you received any prior offers? Is the seller open to a 3% concession, seller financing, or rate buy-down credit?
- Is there a deadline driving the sale (1031 exchange, divorce, estate, relocation)? That informs how much negotiation room exists.
- Schools are D-rated, which usually means shorter tenancies and higher turnover. Who's the typical renter profile here, and what's been the actual vacancy rate?
- What's the average days-on-market for RENTAL listings here right now (not sales)? A rising rental-DOM trend means longer vacancies and softer asking-rent achievability than the comps imply.
- What's the recent tenant-quality profile in this submarket — average credit score on applications, eviction rate, late-payment / NSF rate, and stable-employment percentage? A property-management company in the area should have these aggregated.
- How much new for-sale + rental construction is in the pipeline within 1–3 miles? Heavy new supply typically softens prices + rents 12–24 months out; constrained supply supports both.
Investment metrics
- 1% rule
- 1.76% ✓
- Cap rate
- 14.67%
- Cash-on-cash
- 29.91%
- DSCR
- 2.33
- GRM
- 4.7
CMA / ARV
- ARV (on-the-fly)
- $119,808
- Comps found
- 12
Show comp detail 12 sales within ~0.75 mi
| Address | Dist | Beds/Ba | Sqft | Sold | Price | $/sf | Match |
|---|---|---|---|---|---|---|---|
| 2000 S Apache Rd #16 | 0.00mi | 3/2.0 | 1,248 (0%) | 0mo | $120,000 | $96 | 100 |
| 2000 S Apache Rd #400 | 0.00mi | 3/2.0 | 1,296 (+4%) | 11mo | $125,000 | $96 | 84 |
| 2000 S Apache Rd #241 | 0.00mi | 3/2.0 | 1,173 (-6%) | 9mo | $120,000 | $102 | 83 |
| 2000 S Apache Rd #144 | 0.00mi | 3/2.0 | 1,344 (+8%) | 6mo | $55,000 | $41 | 82 |
| 2000 S Apache Rd #125 | 0.00mi | 3/2.0 | 1,344 (+8%) | 8mo | $137,000 | $102 | 80 |
| 2000 S Apache Rd #100 | 0.00mi | 3/2.0 | 1,344 (+8%) | 12mo | $150,000 | $112 | 78 |
| 2000 S Apache Rd #18 | 0.00mi | 3/2.0 | 1,344 (+8%) | 12mo | $129,000 | $96 | 77 |
| 2000 S Apache Rd #87 | 0.40mi | 3/2.0 | 1,344 (+8%) | 8mo | $113,000 | $84 | 62 |
| 2000 S Apache Rd #371 | 0.54mi | 3/2.0 | 1,344 (+8%) | 2mo | $160,000 | $119 | 61 |
| 2000 S Apache Rd #126 | 0.53mi | 3/2.0 | 1,334 (+7%) | 7mo | $120,000 | $90 | 58 |
| 2000 S Apache Rd #67 | 0.54mi | 4/2.0 (+1) | 1,344 (+8%) | 4mo | $104,900 | $78 | 53 |
| 2000 S Apache Rd #296 | 0.55mi | 3/2.0 | 1,396 (+12%) | 11mo | $152,000 | $109 | 45 |
Match score weights: distance 35% · size 25% · config 20% · recency 20%. Top-matched comps best support the ARV.
Projected returns pro-forma
-3.0% appreciation · 0.0% rent growth · sell at horizon
- IRR
- 21.0%
- Equity multiple
- 1.83×
- Total profit
- $27,726
- Equity at exit
- $17,877
- IRR
- 27.1%
- Equity multiple
- 3.06×
- Total profit
- $69,029
- Equity at exit
- $10,367
Cash invested: $33,572 (down + closing). Projections, not guarantees.
Landlord ↔ Tenant lean methodology
- Overall (STATE)
- 87 Strongly Landlord-Friendly
- State Arizona
- 87 Strongly Landlord-Friendly · R+3
- County
- — inherits STATE
- City
- — inherits STATE
ZIP-level market 85326
- Home prices YoY
- -32.5%
- Rents YoY
- -0.9%
- Active inventory
- 1196
- Price-to-rent
- 4.7×
Monthly cashflow live
- Estimated rent
- $2,108 high interval (Pro) →
- Mortgage (P&I)
- −$629
- Tax est. 1.5%
- −$150 /mo · $1,798/yr
- Insurance
- −$50
- HOA
- −$0
- Vacancy / Maint / Mgmt
- −$443
- Net cashflow
- $837
Break-even live
UW: 25.0% down · 7.5% · 30yr · 1.5% tax · 5.0% vac · 8.0% maint · 8.0% mgmt
Financing live
Cash to close
- Down payment
- $29,975
- Closing costs
- $3,597
- Reserves months
- —
- Total cash needed
- —
Loan-product check · same deal, 3 products live
Conventional
25% down · 7.5% · 30yr
- Down + closing
- —
- Monthly P&I
- —
- Monthly cashflow
- —
- DSCR
- —
- Eligible?
- —
Personal DTI + credit; lowest rate.
DSCR
20% down · 8.5% · 30yr
- Down + closing
- —
- Monthly P&I
- —
- Monthly cashflow
- —
- DSCR
- —
- Eligible?
- —
No personal income docs; deal must DSCR.
Hard money
10% down · 12.0% · 12mo
- Down + closing
- —
- Monthly P&I
- —
- Monthly cashflow
- —
- DSCR
- —
- Eligible?
- —
Short-term bridge; refi at stabilization.
Rent comps 9 comps
| Address | Beds | Baths | Sqft | Rent | $/sqft | DOM | Units | Dist |
|---|---|---|---|---|---|---|---|---|
| 24485 W Yuma Rd Buckeye, AZ | 1.0–3.0 | 1.0–2.5 | 1090 | $1,950 | $1.79 | 1d | 1 | 0.12mi |
| 2000 S Apache Rd Buckeye, AZ | 3.0 | 3.0 | 1456 | $1,600 | $1.10 | 12d | 1 | 0.54mi |
| 24458 W Verlea Dr Buckeye, AZ | 3.0 | 2.0 | 1345 | $2,198 | $1.63 | 1d | 1 | 0.77mi |
| 1868 S 240th Ave Buckeye, AZ | 4.0 | 2.0 | 1449 | $2,050 | $1.41 | 1d | 1 | 0.89mi |
| 1868 S 240th Ave Buckeye, AZ | 4.0 | 2.0 | 1449 | $2,100 | $1.45 | 17d | 1 | 0.89mi |
| 1044 S 239th Ln Buckeye, AZ | 3.0 | 2.0 | 1298 | $1,935 | $1.49 | 14d | 1 | 0.89mi |
| 24068 W Whyman Ave Buckeye, AZ | 4.0 | 2.0 | 1450 | $2,400 | $1.66 | 1d | 1 | 0.94mi |
| 23683 W Yuma Rd Buckeye, AZ | 1.0–3.0 | 1.0–2.0 | 1034 | $1,823 | $1.76 | 1d | 30 | 1.26mi |
| 23809 W Adams St Buckeye, AZ | 3.0 | 2.0 | 1400 | $1,725 | $1.23 | 1d | 1 | 1.43mi |
Listing history 13 events
-
2026-05-15status Pending
-
2026-04-27historical Under Contract Accepting Backups
-
2026-04-10$119,900 Active
-
2026-02-23historical
-
2025-09-01price $129,000
-
2025-06-27price $139,950
-
2025-05-05price $140,000
-
2025-03-01price $150,000
-
2025-01-27$155,000 Active
-
2015-12-31historical
-
2015-03-18price $55,000
-
2015-02-05price $65,000
-
2014-06-30$85,000 Active
ⓘ Source: listings_history table (triggers on properties + properties_extension) + one-shot
backfill from property_details.listing_events for pre-trigger history.
Nearby sold comps map
Loading sold comps map…
Walkable amenities ~0.75 mi
Loading nearby amenities…
Taxation est. · year 1
- Rental income
- $25,298
- − Mortgage interest
- −$6,716
- − Property taxes
- −$1,798
- − Insurance
- −$600
- − Repairs & maintenance
- −$2,024
- − Management
- −$2,024
- − Depreciation
- −$3,488
- Taxable income
- $8,648
- Est. tax owed @ 24.0%
- −$2,076
- After-tax cash flow
- $7,967/yr
For passive investors: Depreciation is non-cash, so a rental often shows a tax loss while cash-flowing — sheltering income. Rental losses are passive: they offset passive income freely, and up to $25,000/yr can offset ordinary (W-2) income if you actively participate and your MAGI is under $100k (phasing out to $0 by $150k); unused losses carry forward. On sale, claimed depreciation is recaptured at up to 25%, and gains may owe capital-gains tax (a 1031 exchange can defer both). Figures are a year-1 estimate at your 24.0% rate — not tax advice; consult a CPA.
Condition & rehab AI · 12 photos
This well-maintained 3-bedroom, 2-bathroom manufactured home is move-in ready with good condition and potential for quick, low-cost improvements to enhance its curb appeal and value.
Value-add opportunities
- Resale paint exterior shutters — Enhances curb appeal and can be a quick, low-cost improvement.
- Both update flooring — Hardwood floors are durable and can increase both resale and rental value.
- Both update kitchen cabinets — Dark wood cabinets can be updated with lighter colors or new materials to increase both resale and rental value.
- Both update bathrooms — Double vanity and tiled walls can be updated with modern fixtures and materials to increase both resale and rental value.
Renovation cost estimate screening
Value-add ROI direction
- Resale paint exterior shutters — Enhances curb appeal and can be a quick, low-cost improvement. ↑
- Both update flooring — Hardwood floors are durable and can increase both resale and rental value. ↑
- Both update kitchen cabinets — Dark wood cabinets can be updated with lighter colors or new materials to increase both resale and rental value. ↑
- Both update bathrooms — Double vanity and tiled walls can be updated with modern fixtures and materials to increase both resale and rental value. ↑
ⓘ Cost ranges are severity-bucket heuristics (US national rule-of-thumb). Get contractor quotes + a written scope before underwriting a rehab budget.
Schools (NCES district)
- District
- Buckeye Union High School District (4284)
- NCES district ID
- 0401410
- Math proficiency
- 21% ▼ -30.00%
- Reading proficiency
- 29% ▼ -8.00%
- Median HH income
- $59,182
- Composite
- 22.91/100
- National rank
- #7995
- State rank
- #129 of 249 in AZ
Livability — Buckeye
- Score
- 68/100
- State rank
- #53
- US rank
- #9428
Category grades
Schools grade is shown separately in the Schools card above.
Census & demographics
- Census place
- Buckeye, AZ
- County
- Maricopa County · 4,537,380 people
- City population
- 117,540
- Metro
- Phoenix-Mesa-Chandler, AZ
- Population (ZIP)
- 75,359
- Household income
- $89,876
- Rent vs Own
- Severe rent burden
- 661.0
Population outlook (Maricopa County) Hauer SSP2
- Today (2025)
- 4,979,203 people
- By 2030
- 5,378,229 · +8.0%
- By 2040
- 6,156,598 · +23.6%
- By 2050
- 6,872,376 · +38.0%
- By 2075
- 8,401,270 · +68.7%
- By 2100
- 9,247,439 · +85.7%
Race, ethnicity, and origin ACS 2023
- Neighborhood character
- Diverse neighborhood (Simpson 0.60)
- Race & ethnicity
- Hispanic / Latino 50% White 38% Two or more races 13% Black 7% Native American 2% Asian 1%
- Hispanic origin (detail)
- Mexican 44%
- Common ancestry
- Lithuanian 2% Slovak 1% Italian 1%
- Foreign-born
- 12% · Canada
- Languages at home
- 66% English-only · Spanish 32%
Political lean MEDSL · Maricopa
- 2024 margin
- Toss-up / Even · D 47.7% · R 51.2% · Other 1.1%
- 2008→2024 swing
- +7.1pp toward D · 2008: -10.6pp · 2024: -3.5pp
- All cycles
- 2024: R+3.5 2020: D+2.2 2016: R+3.5 2012: R+12.0 2008: R+10.6
Not yet ingested
- Civics
- —
Market trends
- HPI YoY
- ▼ -138.00%
- Current HPI
- 286.9242
- Rent YoY
- ▼ -0.92%
- Metro
- Phoenix-Mesa-Chandler, AZ
- State GDP YoY
- ▲ 4.54%
- F500 in state
- 20
Industry mix (Fortune 500 HQ in AZ)
| Industry | F500 HQs | Revenue |
|---|---|---|
| Technology | 2 | $13B |
|
||
| Mining / Metals | 1 | $23B |
|
||
| Environmental Services | 1 | $16B |
|
||
| Metals / Steel | 1 | $14B |
|
||
| Technology Distribution | 1 | $9B |
|
||
| Homebuilding | 1 | $8B |
|
||
Price history
+41.1% since first listed13 events — show timeline
- 2026-05-15 Pending — ARMLS
- 2026-04-27 Contingent — ARMLS
- 2026-04-10 Listed $119,900 ARMLS
- 2026-02-23 Listing Removed — ARMLS
- 2025-09-01 Price Changed $129,000 ARMLS
- 2025-06-27 Price Changed $139,950 ARMLS
- 2025-05-05 Price Changed $140,000 ARMLS
- 2025-03-01 Price Changed $150,000 ARMLS
- 2025-01-27 Listed $155,000 ARMLS
- 2015-12-31 Listing Removed — ARMLS
- 2015-03-18 Price Changed $55,000 ARMLS
- 2015-02-05 Price Changed $65,000 ARMLS
- 2014-06-30 Listed $85,000 ARMLS
Cash-flow waterfall
monthlySold comps — $/sqft
last 12 mo · ≤1 miLoading sold comps…