773 Eastern Parkway Unit 3C · New York, NY
Flood risk 1/10 · Minimal
- FEMA flood zone
- X (unshaded)
- Chance of flooding over 30 yrs
- 0.0%
- Est. flood insurance / yr
- $507 – $1,088
Fire risk 1/10 · Minimal
- Est. fire insurance / yr
- $691 – $1,283
Heat risk 6/10 · Moderate
- Hot days now (above 99°F)
- 7 days/yr
- Hot days in 30 yrs
- 14 days/yr
Wind risk 6/10 · Moderate
- Chance of severe wind over 30 yrs
- 64.0%
Air-quality risk 5/10 · Moderate
- Unhealthy air days now
- 6 days/yr
- Unhealthy air days in 30 yrs
- 8 days/yr
Risk factors via First Street. Map © Google.
Why this score? — see what drove the B grade
The composite is a weighted blend of 9 inputs, each scored 0–100. Each bar is that input's sub-score; the figure is the points it added to the 100-point composite (weight × sub-score).
- Cash flow +25.6/30.0
- Appreciation +10.0/10.0
- DSCR +8.5/10.0
- ARV discount +7.5/15.0
- 1% rule +6.7/10.0
- Schools +5.0/10.0
- Rent growth +4.0/5.0
- Livability +3.8/5.0
- Condition / age +3.8/5.0
$285,000
🖨 Deal sheet (PDF) 📄 Offer letter ✓ Due diligence
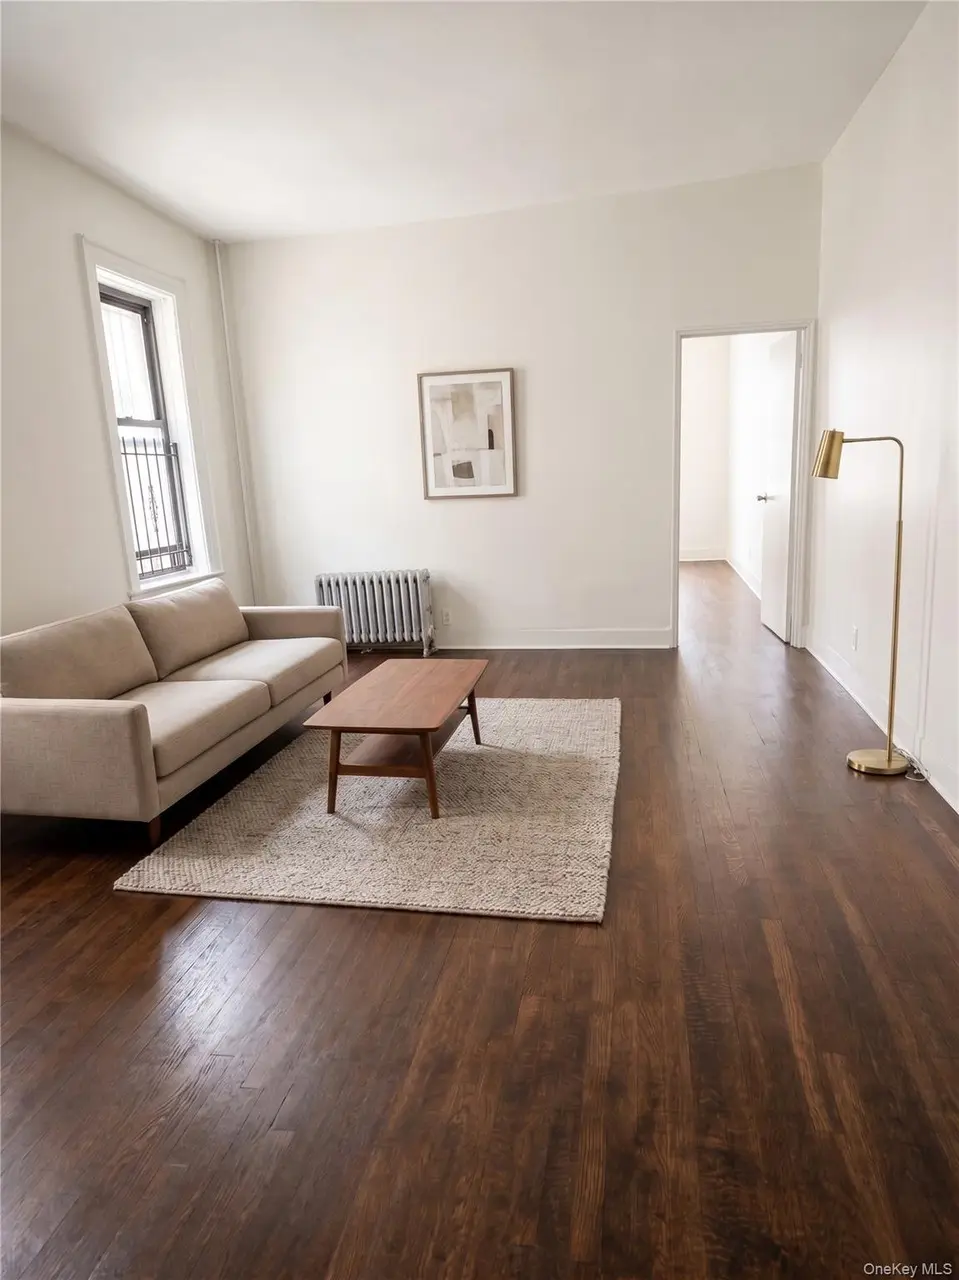
Listing remarks
Welcome to this bright , spacious one-bedroom HDFC coop. It's ideally situated on a vibrant, tree-lined stretch of Eastern parkway in crown Heights, Brooklyn. Located on the third floor, this inviting home features a generously sized bedroom, living and dining room (Living room photo is virtually enhanced). Over-sized bedroom offers excellent comfort and storage potential. There's a full, windowed kitchen and bathroom, too. Adequate eat-in kitchen offers new, stainless steel appliances. Set back from the sidewalk, the residence is meticulously maintained and it features a beautifully landscaped front garden. Enjoy the proximity to the world-renowned Brooklyn Museum, Brooklyn Children's M
Key facts
- Built 1905
- Listed 16 days
Property features AI
Finance
- Other: Building contains 16 total units; Pets allowed: cats and dogs
- HOA & community: Monthly association fee of $517
Exterior
- Home design: 4-story building; Entry level: 3
- Construction: Lot area about 2,412 (units not displayed)
- Exterior features: Residential single-family use; Lot approximately 37.0 x 129.83
Interior
- Kitchen: Energy-efficient appliances
- Bedrooms: Total of 3 rooms (bedroom count not specified)
- Bathrooms: 1 full bathroom
- Heating & cooling: Baseboard heating
- Interior features: Unfurnished; ENERGY STAR qualified appliances
- Laundry & utility: No building laundry
Neighborhood map
What this means for you Summary
Snapshot
- This is a 1-bed/1.0-bath single-family listed at $285k. Condition is rated good.
Deal economics
- At list price, monthly cash flow is $674 ($8k/yr) — positive.
- The deal already cash-flows at list — no discount required.
- Meets the 1% rule at list price ($3k rent vs $285k).
- Recommended offer: $281k (1.5% below list) — sets the bar for market timing.
- Cap rate 9.1% vs local median 2.6% in New York — top-decile yield for the area; either an underpriced asset or a hidden risk that comps aren't pricing in. Stress-test before assuming the spread holds.
Location & tenants
- Location reads 75/100 on livability (#268 in NY, #4,188 nationally) — a middle-class / working-renter tenant base. Strengths: amenities A+, commute A+, health & safety A; Watch: crime F, cost of living F.
- Market conditions: Rents rising fast (+6.0%/yr); 74 active listings in the ZIP; 11 comparable units currently listed for rent nearby; rentals at typical pace (median 22d on market — plan ~3-4 weeks tenant-placement turnaround); 10,063 units permitted in Kings County in 2024 (9,789 in 5+ unit buildings).
- At $3,346/mo this rent would consume 62% of the median local household income ($65k/yr) (locally 6603% of renters already pay >50% of income on rent) — very limited rent-growth headroom before tenants either downsize or default.
Forward outlook
- In year one you build about $30k of equity ($2k loan paydown + $28k appreciation (10.0% local appreciation)).
- Kings County population projected at +13% by 2050 — modest demand growth; plan on rents tracking national, not racing it.
- At projected returns (10.0% appreciation + 6.0% rent growth), your $80k cash investment doubles in ~2 years — after that, you're playing with house money.
- By year 2, paydown + projected appreciation supports a ~$49k cash-out refi (75% LTV) — recoverable capital for the next deal without selling this one.
Negotiation context
- It's been on market 17 days — a 2% lower offer ($281k) is reasonable based on typical stale-listing flexibility.
Risks & watch-outs
- Watch-outs: built in 1905 — expect roof / HVAC / electrical / plumbing capex.
- Climate carrying-cost: major wind risk, 64% chance of damaging wind over 30y; extreme-heat days projected 7→14/yr by 2055 (HVAC capex compounding) — expect insurance premiums to compound above CPI over the hold.
Questions for the listing agent
- Built in 1905 — when were the roof, HVAC, electrical panel, plumbing, and water heater last replaced?
- Is there a deadline driving the sale (1031 exchange, divorce, estate, relocation)? That informs how much negotiation room exists.
- Schools are B-rated — typically a magnet for longer-tenancy family renters. What's the average tenant stay here, and is there a school-zone premium baked into asking?
- Crime grade is F in this area — have there been break-ins, vandalism, or insurance claims at this property in the last 3 years? What carrier currently insures it and at what premium?
- What's the average days-on-market for RENTAL listings here right now (not sales)? A rising rental-DOM trend means longer vacancies and softer asking-rent achievability than the comps imply.
- What's the recent tenant-quality profile in this submarket — average credit score on applications, eviction rate, late-payment / NSF rate, and stable-employment percentage? A property-management company in the area should have these aggregated.
- How much new for-sale + rental construction is in the pipeline within 1–3 miles? Heavy new supply typically softens prices + rents 12–24 months out; constrained supply supports both.
Investment metrics
- 1% rule
- 1.17% ✓
- Cap rate
- 9.13%
- Cash-on-cash
- 10.13%
- DSCR
- 1.45
- GRM
- 7.1
CMA / ARV
No comps found within radius.
Projected returns pro-forma
10.0% appreciation · 5.95% rent growth · sell at horizon
- IRR
- 33.0%
- Equity multiple
- 3.61×
- Total profit
- $208,415
- Equity at exit
- $256,751
- IRR
- 29.5%
- Equity multiple
- 8.56×
- Total profit
- $603,467
- Equity at exit
- $553,692
Cash invested: $79,800 (down + closing). Projections, not guarantees.
Landlord ↔ Tenant lean methodology
- Overall (CITY)
- 0 Strongly Tenant-Friendly
- State New York
- 15 Strongly Tenant-Friendly · D+10
- County
- — inherits STATE
- City New York
- 0 Strongly Tenant-Friendly · D+34
ZIP-level market 11213
- Home prices YoY
- 4.3%
- Rents YoY
- 6.0%
- Active inventory
- 74
- Price-to-rent
- 7.1×
Monthly cashflow live
- Estimated rent
- $3,346 high interval (Pro) →
- Mortgage (P&I)
- −$1,495
- Tax est. 1.5%
- −$356 /mo · $4,275/yr
- Insurance
- −$119
- HOA
- −$0
- Vacancy / Maint / Mgmt
- −$703
- Net cashflow
- $674
Break-even live
Sensitivity live
| Price | -10% $871 | -5% $772 | +0% $674 | +5% $575 | +10% $477 |
|---|---|---|---|---|---|
| Rent | -10% $410 | -5% $542 | +0% $674 | +5% $806 | +10% $938 |
| Rate | -1.0pp $817 | -0.5pp $746 | base $674 | +0.5pp $600 | +1.0pp $525 |
UW: 25.0% down · 7.5% · 30yr · 1.5% tax · 5.0% vac · 8.0% maint · 8.0% mgmt
Financing live
Cash to close
- Down payment
- $71,250
- Closing costs
- $8,550
- Reserves months
- —
- Total cash needed
- —
Loan-product check · same deal, 3 products live
Conventional
25% down · 7.5% · 30yr
- Down + closing
- —
- Monthly P&I
- —
- Monthly cashflow
- —
- DSCR
- —
- Eligible?
- —
Personal DTI + credit; lowest rate.
DSCR
20% down · 8.5% · 30yr
- Down + closing
- —
- Monthly P&I
- —
- Monthly cashflow
- —
- DSCR
- —
- Eligible?
- —
No personal income docs; deal must DSCR.
Hard money
10% down · 12.0% · 12mo
- Down + closing
- —
- Monthly P&I
- —
- Monthly cashflow
- —
- DSCR
- —
- Eligible?
- —
Short-term bridge; refi at stabilization.
Rent comps 11 comps
| Address | Beds | Baths | Sqft | Rent | $/sqft | DOM | Units | Dist |
|---|---|---|---|---|---|---|---|---|
| 955 Sterling Pl #1936 Brooklyn, NY | 1.0 | 1.0 | 540 | $3,170 | $5.87 | 22d | 1 | 0.25mi |
| 955 Sterling Pl Unit 415 Brooklyn, NY | 2.0 | 1.0 | 680 | $5,150 | $7.57 | 26d | 1 | 0.27mi |
| 668 Nostrand Ave #1 Brooklyn, NY | 1.0 | 1.0 | 611 | $4,200 | $6.87 | 20d | 1 | 0.54mi |
| 565 Nostrand Ave Unit 1 Brooklyn, NY | — | 1.0 | 600 | $2,000 | $3.33 | 7d | 1 | 0.65mi |
| 1479 Sterling Pl Unit 3A Brooklyn, NY | — | 1.0 | 597 | $3,000 | $5.03 | 22d | 1 | 0.72mi |
| 1479 Sterling Pl Unit 1A Brooklyn, NY | — | 1.0 | 475 | $1,995 | $4.20 | 19d | 1 | 0.72mi |
| 649 Winthrop St Brooklyn, NY | 1.0 | 1.0 | 500 | $2,500 | $5.00 | 26d | 1 | 0.85mi |
| 552 Prospect Pl Unit 3A Brooklyn, NY | 1.0 | 1.0 | 676 | $4,500 | $6.66 | 26d | 1 | 0.88mi |
| 198 Hancock St Brooklyn, NY | 1.0 | 1.0 | 400 | $2,450 | $6.12 | 26d | 1 | 0.91mi |
| 328 Hancock St Brooklyn, NY | 2.0 | 1.0 | 500 | $2,800 | $5.60 | 26d | 1 | 0.91mi |
| 755 Washington Ave Brooklyn, NY | 1.0 | 1.0 | 700 | $1,800 | $2.57 | 22d | 1 | 1.08mi |
Listing history 15 events
-
2026-06-21days on market $285,000 Active 17 DOM
-
2026-06-18days on market $285,000 Active 14 DOM
-
2026-06-17days on market $285,000 Active 13 DOM
-
2026-06-16days on market $285,000 Active 12 DOM
-
2026-06-15days on market $285,000 Active 11 DOM
-
2026-06-13days on market $285,000 Active 9 DOM
-
2026-06-09days on market $285,000 Active 5 DOM
-
2026-06-08days on market $285,000 Active 4 DOM
-
2026-06-07pricedays on market $285,000 Active 3 DOM
-
2026-06-03days on market $300,000 Active 320 DOM
-
2026-06-01days on market $300,000 Active 318 DOM
-
2026-05-31days on market $300,000 Active 317 DOM
-
2026-04-30price $300,000
-
2025-11-19price $325,000
-
2025-07-18$350,000 Active
ⓘ Source: listings_history table (triggers on properties + properties_extension) + one-shot
backfill from property_details.listing_events for pre-trigger history.
Climate risk First Street
- Flood 1/10 Low FEMA zone X (unshaded) · 0% chance over 30 yrs
- Wildfire 1/10 Low
- Heat 6/10 Major 7 d/yr ≥99°F today · 14 d/yr by 30 yrs out
- Wind 6/10 Major 64% chance of damaging wind over 30 yrs
- Air quality 5/10 Major 6 unhealthy d/yr today · 8 by 30 yrs out
Nearby sold comps map
Loading sold comps map…
Walkable amenities ~0.75 mi
Loading nearby amenities…
Taxation est. · year 1
- Rental income
- $40,154
- − Mortgage interest
- −$15,964
- − Property taxes
- −$4,275
- − Insurance
- −$1,425
- − Repairs & maintenance
- −$3,212
- − Management
- −$3,212
- − Depreciation
- −$8,291
- Taxable income
- $3,774
- Est. tax owed @ 24.0%
- −$906
- After-tax cash flow
- $7,181/yr
For passive investors: Depreciation is non-cash, so a rental often shows a tax loss while cash-flowing — sheltering income. Rental losses are passive: they offset passive income freely, and up to $25,000/yr can offset ordinary (W-2) income if you actively participate and your MAGI is under $100k (phasing out to $0 by $150k); unused losses carry forward. On sale, claimed depreciation is recaptured at up to 25%, and gains may owe capital-gains tax (a 1031 exchange can defer both). Figures are a year-1 estimate at your 24.0% rate — not tax advice; consult a CPA.
Condition & rehab AI · 6 photos
This one-bedroom HDFC coop is in good condition with a good condition score of 75. It has a good roof, exterior, and interior, with minor cosmetic updates needed. The property is well-maintained and has a good curb appeal, making it a good investment opportunity.
Value-add opportunities
- Both Paint touch-ups — Enhances curb appeal and interior aesthetics.
- Both Landscaping improvements — Enhances curb appeal and adds value.
- Both New flooring — Improves aesthetics and adds value.
- Both New kitchen appliances — Modernizes the space and adds value.
- Both New bathroom fixtures — Modernizes the space and adds value.
Renovation cost estimate screening
Value-add ROI direction
- Both Paint touch-ups — Enhances curb appeal and interior aesthetics. ↑
- Both Landscaping improvements — Enhances curb appeal and adds value. ↑
- Both New flooring — Improves aesthetics and adds value. ↑
- Both New kitchen appliances — Modernizes the space and adds value. ↑
- Both New bathroom fixtures — Modernizes the space and adds value. ↑
ⓘ Cost ranges are severity-bucket heuristics (US national rule-of-thumb). Get contractor quotes + a written scope before underwriting a rehab budget.
Schools (NCES district)
No district data.
Livability — New York
- Score
- 75/100
- State rank
- #268
- US rank
- #4188
Category grades
Schools grade is shown separately in the Schools card above.
Census & demographics
- Census place
- New York, NY
- County
- Kings County · 2,614,986 people
- City population
- 7,731,280
- Metro
- New York-Newark-Jersey City, NY-NJ-PA
- Population (ZIP)
- 68,846
- Household income
- $65,127
- Rent vs Own
- Severe rent burden
- 6603.0
Population outlook (Kings County) Hauer SSP2
- Today (2025)
- 2,847,441 people
- By 2030
- 2,937,006 · +3.1%
- By 2040
- 3,095,491 · +8.7%
- By 2050
- 3,228,968 · +13.4%
- By 2075
- 3,321,723 · +16.7%
- By 2100
- 3,111,387 · +9.3%
Race, ethnicity, and origin ACS 2023
- Neighborhood character
- Diverse neighborhood (Simpson 0.61)
- Race & ethnicity
- Black 56% White 23% Hispanic / Latino 13% Two or more races 8% Asian 2%
- Hispanic origin (detail)
- Mexican 1% Puerto Rican 3% Dominican 4%
- Common ancestry
- Hispanic 5% Scotch-Irish 2% Romanian 1%
- Foreign-born
- 32% · Canada, Mexico, China
- Languages at home
- 76% English-only · Spanish 9% French/Haitian/Cajun 6% German/W. Germanic 2%
Political lean MEDSL · Kings
- 2024 margin
- Solid D (+44.0) · D 72.0% · R 28.0%
- 2008→2024 swing
- -15.5pp toward R · 2008: 59.4pp · 2024: 44.0pp
- All cycles
- 2024: D+44.0 2020: D+54.8 2016: D+61.8 2012: D+63.9 2008: D+59.4
Not yet ingested
- Civics
- —
Market trends
- HPI YoY
- ▲ 23.71%
- Current HPI
- 577.3841
- Rent YoY
- ▲ 5.95%
- Metro
- New York-Newark-Jersey City, NY-NJ-PA
- State GDP YoY
- ▲ 2.60%
- F500 in state
- 92
Industry mix (Fortune 500 HQ in NY)
| Industry | F500 HQs | Revenue |
|---|---|---|
| Financial Services | 10 | $950B |
|
||
| Consumer Goods | 9 | $162B |
|
||
| Insurance | 4 | $225B |
|
||
| Telecommunications | 2 | $144B |
|
||
| Pharmaceuticals | 2 | $112B |
|
||
| Media / Entertainment | 2 | $69B |
|
||
Price history
-14.3% since first listed3 events — show timeline
- 2026-04-30 Price Changed $300,000 RLS at REBNY
- 2025-11-19 Price Changed $325,000 RLS at REBNY
- 2025-07-18 Listed $350,000 RLS at REBNY
Cash-flow waterfall
monthlySold comps — $/sqft
last 12 mo · ≤1 miLoading sold comps…