 🏗️ New Construction
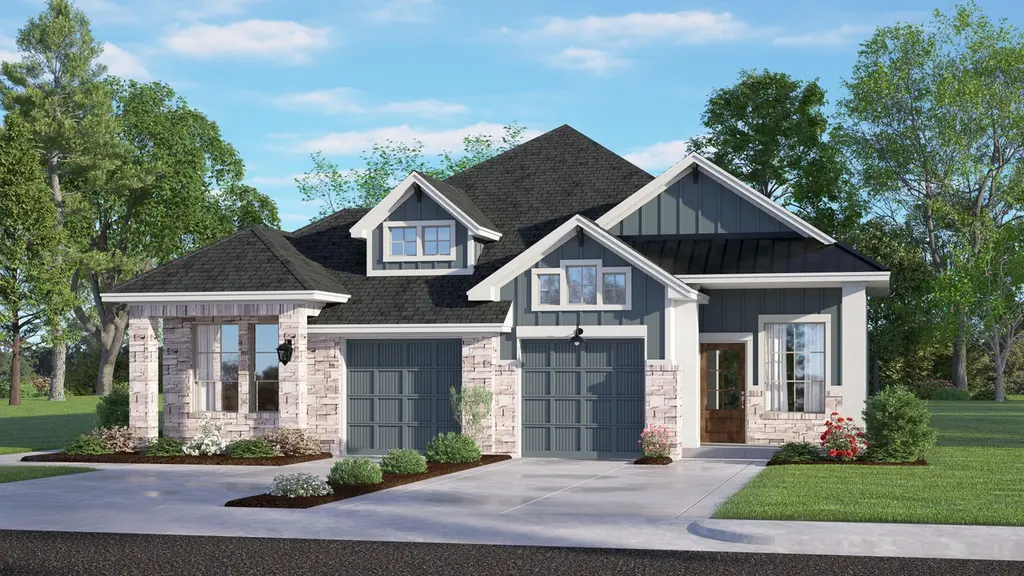
Countryside Plan · Iowa Colony, TX
Flood risk No data
- FEMA flood zone
- —
- Chance of flooding over 30 yrs
- —
- Est. flood insurance / yr
- —
Fire risk No data
- Est. fire insurance / yr
- —
Heat risk No data
- Hot days now (above threshold)
- —
- Hot days in 30 yrs
- —
Wind risk No data
- Chance of severe wind over 30 yrs
- —
Air-quality risk No data
- Unhealthy air days now
- —
- Unhealthy air days in 30 yrs
- —
Risk factors via First Street. Map © Google.
Why this score? — see what drove the D- grade
The composite is a weighted blend of 9 inputs, each scored 0–100. Each bar is that input's sub-score; the figure is the points it added to the 100-point composite (weight × sub-score).
- Cash flow +9.4/30.0
- ARV discount +7.5/15.0
- Condition / age +4.0/5.0
- Schools +3.9/10.0
- Livability +3.2/5.0
- 1% rule +2.8/10.0
- DSCR +2.6/10.0
- Rent growth +2.6/5.0
- Appreciation +0.0/10.0
$279,990
🖨 Deal sheet (PDF) 📄 Offer letter ✓ Due diligence
Listing remarks
One-story | 3 bedrooms | 2 baths | 1-car attached garage * * Photos are representative, selections & features may vary with community * *
Key facts
- Parking
- Listed 37 days
Property features AI
Finance
- Financial info: List price available (listing active)
Exterior
- Parking: 1 parking space
- Home design: Single-family home (plan: Countryside)
- Exterior features: Living area approximately 1,502 (living area provided)
Interior
- Bedrooms: 3 bedrooms
- Bathrooms: 2 full bathrooms
- Interior features: Active new construction plan (Countryside)
Neighborhood map
What this means for you Summary
Snapshot
- This is a 3-bed/2.0-bath single-family listed at $280k. Condition is rated good.
Deal economics
- At list price, monthly cash flow is $-224 ($-3k/yr) — negative.
- The deal already cash-flows at list — no discount required.
- To meet the 1% rule (rent ≥ 1% of price), the offer needs to be $247k (11.9% below list).
- Recommended offer: $247k (11.9% below list) — sets the bar for 1% rule.
- Cap rate 5.4% vs local median 4.2% in Iowa Colony — meaningfully above typical; check what's discounted (condition, days-on-market, listing class) to confirm the premium yield is real.
Location & tenants
- Location reads 64/100 on livability (#757 in TX) — a middle-class / working-renter tenant base. Strengths: crime A+, employment A+, cost of living A+; Watch: schools F, amenities F, commute F.
- Alvin ISD (suburban): math 39% / reading 48% proficiency, ranked #255 of 826 in TX (top 31%) — families likely to look elsewhere, expect single-tenant / working-renter base with shorter leases.
- Market conditions: Rents flat; 1148 active listings in the ZIP; 4 comparable units currently listed for rent nearby; rentals lingering (median 46d on market — plan ~5-8 weeks vacancy on turnover, expect pricing pressure); 50% of comp listings sitting > 30 days — soft ceiling on asking rent; high-income renter base; 3,960 units permitted in Brazoria County in 2024 (593 in 5+ unit buildings).
Forward outlook
- Local home prices are declining (-3.0%/yr); year-one equity from $2k of loan paydown is wiped out by about $9k of value loss. Plan a longer hold.
- Brazoria County population projected at +44% by 2050 — long-run rental-demand tailwind backs the buy-and-hold thesis.
Negotiation context
- It's been on market 37 days — a 3% lower offer ($272k) is reasonable based on typical stale-listing flexibility.
Questions for the listing agent
- What do current leases actually rent for vs. the listed asking? Can we see a recent rent roll and the last 12 months of T-12 income?
- It's been on market 37 days. Have you received any prior offers? Is the seller open to a 12% concession, seller financing, or rate buy-down credit?
- Is there a deadline driving the sale (1031 exchange, divorce, estate, relocation)? That informs how much negotiation room exists.
- Schools are F-rated, which usually means shorter tenancies and higher turnover. Who's the typical renter profile here, and what's been the actual vacancy rate?
- The area grade is low — what's the realistic commute time and amenity access for the typical tenant pool here? Any planned neighborhood developments (good or bad) we should know about?
- What's the average days-on-market for RENTAL listings here right now (not sales)? A rising rental-DOM trend means longer vacancies and softer asking-rent achievability than the comps imply.
- What's the recent tenant-quality profile in this submarket — average credit score on applications, eviction rate, late-payment / NSF rate, and stable-employment percentage? A property-management company in the area should have these aggregated.
- How much new for-sale + rental construction is in the pipeline within 1–3 miles? Heavy new supply typically softens prices + rents 12–24 months out; constrained supply supports both.
Investment metrics
- 1% rule
- 0.78% ✗
- Cap rate
- 5.44%
- Cash-on-cash
- -3.05%
- DSCR
- 0.86
- GRM
- 10.6
CMA / ARV
- ARV (median comp)
- $314,500
- List price
- $279,990
- Delta
- -10.97%
- Verdict
- UNDERPRICED
- Comps
- 20 within 1.0 mi
Show comp detail 12 sales within ~0.75 mi
| Address | Dist | Beds/Ba | Sqft | Sold | Price | $/sf | Match |
|---|---|---|---|---|---|---|---|
| 5210 Capricorn Way | 0.06mi | 3/2.0 | 1,441 (-4%) | 8mo | $274,990 | $191 | 84 |
| 5111 Getty Ln | 0.30mi | 3/2.0 | 1,631 (+9%) | 3mo | $344,990 | $212 | 70 |
| 10011 Agave Point Ct | 0.09mi | 3/2.0 | 1,714 (+14%) | 4mo | $309,000 | $180 | 69 |
| 5243 Palo Verde Dr | 0.11mi | 3/2.5 | 1,714 (+14%) | 1mo | $319,990 | $187 | 68 |
| 5258 Capricorn Way | 0.06mi | 3/2.5 | 1,699 (+13%) | 6mo | $265,000 | $156 | 68 |
| 10011 Nectar Path | 0.12mi | 3/2.0 | 1,714 (+14%) | 7mo | $300,000 | $175 | 65 |
| 10123 Crescendo Way | 0.14mi | 2/2.0 (-1) | 1,360 (-10%) | 10mo | $269,990 | $199 | 64 |
| 10011 Rosette Dr | 0.18mi | 3/2.0 | 1,714 (+14%) | 6mo | $325,000 | $190 | 63 |
| 5131 Getty Ln | 0.26mi | 3/2.0 | 1,685 (+12%) | 6mo | $389,055 | $231 | 62 |
| 10027 Nectar Path | 0.13mi | 3/2.0 | 1,714 (+14%) | 10mo | $324,990 | $190 | 62 |
| 10055 Nectar Path | 0.15mi | 3/2.0 | 1,714 (+14%) | 9mo | $300,000 | $175 | 62 |
| 10010 Rosette Dr | 0.21mi | 3/2.0 | 1,714 (+14%) | 7mo | $319,990 | $187 | 60 |
Match score weights: distance 35% · size 25% · config 20% · recency 20%. Top-matched comps best support the ARV.
Projected returns pro-forma
-3.0% appreciation · 0.44% rent growth · sell at horizon
- IRR
- -24.3%
- Equity multiple
- 0.19×
- Total profit
- $-71,373
- Equity at exit
- $46,893
- IRR
- -29.1%
- Equity multiple
- -0.19×
- Total profit
- $-104,512
- Equity at exit
- $27,192
Cash invested: $88,060 (down + closing). Projections, not guarantees.
Landlord ↔ Tenant lean methodology
- Overall (STATE)
- 87 Strongly Landlord-Friendly
- State Texas
- 87 Strongly Landlord-Friendly · R+5
- County
- — inherits STATE
- City
- — inherits STATE
ZIP-level market 77583
- Rents YoY
- 0.4%
- Active inventory
- 1148
- Price-to-rent
- 9.5×
Monthly cashflow live
- Estimated rent
- $2,468 medium interval (Pro) →
- Mortgage (P&I)
- −$1,649
- Tax est. 1.5%
- −$393 /mo · $4,718/yr
- Insurance
- −$131
- HOA
- −$0
- Vacancy / Maint / Mgmt
- −$518
- Net cashflow
- $-224
Break-even live
Sensitivity live
| Price | -10% $-6 | -5% $-115 | +0% $-224 | +5% $-332 | +10% $-441 |
|---|---|---|---|---|---|
| Rent | -10% $-419 | -5% $-321 | +0% $-224 | +5% $-126 | +10% $-29 |
| Rate | -1.0pp $-65 | -0.5pp $-144 | base $-224 | +0.5pp $-305 | +1.0pp $-388 |
UW: 25.0% down · 7.5% · 30yr · 1.5% tax · 5.0% vac · 8.0% maint · 8.0% mgmt
Financing live
Cash to close
- Down payment
- $78,625
- Closing costs
- $9,435
- Reserves months
- —
- Total cash needed
- —
Loan-product check · same deal, 3 products live
Conventional
25% down · 7.5% · 30yr
- Down + closing
- —
- Monthly P&I
- —
- Monthly cashflow
- —
- DSCR
- —
- Eligible?
- —
Personal DTI + credit; lowest rate.
DSCR
20% down · 8.5% · 30yr
- Down + closing
- —
- Monthly P&I
- —
- Monthly cashflow
- —
- DSCR
- —
- Eligible?
- —
No personal income docs; deal must DSCR.
Hard money
10% down · 12.0% · 12mo
- Down + closing
- —
- Monthly P&I
- —
- Monthly cashflow
- —
- DSCR
- —
- Eligible?
- —
Short-term bridge; refi at stabilization.
Rent comps 4 comps
| Address | Beds | Baths | Sqft | Rent | $/sqft | DOM | Units | Dist |
|---|---|---|---|---|---|---|---|---|
| 9510 Turnstone Dr Arcola, TX | 2.0 | 2.0 | 1892 | $2,495 | $1.32 | 0d | 1 | 0.65mi |
| 4143 Champlain Way Rosharon, TX | 3.0 | 3.0 | 1839 | $2,400 | $1.31 | 45d | 1 | 1.07mi |
| 10327 Armstrong Dr Rosharon, TX | 3.0 | 2.0 | 1956 | $2,291 | $1.17 | 45d | 1 | 1.15mi |
| 4018 Champlain Way Rosharon, TX | 3.0 | 2.5 | 1897 | $1,500 | $0.79 | 9d | 1 | 1.19mi |
Listing history 16 events
-
2026-06-21days on market $279,990 Active 37 DOM
-
2026-06-18days on market $279,990 Active 34 DOM
-
2026-06-17days on market $279,990 Active 33 DOM
-
2026-06-16days on market $279,990 Active 32 DOM
-
2026-06-15days on market $279,990 Active 31 DOM
-
2026-06-13days on market $279,990 Active 29 DOM
-
2026-06-13days on market $279,990 Active 28 DOM
-
2026-06-09days on market $279,990 Active 25 DOM
-
2026-06-08days on market $279,990 Active 24 DOM
-
2026-06-07days on market $279,990 Active 23 DOM
-
2026-06-04days on market $279,990 Active 20 DOM
-
2026-06-03days on market $279,990 Active 19 DOM
-
2026-06-02days on market $279,990 Active 18 DOM
-
2026-06-01days on market $279,990 Active 17 DOM
-
2026-05-31days on market $279,990 Active 16 DOM
-
2026-05-15$279,990 Active 145-char remark
ⓘ Source: listings_history table (triggers on properties + properties_extension) + one-shot
backfill from property_details.listing_events for pre-trigger history.
Nearby sold comps map
Loading sold comps map…
Walkable amenities ~0.75 mi
Loading nearby amenities…
Taxation est. · year 1
- Rental income
- $29,616
- − Mortgage interest
- −$17,617
- − Property taxes
- −$4,718
- − Insurance
- −$1,572
- − Repairs & maintenance
- −$2,369
- − Management
- −$2,369
- − Depreciation
- −$9,149
- Taxable loss
- −$8,179
- Est. tax savings @ 24.0%
- +$1,963
- After-tax cash flow
- $-722/yr
For passive investors: Depreciation is non-cash, so a rental often shows a tax loss while cash-flowing — sheltering income. Rental losses are passive: they offset passive income freely, and up to $25,000/yr can offset ordinary (W-2) income if you actively participate and your MAGI is under $100k (phasing out to $0 by $150k); unused losses carry forward. On sale, claimed depreciation is recaptured at up to 25%, and gains may owe capital-gains tax (a 1031 exchange can defer both). Figures are a year-1 estimate at your 24.0% rate — not tax advice; consult a CPA.
Condition & rehab AI · 1 photo
This one-story home is in good condition with minimal repairs needed. Upgrades to the exterior, interior, and systems can significantly increase its value for resale or rental.
Value-add opportunities
- Both Painting the exterior — Fresh paint can enhance curb appeal and property value.
- Both Landscaping the front yard — A well-maintained front yard can improve curb appeal and attract potential buyers/tenants.
- Both Interior touch-ups — Updating the interior can make the home more appealing and increase its value.
- Resale Upgrading the kitchen appliances — Modern appliances can attract more buyers and increase the home's resale value.
- Resale Upgrading the bathrooms — Upgraded bathrooms can significantly increase the home's resale value and attract more buyers.
- Both Upgrading the HVAC system — A newer, more efficient HVAC system can improve comfort and energy efficiency, benefiting both resale and rental value.
- Both Upgrading the flooring — Upgraded flooring can make the home more appealing and increase its value, both for resale and rental purposes.
Renovation cost estimate screening
Value-add ROI direction
- Both Painting the exterior — Fresh paint can enhance curb appeal and property value. ↑
- Both Landscaping the front yard — A well-maintained front yard can improve curb appeal and attract potential buyers/tenants. ↑
- Both Interior touch-ups — Updating the interior can make the home more appealing and increase its value. ↑
- Resale Upgrading the kitchen appliances — Modern appliances can attract more buyers and increase the home's resale value. ↑
- Resale Upgrading the bathrooms — Upgraded bathrooms can significantly increase the home's resale value and attract more buyers. ↑
- Both Upgrading the HVAC system — A newer, more efficient HVAC system can improve comfort and energy efficiency, benefiting both resale and rental value. ↑
- Both Upgrading the flooring — Upgraded flooring can make the home more appealing and increase its value, both for resale and rental purposes. ↑
ⓘ Cost ranges are severity-bucket heuristics (US national rule-of-thumb). Get contractor quotes + a written scope before underwriting a rehab budget.
Schools (NCES district)
- District
- Alvin ISD
- NCES district ID
- 4808090
- Math proficiency
- 39% ▼ -11.00%
- Reading proficiency
- 48% ▬ 0.00%
- Median HH income
- $66,740
- Composite
- 38.96/100
- National rank
- #4080
- State rank
- #255 of 826 in TX
Livability — Iowa Colony
- Score
- 64/100
- State rank
- #757
- US rank
- #13904
Category grades
Schools grade is shown separately in the Schools card above.
Census & demographics
- Census place
- Iowa Colony, TX
- County
- Brazoria County · 374,982 people
- City population
- 52,747
- Metro
- Houston-The Woodlands-Sugar Land, TX
- Population (ZIP)
- 52,747
- Household income
- $119,287
- Rent vs Own
- Severe rent burden
- 251.0
Population outlook (Brazoria County) Hauer SSP2
- Today (2025)
- 420,414 people
- By 2030
- 457,585 · +8.8%
- By 2040
- 532,232 · +26.6%
- By 2050
- 605,399 · +44.0%
- By 2075
- 779,358 · +85.4%
- By 2100
- 883,759 · +110.2%
Race, ethnicity, and origin ACS 2023
- Neighborhood character
- Highly diverse neighborhood (Simpson 0.70)
- Race & ethnicity
- Hispanic / Latino 38% Black 34% White 20% Two or more races 18% Asian 5%
- Hispanic origin (detail)
- Mexican 31% Puerto Rican 2%
- Common ancestry
- Lithuanian 1% Slovak 1% Romanian 1%
- Foreign-born
- 16% · Canada, Vietnam, China
- Languages at home
- 64% English-only · Spanish 28% Other Asian/Pacific 2% Vietnamese 1%
Political lean MEDSL · Brazoria
- 2024 margin
- R (+19.7) · D 39.5% · R 59.2% · Other 1.3%
- 2008→2024 swing
- +9.9pp toward D · 2008: -29.6pp · 2024: -19.7pp
- All cycles
- 2024: R+19.7 2020: R+18.2 2016: R+24.6 2012: R+34.2 2008: R+29.6
Not yet ingested
- Civics
- —
Market trends
- HPI YoY
- ▼ -120.19%
- Current HPI
- 198.6559
- Rent YoY
- ▲ 0.44%
- Metro
- Houston-The Woodlands-Sugar Land, TX
- State GDP YoY
- ▲ 3.95%
- F500 in state
- 110
Industry mix (Fortune 500 HQ in TX)
| Industry | F500 HQs | Revenue |
|---|---|---|
| Energy | 16 | $1,198B |
|
||
| Technology | 5 | $198B |
|
||
| Engineering / Construction | 4 | $72B |
|
||
| Energy Services | 3 | $60B |
|
||
| Utilities | 3 | $41B |
|
||
| Healthcare | 2 | $330B |
|
||
Cash-flow waterfall
monthlySold comps — $/sqft
last 12 mo · ≤1 miLoading sold comps…